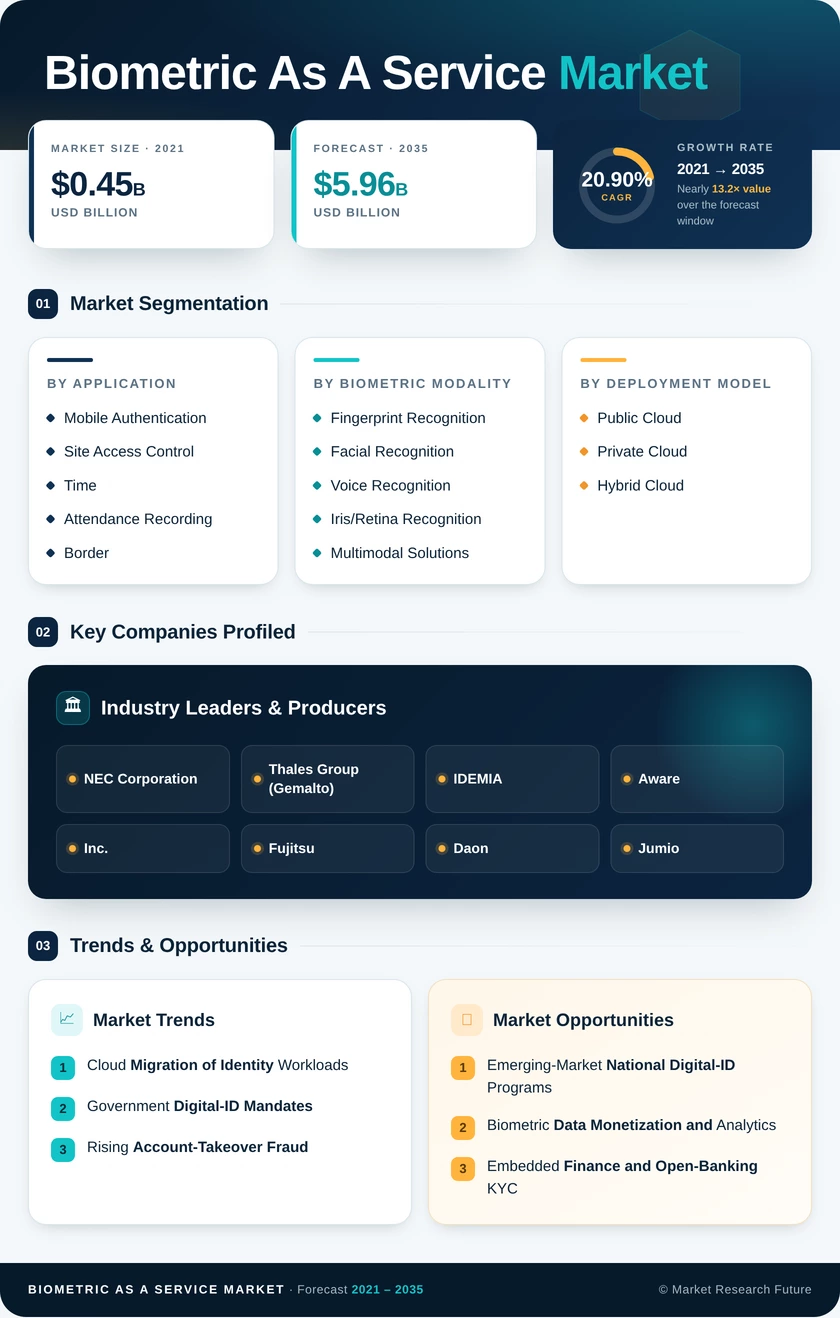
Biometric-as-a-Service Market (2026 - 2035)

ID: MRFR/ICT/9117-CR 141 Pages Ankit Gupta Last Updated: October 27, 2026
Biometric-as-a-Service Market Research Report Information By Component (Solution and Service), By Deployment (On-Premise, and Cloud-based), By Application (Configuration Management, Patch Management, Credentials Management, Threat Intelligence, and Others), And By Region (North America, Europe, Asia-Pacific, And Rest Of The World) – Market Forecast Till 2035.
Biometric-as-a-Service Market
Market Size
Forecast Period2026-2035
CAGR (2026-2035)20.90%
2025 Market SizeUSD 0.88 Billion
2035 Market SizeUSD 5.96 Billion
Key Players
NEC Corporation
Thales Group
IDEMIA
Aware, Inc.
Fujitsu
Daon
Opportunities
  • Emerging-Market National Digital-ID Programs
  • Biometric Data Monetization and Analytics
  • Embedded Finance and Open-Banking KYC
  1. 1 Market Overview | |
    1. 1.1 Study Assumptions & Market Definition | |
    2. 1.2 Scope of the Study | |
    3. 1.3 Research Methodology | |
  2. 2 Market Summary & Key Takeaways | |
  3. 3 Market Dynamics | |
    1. 3.1 Market Drivers Analysis | | |
      1. 3.1.1 Cloud Migration of Identity Workloads | | |
      2. 3.1.2 Government Digital-ID Mandates | | |
      3. 3.1.3 Rising Account-Takeover Fraud | | |
      4. 3.1.4 WebAuthn/FIDO2 Passwordless Adoption | | |
      5. 3.1.5 Deepfake Detection Regulation | | |
      6. 3.1.6 Smartphone Biometric Sensor Proliferation | | |
      7. 3.1.7 Post-Quantum Encryption Alignment | |
    2. 3.2 Market Restraints Analysis | | |
      1. 3.2.1 Data-Privacy and Biometric-Consent Laws | | |
      2. 3.2.2 Algorithmic Bias and Fairness Scrutiny | | |
      3. 3.2.3 Interoperability Gaps Across Vendors | | |
      4. 3.2.4 Latency and Uptime Concerns in Cloud Delivery | | |
      5. 3.2.5 Deepfake Sophistication Outpacing Defenses | |
    3. 3.3 Market Opportunity Analysis | | |
      1. 3.3.1 Emerging-Market National Digital-ID Programs | | |
      2. 3.3.2 Biometric Data Monetization and Analytics | | |
      3. 3.3.3 Embedded Finance and Open-Banking KYC | | |
      4. 3.3.4 Healthcare Remote-Patient Identity Verification | | |
      5. 3.3.5 Age-Verification Regulation for Digital Platforms | |
    4. 3.4 Industry Value Chain Analysis | |
    5. 3.5 Porter's Five Forces Analysis | |
  4. 4 Global Biometrics as a Service Market Size & Forecast (2021–2035) | |
    1. 4.1 Historical Market Size (2021–2025) | |
    2. 4.2 Current & Forecast Market Size (2026–2035) | |
    3. 4.3 Market Size by Revenue (USD Billion) | |
    4. 4.4 Year-over-Year Growth Analysis | |
  5. 5 Segmentation Analysis | |
    1. 5.1 By Application | | |
      1. 5.1.1 Mobile Authentication | | |
      2. 5.1.2 Site Access Control | | |
      3. 5.1.3 Time and Attendance Recording | | |
      4. 5.1.4 Border and Immigration Control | | |
      5. 5.1.5 Payment Authentication | |
    2. 5.2 By Biometric Modality | | |
      1. 5.2.1 Fingerprint Recognition | | |
      2. 5.2.2 Facial Recognition | | |
      3. 5.2.3 Voice Recognition | | |
      4. 5.2.4 Iris/Retina Recognition | | |
      5. 5.2.5 Multimodal Solutions | |
    3. 5.3 By Deployment Model | | |
      1. 5.3.1 Public Cloud | | |
      2. 5.3.2 Private Cloud | | |
      3. 5.3.3 Hybrid Cloud | |
    4. 5.4 By End-User Industry | | |
      1. 5.4.1 Government and Public Sector | | |
      2. 5.4.2 BFSI | | |
      3. 5.4.3 Healthcare | | |
      4. 5.4.4 Retail and E-Commerce | | |
      5. 5.4.5 IT and Telecom | |
  6. 6 Regional Analysis | |
    1. 6.1 North America | | |
      1. 6.1.1 United States | | |
      2. 6.1.2 Canada | | |
      3. 6.1.3 Mexico | |
    2. 6.2 Europe | | |
      1. 6.2.1 Germany | | |
      2. 6.2.2 United Kingdom | | |
      3. 6.2.3 France | | |
      4. 6.2.4 Italy | | |
      5. 6.2.5 Spain | | |
      6. 6.2.6 Nordic Countries | | |
      7. 6.2.7 Russia | | |
      8. 6.2.8 Rest of Europe | |
    3. 6.3 Asia-Pacific | | |
      1. 6.3.1 China | | |
      2. 6.3.2 India | | |
      3. 6.3.3 Japan | | |
      4. 6.3.4 South Korea | | |
      5. 6.3.5 ASEAN | | |
      6. 6.3.6 Rest of Asia-Pacific | |
    4. 6.4 South America | | |
      1. 6.4.1 Brazil | | |
      2. 6.4.2 Argentina | | |
      3. 6.4.3 Rest of South America | |
    5. 6.5 Middle East & Africa | | |
      1. 6.5.1 Saudi Arabia | | |
      2. 6.5.2 UAE | | |
      3. 6.5.3 South Africa | | |
      4. 6.5.4 Egypt | | |
      5. 6.5.5 Rest of MEA | |
  7. 7 Competitive Landscape | |
    1. 7.1 Market Share Analysis (2025) | |
    2. 7.2 Competitive Benchmarking Matrix | |
    3. 7.3 Company Profiles | | |
      1. 7.3.1 NEC Corporation | | |
      2. 7.3.2 Thales Group (Gemalto) | | |
      3. 7.3.3 IDEMIA | | |
      4. 7.3.4 Aware, Inc. | | |
      5. 7.3.5 Fujitsu | | |
      6. 7.3.6 Daon | | |
      7. 7.3.7 Jumio | | |
      8. 7.3.8 iProov | | |
      9. 7.3.9 BIO-key International | | |
      10. 7.3.10 Facephi | |
  8. 8 Future Outlook & Strategic Recommendations (2026–2035) | |
    1. 8.1 AI-Driven Adaptive Authentication | |
    2. 8.2 Platform Consolidation and Identity Super-Apps | |
    3. 8.3 Decentralized Identity and Self-Sovereign Credentials | |
    4. 8.4 Regulatory Harmonization and Cross-Border Interoperability | |
  9. 9 Recent Developments & News | |
  10. 10 Frequently Asked Questions (FAQs) | |
  11. 11 Report Scope & Methodology | |
    1. 11.1 Study Period & Base Year | |
    2. 11.2 Data Sources & Citations | |
    3. 11.3 Abbreviations | | LIST OF TABLES | |
  12. TABLE 1 Global Biometrics as a Service Market Size & Forecast, by Revenue (USD Billion), 2021–2035 | |
  13. TABLE 2 Global Biometrics as a Service Market – Year-over-Year Growth Analysis, 2021–2035 | |
  14. TABLE 3 Driver Impact Analysis – Biometrics as a Service Market | |
  15. TABLE 4 Restraints Impact Analysis – Biometrics as a Service Market | |
  16. TABLE 5 Global Biometrics as a Service Market Size, by Application, 2021–2035 (USD Billion) | |
  17. TABLE 6 Global Biometrics as a Service Market Size, by Biometric Modality, 2021–2035 (USD Billion) | |
  18. TABLE 7 Global Biometrics as a Service Market Size, by Deployment Model, 2021–2035 (USD Billion) | |
  19. TABLE 8 Global Biometrics as a Service Market Size, by End-User Industry, 2021–2035 (USD Billion) | |
  20. TABLE 9 Global Biometrics as a Service Market Size, by Region, 2021–2035 (USD Billion) | |
  21. TABLE 10 North America Biometrics as a Service Market Size, by Country, 2021–2035 (USD Billion) | |
  22. TABLE 11 Europe Biometrics as a Service Market Size, by Country, 2021–2035 (USD Billion) | |
  23. TABLE 12 Asia-Pacific Biometrics as a Service Market Size, by Country, 2021–2035 (USD Billion) | |
  24. TABLE 13 South America Biometrics as a Service Market Size, by Country, 2021–2035 (USD Billion) | |
  25. TABLE 14 Middle East & Africa Biometrics as a Service Market Size, by Country, 2021–2035 (USD Billion) | |
  26. TABLE 15 North America Biometrics as a Service Market Size, by Application, 2021–2035 (USD Billion) | |
  27. TABLE 16 North America Biometrics as a Service Market Size, by Biometric Modality, 2021–2035 (USD Billion) | |
  28. TABLE 17 North America Biometrics as a Service Market Size, by Deployment Model, 2021–2035 (USD Billion) | |
  29. TABLE 18 North America Biometrics as a Service Market Size, by End-User Industry, 2021–2035 (USD Billion) | |
  30. TABLE 19 Europe Biometrics as a Service Market Size, by Application, 2021–2035 (USD Billion) | |
  31. TABLE 20 Europe Biometrics as a Service Market Size, by Biometric Modality, 2021–2035 (USD Billion) | |
  32. TABLE 21 Europe Biometrics as a Service Market Size, by Deployment Model, 2021–2035 (USD Billion) | |
  33. TABLE 22 Europe Biometrics as a Service Market Size, by End-User Industry, 2021–2035 (USD Billion) | |
  34. TABLE 23 Asia-Pacific Biometrics as a Service Market Size, by Application, 2021–2035 (USD Billion) | |
  35. TABLE 24 Asia-Pacific Biometrics as a Service Market Size, by Biometric Modality, 2021–2035 (USD Billion) | |
  36. TABLE 25 Asia-Pacific Biometrics as a Service Market Size, by Deployment Model, 2021–2035 (USD Billion) | |
  37. TABLE 26 Asia-Pacific Biometrics as a Service Market Size, by End-User Industry, 2021–2035 (USD Billion) | |
  38. TABLE 27 South America Biometrics as a Service Market Size, by Application, 2021–2035 (USD Billion) | |
  39. TABLE 28 South America Biometrics as a Service Market Size, by Biometric Modality, 2021–2035 (USD Billion) | |
  40. TABLE 29 South America Biometrics as a Service Market Size, by Deployment Model, 2021–2035 (USD Billion) | |
  41. TABLE 30 South America Biometrics as a Service Market Size, by End-User Industry, 2021–2035 (USD Billion) | |
  42. TABLE 31 Middle East & Africa Biometrics as a Service Market Size, by Application, 2021–2035 (USD Billion) | |
  43. TABLE 32 Middle East & Africa Biometrics as a Service Market Size, by Biometric Modality, 2021–2035 (USD Billion) | |
  44. TABLE 33 Middle East & Africa Biometrics as a Service Market Size, by Deployment Model, 2021–2035 (USD Billion) | |
  45. TABLE 34 Middle East & Africa Biometrics as a Service Market Size, by End-User Industry, 2021–2035 (USD Billion) | |
  46. TABLE 35 Competitive Benchmarking Matrix – Global Biometrics as a Service Market, 2025 | |
  47. TABLE 36 Company Profiles – Key Players, Global Biometrics as a Service Market | |
  48. TABLE 37 Recent Developments & Strategic Announcements, 2023–2025 | |
  49. TABLE 38 Report Scope and Methodology Summary | | LIST OF FIGURES | |
  50. FIGURE 1 Biometrics as a Service Market Dynamics – Drivers, Restraints, and Opportunities | |
  51. FIGURE 2 Value Chain Analysis – Biometrics as a Service Market | |
  52. FIGURE 3 Porter's Five Forces Analysis – Biometrics as a Service Market | |
  53. FIGURE 4 Global Biometrics as a Service Market Size Trend (USD Billion), 2021–2035 | |
  54. FIGURE 5 Global Biometrics as a Service Market Share, by Application (2025) | |
  55. FIGURE 6 Global Biometrics as a Service Market Share, by Biometric Modality (2025) | |
  56. FIGURE 7 Global Biometrics as a Service Market Share, by Deployment Model (2025) | |
  57. FIGURE 8 Global Biometrics as a Service Market Share, by End-User Industry (2025) | |
  58. FIGURE 9 Global Biometrics as a Service Market Share, by Region (2025) | |
  59. FIGURE 10 North America Biometrics as a Service Market – Country-Level Share (2025) | |
  60. FIGURE 11 Europe Biometrics as a Service Market – Country-Level Share (2025) | |
  61. FIGURE 12 Asia-Pacific Biometrics as a Service Market – Country-Level Share (2025) | |
  62. FIGURE 13 South America Biometrics as a Service Market – Country-Level Share (2025) | |
  63. FIGURE 14 Middle East & Africa Biometrics as a Service Market – Country-Level Share (2025) | |
  64. FIGURE 15 Competitive Landscape Heat Map – Global Biometrics as a Service Market

Segmentation Quick Reference

Dimension Sub-Segments Dominant Segment Fastest Growing Segment
By Application Mobile Authentication, Site Access Control, Time and Attendance Recording, Border and Immigration Control, Payment Authentication Mobile Authentication Border and Immigration Control
By Biometric Modality Fingerprint Recognition, Facial Recognition, Voice Recognition, Iris/Retina Recognition, Multimodal Solutions Fingerprint Recognition Multimodal Solutions
By Deployment Model Public Cloud, Private Cloud, Hybrid Cloud Public Cloud Hybrid Cloud
By End-User Industry Government and Public Sector, BFSI, Healthcare, Retail and E-Commerce, IT and Telecom Government and Public Sector BFSI

Market Segmentation Overview

By Application

Sub-Segment Key Trend
Mobile Authentication Smartphone-native biometric sensors driving API-call volume growth
Site Access Control Cloud-managed physical access replacing legacy badge readers
Time and Attendance Recording HR-platform integration creating recurring subscription demand
Border and Immigration Control ICAO e-passport mandates accelerating automated gate deployments
Payment Authentication Open-banking SCA rules embedding biometrics into transaction flows

Mobile authentication remains the revenue anchor as every new smartphone shipped with embedded biometric sensors expands the serviceable population for cloud-based identity verification. Border and immigration control is scaling rapidly as governments invest in biometric entry/exit infrastructure.

By Biometric Modality

Sub-Segment Key Trend
Fingerprint Recognition Lowest per-transaction cost with decades of algorithm maturity
Facial Recognition Selfie-based onboarding eliminating dedicated hardware requirements
Voice Recognition Call-center anti-fraud overlays growing in BFSI verticals
Iris/Retina Recognition High-assurance government programs demanding non-contact capture
Multimodal Solutions Anti-spoofing mandates driving fusion of two or more modalities

Fingerprint recognition benefits from the widest hardware compatibility across enterprise and consumer devices. Multimodal solutions are gaining share as regulators and enterprise risk teams demand layered assurance beyond any single biometric trait.

By Deployment Model

Sub-Segment Key Trend
Public Cloud Elastic scaling and pay-per-use pricing attracting SMEs and fintechs
Private Cloud Data-sovereignty laws driving on-premises cloud deployments in regulated sectors
Hybrid Cloud Split-processing architectures satisfying both compliance and scalability needs

Public cloud deployment dominates transaction volumes, while hybrid cloud is capturing incremental enterprise spend as regulated industries seek compliance-flexible architectures.

By End-User Industry

Sub-Segment Key Trend
Government and Public Sector National digital-ID programs generating billions of annual API calls
BFSI AML/KYC mandates embedding biometric verification into onboarding and payments
Healthcare Telehealth identity verification and controlled-substance dispensing
Retail and E-Commerce Frictionless checkout biometrics reducing cart abandonment
IT and Telecom SIM-registration mandates and workforce identity management

Government programs provide the volume base, while BFSI delivers the highest revenue-per-transaction margins driven by regulatory-compliance urgency and fraud-loss economics.


Download PDF ×

We do not share your information with anyone. However, we may send you emails based on your report interest from time to time. You may contact us at any time to opt-out.