Biobanking Market (2025 - 2035)

Biobanking Market Research Report: Size, Share, Trend Analysis By Sample Type (Blood Products, Tissues, Cells, Nucleic Acids, Microbiome Samples), By Applications (Research and Development, Clinical Trials, Personalized Medicine, Regenerative Medicine), By End-use (Academic Research Institutions, Biotechnology Companies, Pharmaceutical Companies, Government Organizations), By Storage Type (Vapor Phase Storage, Liquid Phase Storage, Cryopreservation Storage), and By Regional (North America, Europe, South America, Asia Pacific, Middle East and Africa) - Growth Outlook & Industry Forecast 2025 To 2035

Forecast Period
2025-2035
CAGR
5.27%
2025 Market Size
USD 51.32 Billion
2035 Market Size
USD 85.77 Billion
Healthcare ● Updated August 2026 Report ID: MRFR/HC/4511-HCR | Pages: 200 | Author: Rahul Gotadki, Kinjoll Dey
  1. 1 Market Overview |
    1. 1.1 Study Assumptions & Market Definition |
    2. 1.2 Scope of the Study |
    3. 1.3 Research Methodology
  2. 2 Market Summary & Key Report Takeaways |
    1. 2.1 By Equipment |
    2. 2.2 By Application and Ownership |
    3. 2.3 By Geography
  3. 3 Global Market Size & Forecast (2021–2035) |
    1. 3.1 Historical Market Size (2021–2025) |
    2. 3.2 Current & Forecast Market Size (2026–2035) |
    3. 3.3 Year-over-Year Growth Analysis
  4. 4 Market Drivers Analysis |
    1. 4.1 Precision Medicine Rewrites the Specification |
    2. 4.2 Donor-Eligibility Guidance Removes a Pricing Overhang |
    3. 4.3 Cord Blood and Cell Therapy Pull Hospitals In |
    4. 4.4 Automation Economics Clear the Hurdle Rate
  5. 5 Market Restraints Analysis |
    1. 5.1 Capital Intensity of Automated Infrastructure |
    2. 5.2 Consent Fragmentation and Cross-Border Transfer |
    3. 5.3 Sample Utilisation and Quality Variability
  6. 6 Market Opportunity Analysis |
    1. 6.1 Federated Access Platforms as a Revenue Layer |
    2. 6.2 Emerging-Market Population Cohorts |
    3. 6.3 AI Quality Scoring as a Premium Service |
    4. 6.4 Decentralised and Home-Collection Workflows |
    5. 6.5 Sustainability-Linked Retrofits |
    6. 6.6 Industry Value Chain Analysis |
    7. 6.7 Porter's Five Forces Analysis
  7. 7 Regional Analysis |
    1. 7.1 North America | |
      1. 7.1.1 United States | |
      2. 7.1.2 Canada | |
      3. 7.1.3 Mexico |
    2. 7.2 Europe | |
      1. 7.2.1 Germany | |
      2. 7.2.2 United Kingdom | |
      3. 7.2.3 France | |
      4. 7.2.4 Italy | |
      5. 7.2.5 Spain | |
      6. 7.2.6 Nordic Countries | |
      7. 7.2.7 Russia | |
      8. 7.2.8 Rest of Europe |
    3. 7.3 Asia-Pacific | |
      1. 7.3.1 China | |
      2. 7.3.2 India | |
      3. 7.3.3 Japan | |
      4. 7.3.4 South Korea | |
      5. 7.3.5 ASEAN | |
      6. 7.3.6 Rest of Asia-Pacific |
    4. 7.4 South America | |
      1. 7.4.1 Brazil | |
      2. 7.4.2 Argentina | |
      3. 7.4.3 Rest of South America |
    5. 7.5 Middle East & Africa | |
      1. 7.5.1 Saudi Arabia | |
      2. 7.5.2 UAE | |
      3. 7.5.3 South Africa | |
      4. 7.5.4 Egypt | |
      5. 7.5.5 Rest of Middle East & Africa
  8. 8 Future Outlook (2026–2035) |
    1. 8.1 Autonomous Repository Operations |
    2. 8.2 Platform Economics and Access Fees |
    3. 8.3 Energy and the Sustainability Ledger |
    4. 8.4 Consolidation and Vertical Integration
  9. 9 Segmentation Analysis |
    1. 9.1 By Equipment | |
      1. 9.1.1 Cryogenic Storage Systems | | |
        1. 9.1.1.1 Refrigerators | | |
        2. 9.1.1.2 Freezers | | |
        3. 9.1.1.3 Ice Machines | |
      2. 9.1.2 Alarm and Monitoring Systems | |
      3. 9.1.3 Media & Consumables |
    2. 9.2 By Application | |
      1. 9.2.1 Regenerative Medicine | |
      2. 9.2.2 Drug Discovery | |
      3. 9.2.3 Clinical Diagnostics | |
      4. 9.2.4 Life Science Research | |
      5. 9.2.5 Other Applications |
    3. 9.3 By Ownership Type | |
      1. 9.3.1 Public / Government | |
      2. 9.3.2 Academic / Non-profit | |
      3. 9.3.3 Private / Commercial | |
      4. 9.3.4 Hospital-Based
  10. 10 Competitive Landscape |
    1. 10.1 Market Concentration Analysis (2026) |
    2. 10.2 Competitive Benchmarking Matrix |
    3. 10.3 Company Profiles | |
      1. 10.3.1 Thermo Fisher Scientific | |
      2. 10.3.2 Becton Dickinson | |
      3. 10.3.3 Azenta Life Sciences | |
      4. 10.3.4 Merck KGaA | |
      5. 10.3.5 Danaher (Beckman Coulter) | |
      6. 10.3.6 Hamilton Company | |
      7. 10.3.7 BioLife Solutions | |
      8. 10.3.8 PHC Holdings | |
      9. 10.3.9 QIAGEN | |
      10. 10.3.10 Avantor | |
      11. 10.3.11 Greiner Bio-One | |
      12. 10.3.12 Cryoport Systems
  11. 11 Recent News & Developments
  12. 12 Report Scope & Methodology |
    1. 12.1 Study Period & Base Year |
    2. 12.2 Valuation Currency & Conversion |
    3. 12.3 Abbreviations
  13. 13 Detailed Sources & Citations
  14. 14 Frequently Asked Questions
  15. 15 LIST OF TABLES |
  16. TABLE 1 Global Biobanking Market Size & Forecast, by Revenue (USD Billion), 2021–2035 |
  17. TABLE 2 Global Biobanking Market – Year-over-Year Growth Analysis, 2021–2035 |
  18. TABLE 3 Driver Impact Analysis – Estimated Contribution to CAGR, 2026–2035 |
  19. TABLE 4 Restraint Impact Analysis – Estimated Drag on CAGR, 2026–2035 |
  20. TABLE 5 Global Biobanking Market Size, by Region, 2021–2035 (USD Billion) |
  21. TABLE 6 North America Biobanking Market Size, by Country, 2021–2035 (USD Billion) |
  22. TABLE 7 Europe Biobanking Market Size, by Country, 2021–2035 (USD Billion) |
  23. TABLE 8 Asia-Pacific Biobanking Market Size, by Country, 2021–2035 (USD Billion) |
  24. TABLE 9 South America Biobanking Market Size, by Country, 2021–2035 (USD Billion) |
  25. TABLE 10 Middle East & Africa Biobanking Market Size, by Country, 2021–2035 (USD Billion) |
  26. TABLE 11 Global Biobanking Market Size, by Equipment, 2021–2035 (USD Billion) |
  27. TABLE 12 Global Biobanking Market Size, by Cryogenic Storage Sub-Type, 2021–2035 (USD Billion) |
  28. TABLE 13 Global Biobanking Market Size, by Application, 2021–2035 (USD Billion) |
  29. TABLE 14 Global Biobanking Market Size, by Ownership Type, 2021–2035 (USD Billion) |
  30. TABLE 15 North America Biobanking Market Size, by Equipment, 2021–2035 (USD Billion) |
  31. TABLE 16 North America Biobanking Market Size, by Application, 2021–2035 (USD Billion) |
  32. TABLE 17 Europe Biobanking Market Size, by Equipment, 2021–2035 (USD Billion) |
  33. TABLE 18 Europe Biobanking Market Size, by Application, 2021–2035 (USD Billion) |
  34. TABLE 19 Asia-Pacific Biobanking Market Size, by Equipment, 2021–2035 (USD Billion) |
  35. TABLE 20 Asia-Pacific Biobanking Market Size, by Application, 2021–2035 (USD Billion) |
  36. TABLE 21 South America Biobanking Market Size, by Ownership Type, 2021–2035 (USD Billion) |
  37. TABLE 22 Middle East & Africa Biobanking Market Size, by Ownership Type, 2021–2035 (USD Billion) |
  38. TABLE 23 Competitive Benchmarking Matrix – Global Biobanking Market, 2026 |
  39. TABLE 24 Company Profiles – Key Players, Global Biobanking Market |
  40. TABLE 25 Recent Developments & Strategic Announcements, 2023–2025 |
  41. TABLE 26 Report Scope & Methodology Summary |
  42. TABLE 27 Detailed Sources & Citations Index
  43. 16 LIST OF FIGURES |
  44. FIGURE 1 Global Biobanking Market Dynamics – Drivers, Restraints, Opportunities |
  45. FIGURE 2 Industry Value Chain Analysis – Collection to Data Access |
  46. FIGURE 3 Porter's Five Forces Analysis, 2026 |
  47. FIGURE 4 Global Market Size Trend Line, 2021–2035 (USD Billion) |
  48. FIGURE 5 Year-over-Year Growth Trajectory, 2022–2035 (%) |
  49. FIGURE 6 Market Share by Equipment, 2025 vs 2035 (%) |
  50. FIGURE 7 Market Share by Application, 2025 vs 2035 (%) |
  51. FIGURE 8 Market Share by Ownership Type, 2025 (%) |
  52. FIGURE 9 Regional Revenue Share Distribution, 2025 (%) |
  53. FIGURE 10 Regional CAGR Comparison, 2026–2035 (%) |
  54. FIGURE 11 Country-Level Revenue Concentration – Top 10 Markets, 2025 |
  55. FIGURE 12 Competitive Landscape – Estimated Revenue Share Bands, 2026 |
  56. FIGURE 13 Strategic Positioning Matrix – Automation Depth vs Service Breadth |
  57. FIGURE 14 Cold-Chain Energy Intensity Benchmark by Storage Class
Share::
Request Free Sample

Segmentation Quick Reference

DimensionSub-SegmentsDominant SegmentFastest Growing Segment
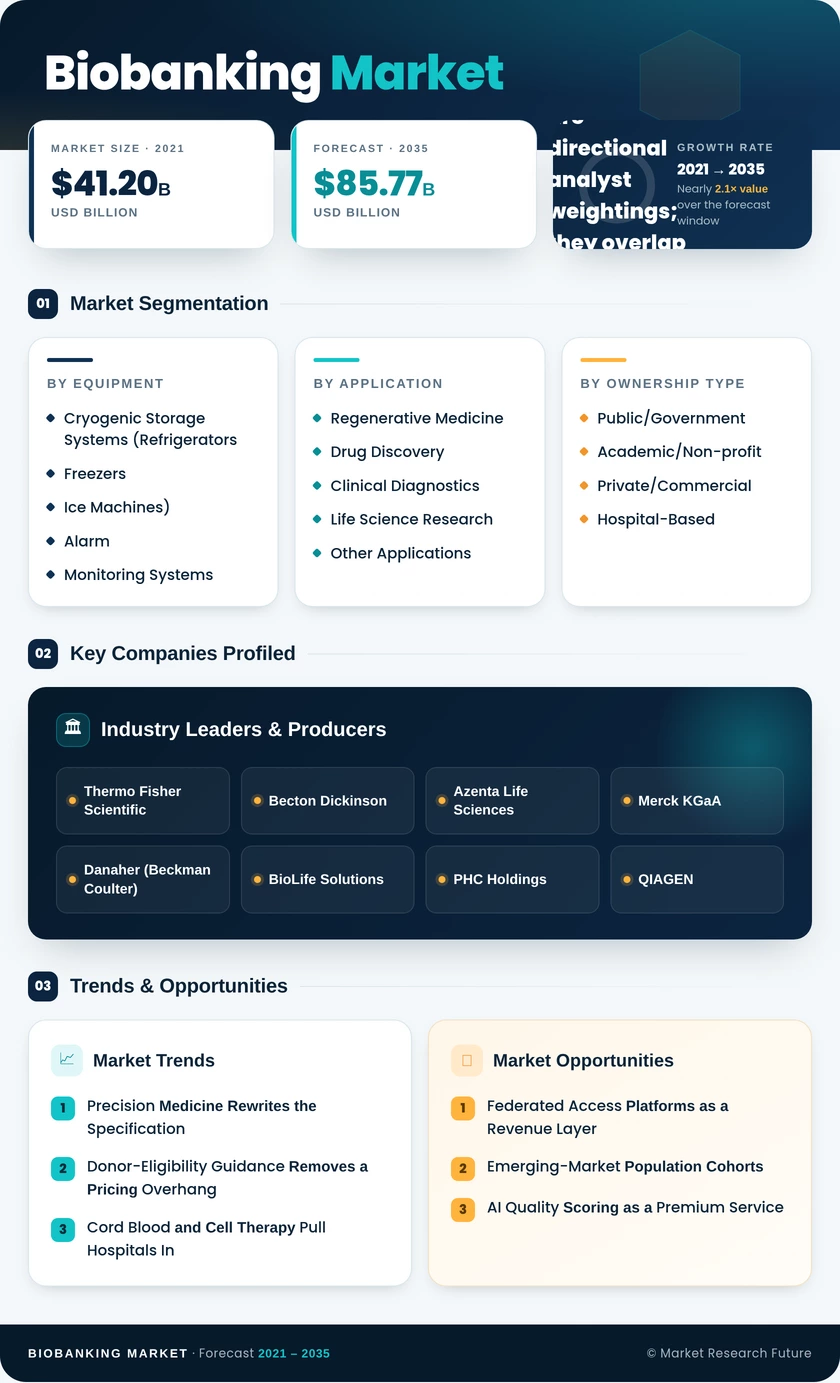
By EquipmentCryogenic Storage Systems (Refrigerators, Freezers, Ice Machines); Alarm and Monitoring Systems; Media & ConsumablesCryogenic Storage SystemsFreezers
By ApplicationRegenerative Medicine; Drug Discovery; Clinical Diagnostics; Life Science Research; Other ApplicationsRegenerative MedicineClinical Diagnostics
By Ownership TypePublic/Government; Academic/Non-profit; Private/Commercial; Hospital-BasedPublic / GovernmentAcademic / Non-profit
By GeographyNorth America; Europe; Asia-Pacific; South America; Middle East & AfricaNorth AmericaAsia-Pacific


Market Segmentation Overview

By Equipment

Sub-SegmentKey Trend
Cryogenic Storage SystemsVapour-phase nitrogen vaults replacing mechanical-only architectures for clinical-grade material
RefrigeratorsShort-hold units increasingly bundled with automated inventory verification.
FreezersSet-point elevation to −70 °C gaining acceptance as an energy-cost lever
Ice MachinesCommoditised; demand tracks preanalytical transport volume rather than technology change.
Alarm and Monitoring SystemsCloud telemetry and predictive excursion alerts becoming an audit prerequisite.
Media & ConsumablesRecurring revenue anchor; cryoprotectant chemistry advancing for cell-therapy viability


Equipment demand is bifurcating. High-value cryogenic and monitoring assets attract capital scrutiny and long procurement cycles, while consumables generate the predictable annuity that finances replacement. Vendors capable of selling both under a single service agreement are winning the largest institutional contracts.

By Application

Sub-SegmentKey Trend
Regenerative MedicineCommercial cell and gene therapy launches pulling storage demand from research into manufacturing.
Drug DiscoverySponsors retain data rights while outsourcing physical custody of annotated collections.
Clinical DiagnosticsCompanion diagnostic development driving demand for matched tumour-normal specimen sets.
Life Science ResearchMulti-omics readiness now a baseline specification rather than a premium option
Other ApplicationsForensic, veterinary, and agricultural repositories adopting clinical-grade cold-chain standards


Application mix determines pricing power. Clinical and therapeutic uses command materially higher revenue per vial than archival research storage because they carry validation, documentation, and liability obligations that pure research collections do not.

By Ownership Type

Sub-SegmentKey Trend
Public / GovernmentNational cohort mandates and preparedness funding sustain the largest single procurement base.
Academic / Non-profitGrant conditions requiring specimen retention accelerating capacity additions
Private / CommercialOutsourced custody models and cord-blood services expanding recurring contract revenue
Hospital-BasedProximity to patient consent creating strategic leverage over downstream data rights


Ownership structure predicts investment behaviour more reliably than geography. Public and hospital operators optimise for compliance and continuity; commercial operators optimise for utilisation and margin. That divergence shapes which vendors and contract structures each group selects.




Share::
Request Free Sample
Download PDF ×

We do not share your information with anyone. However, we may send you emails based on your report interest from time to time. You may contact us at any time to opt-out.