Automotive Plastics Market Segmentation
Automotive Plastics Market By Type (USD Billion, 2025-2035)
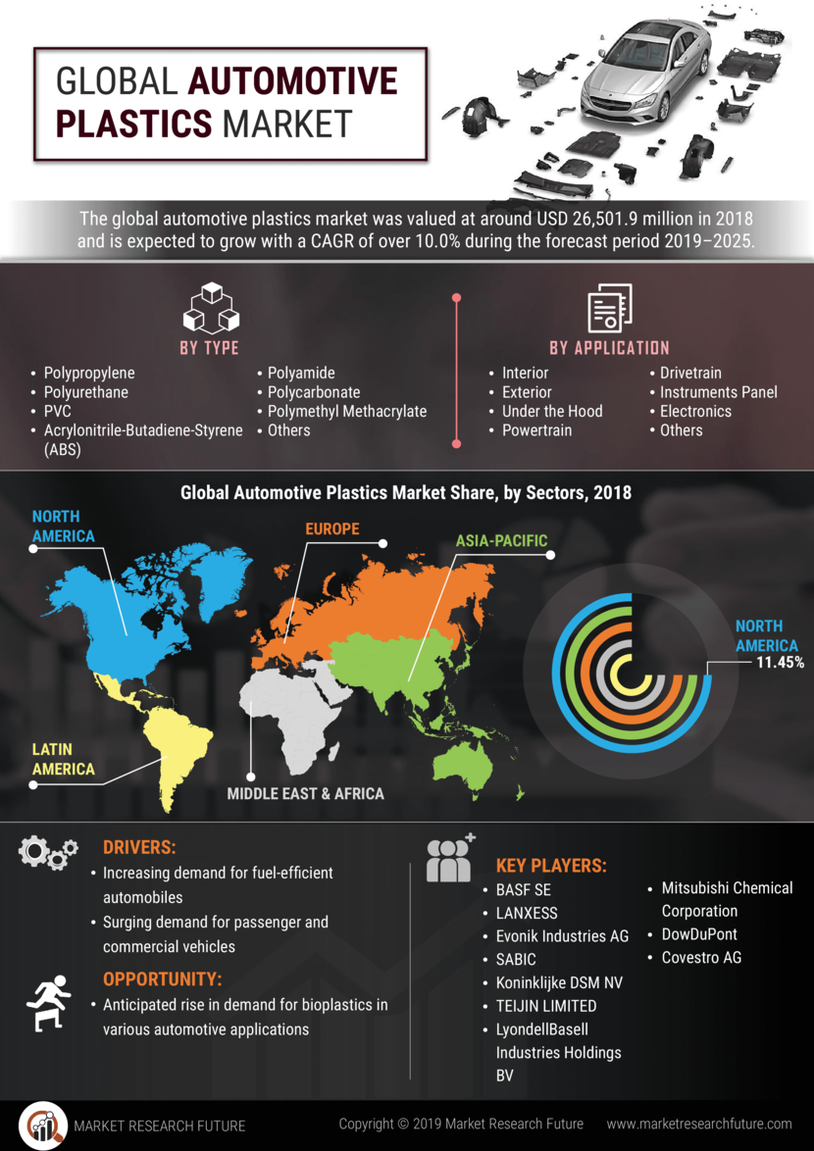
- Polypropylene
- Polyurethane
- PVC
- Acrylonitrile-Butadiene-Styrene (ABS)
- Polyamide
- Polycarbonate
- Polymethyl Methacrylate
- Others
Automotive Plastics Market By Application (USD Billion, 2025-2035)
- Interior
- Exterior
- Under the hood
- Powertrain
- Drivetrain
- Instruments Panel
- Electronics
- Others