Automotive Instrument Cluster Market (2026 - 2035)

ID: MRFR/AT/3803-HCR 100 Pages Triveni Bhoyar Last Updated: September 10, 2026
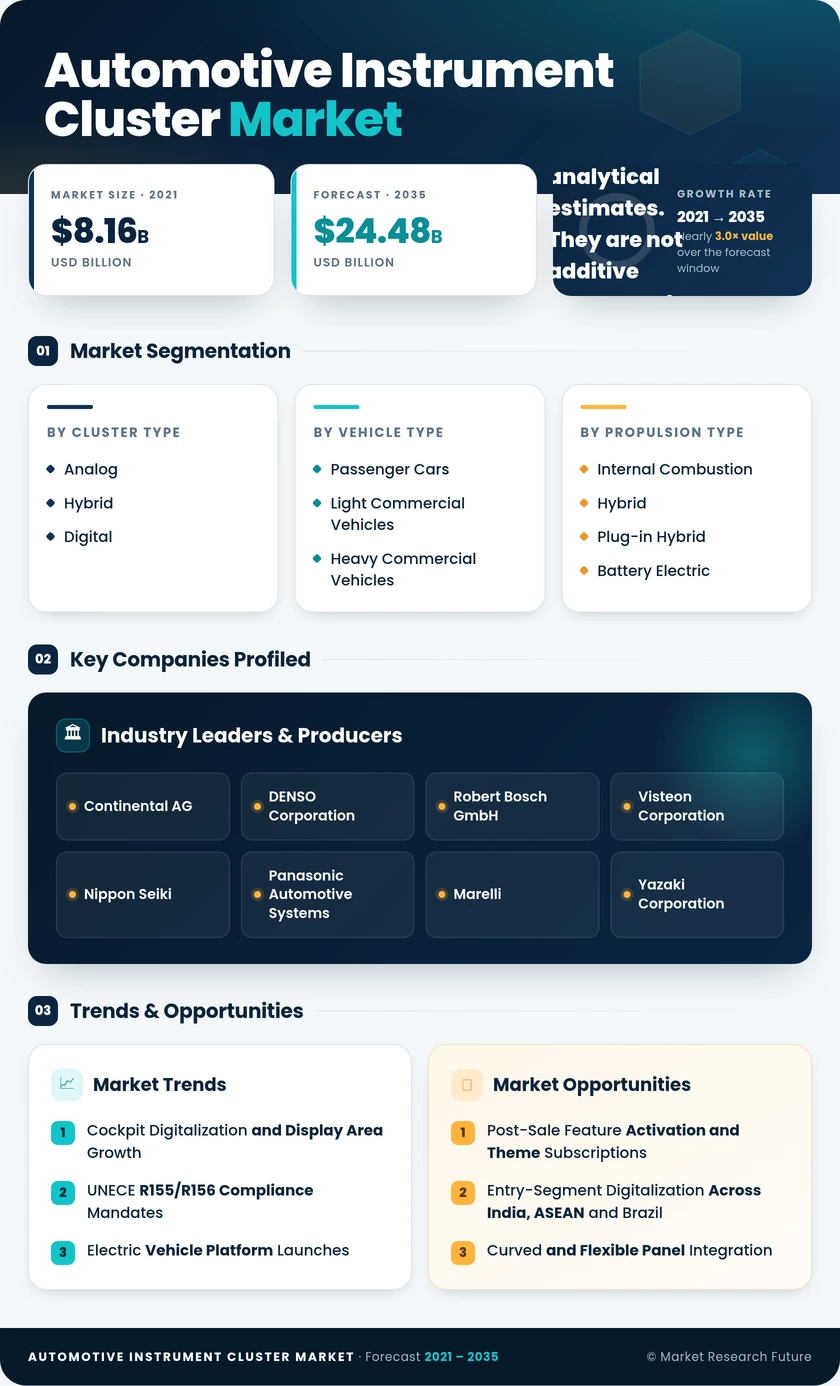
Automotive Instrument Cluster Market Research Report By Cluster Type (Analog, Hybrid, Digital), By Vehicle Type (Passenger Cars, Light Commercial Vehicles, Heavy Commercial Vehicles), By Propulsion Type (Internal Combustion, Hybrid and Plug-in Hybrid, Battery Electric), By Display Technology (TFT-LCD, Segmented LCD, OLED, Others (Micro-LED, Hybrid)), By Sales Channel (OEM, Aftermarket) - Forecast to 2035
Automotive Instrument Cluster Market
Market Size
Forecast Period2026-2035
CAGR (2026-2035)8.42%
2025 Market SizeUSD 10.94 Billion
2035 Market SizeUSD 24.48 Billion
Key Players
Continental AG
DENSO Corporation
Robert Bosch GmbH
Visteon Corporation
Nippon Seiki
Panasonic Automotive Systems
Opportunities
  • Post-Sale Feature Activation and Theme Subscriptions
  • Entry-Segment Digitalization Across India, ASEAN and Brazil
  • Curved and Flexible Panel Integration
  1. 1 Market Summary | |
    1. 1.1 Study Assumptions & Market Definition | |
    2. 1.2 Scope of the Study | |
    3. 1.3 Research Methodology | |
  2. 2 Key Report Takeaways | |
    1. 2.1 By Technology | |
    2. 2.2 By Sector | |
    3. 2.3 By Geography | |
  3. 3 Market Size & Forecast (2021–2035) | |
    1. 3.1 Historical Market Size (2021–2025) | |
    2. 3.2 Current & Forecast Market Size (2026–2035) | |
    3. 3.3 Market Size by Revenue (USD Billion) | |
    4. 3.4 Year-over-Year Growth Analysis | |
  4. 4 Driver Impact Analysis | |
    1. 4.1 Cockpit Digitalization and Display Area Growth | |
    2. 4.2 UNECE R155/R156 Compliance Mandates | |
    3. 4.3 Electric Vehicle Platform Launches | |
    4. 4.4 ADAS Visualization Requirements | |
    5. 4.5 Zonal and Domain Architecture Consolidation | |
    6. 4.6 Software-Defined Vehicle Monetization | |
    7. 4.7 Emerging-Market Content Premiumization | |
  5. 5 Restraints Impact Analysis | |
    1. 5.1 Display Panel and Semiconductor Supply Volatility | |
    2. 5.2 Pillar-to-Pillar Display Cannibalization | |
    3. 5.3 ISO 26262 Validation Cost Burden | |
    4. 5.4 Panel Price Deflation from Asian Entrants | |
    5. 5.5 VIN-Locked Cryptography Limiting Retrofit | |
  6. 6 Opportunities | |
    1. 6.1 Post-Sale Feature Activation and Theme Subscriptions | |
    2. 6.2 Entry-Segment Digitalization Across India, ASEAN and Brazil | |
    3. 6.3 Curved and Flexible Panel Integration | |
    4. 6.4 Authorised Retrofit Provisioning Ecosystems | |
    5. 6.5 Fusion of Cluster and Augmented-Reality Head-Up Display | |
  7. 7 Regional Market Share & Country-Level Analysis | |
    1. 7.1 North America | | |
      1. 7.1.1 United States | | |
      2. 7.1.2 Canada | | |
      3. 7.1.3 Mexico | |
    2. 7.2 Europe | | |
      1. 7.2.1 Germany | | |
      2. 7.2.2 United Kingdom | | |
      3. 7.2.3 France | | |
      4. 7.2.4 Italy | | |
      5. 7.2.5 Spain | | |
      6. 7.2.6 Nordic Countries | | |
      7. 7.2.7 Russia | | |
      8. 7.2.8 Rest of Europe | |
    3. 7.3 Asia-Pacific | | |
      1. 7.3.1 China | | |
      2. 7.3.2 India | | |
      3. 7.3.3 Japan | | |
      4. 7.3.4 South Korea | | |
      5. 7.3.5 ASEAN | | |
      6. 7.3.6 Rest of Asia-Pacific | |
    4. 7.4 South America | | |
      1. 7.4.1 Brazil | | |
      2. 7.4.2 Argentina | | |
      3. 7.4.3 Rest of South America | |
    5. 7.5 Middle East & Africa | | |
      1. 7.5.1 Saudi Arabia | | |
      2. 7.5.2 UAE | | |
      3. 7.5.3 South Africa | | |
      4. 7.5.4 Egypt | | |
      5. 7.5.5 Rest of Middle East & Africa | |
  8. 8 Future Outlook (2026–2035) | |
    1. 8.1 Artificial Intelligence in Cockpit Rendering | |
    2. 8.2 Platform Economics and Licence Revenue | |
    3. 8.3 Electrification Supercycle Effects | |
    4. 8.4 Circularity and Materials Reporting | |
  9. 9 Segmentation Analysis | |
    1. 9.1 By Cluster Type | | |
      1. 9.1.1 Analog | | |
      2. 9.1.2 Hybrid | | |
      3. 9.1.3 Digital | |
    2. 9.2 By Vehicle Type | | |
      1. 9.2.1 Passenger Cars | | |
      2. 9.2.2 Light Commercial Vehicles | | |
      3. 9.2.3 Heavy Commercial Vehicles | |
    3. 9.3 By Propulsion Type | | |
      1. 9.3.1 Internal Combustion | | |
      2. 9.3.2 Hybrid and Plug-in Hybrid | | |
      3. 9.3.3 Battery Electric | |
    4. 9.4 By Display Technology | | |
      1. 9.4.1 TFT-LCD | | |
      2. 9.4.2 Segmented LCD | | |
      3. 9.4.3 OLED | | |
      4. 9.4.4 Others (Micro-LED, Hybrid) | |
    5. 9.5 By Sales Channel | | |
      1. 9.5.1 OEM | | |
      2. 9.5.2 Aftermarket | |
  10. 10 Competitive Landscape | |
    1. 10.1 Market Share Analysis (2026) | |
    2. 10.2 Competitive Benchmarking Matrix | |
    3. 10.3 Company Profiles | | |
      1. 10.3.1 Continental AG | | |
      2. 10.3.2 DENSO Corporation | | |
      3. 10.3.3 Robert Bosch GmbH | | |
      4. 10.3.4 Visteon Corporation | | |
      5. 10.3.5 Nippon Seiki | | |
      6. 10.3.6 Panasonic Automotive Systems | | |
      7. 10.3.7 Marelli | | |
      8. 10.3.8 Yazaki Corporation | | |
      9. 10.3.9 LG Display | | |
      10. 10.3.10 BOE Varitronix | | |
      11. 10.3.11 HARMAN International | |
  11. 11 Recent News & Developments | |
  12. 12 Report Scope & Methodology | |
    1. 12.1 Study Period & Base Year | |
    2. 12.2 Data Sources & Citations | |
    3. 12.3 Abbreviations | |
  13. 13 Detailed Sources & Citations | |
  14. 14 Frequently Asked Questions | | LIST OF TABLES | |
  15. TABLE 1 Global Automotive Instrument Cluster Market Size & Forecast, by Revenue (USD Billion), 2021–2035 | |
  16. TABLE 2 Global Automotive Instrument Cluster Market – Year-over-Year Growth Analysis, 2021–2035 | |
  17. TABLE 3 Driver Impact Analysis Matrix, 2026–2035 | |
  18. TABLE 4 Restraint Impact Analysis Matrix, 2026–2035 | |
  19. TABLE 5 Global Market Size, by Region, 2021–2035 (USD Billion) | |
  20. TABLE 6 North America Market Size, by Country, 2021–2035 (USD Billion) | |
  21. TABLE 7 Europe Market Size, by Country, 2021–2035 (USD Billion) | |
  22. TABLE 8 Asia-Pacific Market Size, by Country, 2021–2035 (USD Billion) | |
  23. TABLE 9 South America Market Size, by Country, 2021–2035 (USD Billion) | |
  24. TABLE 10 Middle East & Africa Market Size, by Country, 2021–2035 (USD Billion) | |
  25. TABLE 11 Global Market Size, by Cluster Type, 2021–2035 (USD Billion) | |
  26. TABLE 12 Global Market Size, by Vehicle Type, 2021–2035 (USD Billion) | |
  27. TABLE 13 Global Market Size, by Propulsion Type, 2021–2035 (USD Billion) | |
  28. TABLE 14 Global Market Size, by Display Technology, 2021–2035 (USD Billion) | |
  29. TABLE 15 Global Market Size, by Sales Channel, 2021–2035 (USD Billion) | |
  30. TABLE 16 Competitive Benchmarking Matrix, 2026 | |
  31. TABLE 17 Company Profiles – Key Players | |
  32. TABLE 18 Recent Developments & Strategic Announcements, 2023–2025 | |
  33. TABLE 19 Report Scope & Methodology Summary | |
  34. TABLE 20 Detailed Sources & Citations Index | |
  35. TABLE 21 North America Market Size, by Cluster Type, 2021–2035 (USD Billion) | |
  36. TABLE 22 Europe Market Size, by Display Technology, 2021–2035 (USD Billion) | |
  37. TABLE 23 Asia-Pacific Market Size, by Propulsion Type, 2021–2035 (USD Billion) | |
  38. TABLE 24 South America Market Size, by Vehicle Type, 2021–2035 (USD Billion) | |
  39. TABLE 25 Middle East & Africa Market Size, by Sales Channel, 2021–2035 (USD Billion) | | LIST OF FIGURES | |
  40. FIGURE 1 Market Dynamics – Drivers, Restraints & Opportunities Framework | |
  41. FIGURE 2 Industry Value Chain Analysis | |
  42. FIGURE 3 Porter's Five Forces Analysis | |
  43. FIGURE 4 Global Market Size Trend, 2021–2035 (USD Billion) | |
  44. FIGURE 5 Year-over-Year Growth Trajectory, 2022–2035 (%) | |
  45. FIGURE 6 Market Share by Cluster Type, 2025 vs 2035 (%) | |
  46. FIGURE 7 Market Share by Vehicle Type, 2025 (%) | |
  47. FIGURE 8 Market Share by Propulsion Type, 2025 vs 2035 (%) | |
  48. FIGURE 9 Market Share by Display Technology, 2025 (%) | |
  49. FIGURE 10 Market Share by Sales Channel, 2025 (%) | |
  50. FIGURE 11 Regional Market Share Distribution, 2025 (%) | |
  51. FIGURE 12 Regional CAGR Comparison, 2026–2035 (%) | |
  52. FIGURE 13 Country-Level Share within North America, 2025 (%) | |
  53. FIGURE 14 Country-Level Share within Asia-Pacific, 2025 (%) | |
  54. FIGURE 15 Competitive Landscape – Estimated Revenue Share Bands, 2026 | |
  55. FIGURE 16 Competitive Positioning Quadrant – Hardware Scale vs Software Depth | |
  56. FIGURE 17 Content-per-Vehicle Escalation Curve, 2021–2035 (USD)

Segmentation Quick Reference

DimensionSub-SegmentsDominant SegmentFastest Growing Segment
By Cluster TypeAnalog, Hybrid, DigitalAnalogDigital
By Vehicle TypePassenger Cars, Light Commercial Vehicles, Heavy Commercial VehiclesPassenger CarsHeavy Commercial Vehicles
By Propulsion TypeInternal Combustion, Hybrid and Plug-in Hybrid, Battery ElectricInternal CombustionBattery Electric
By Display TechnologyTFT-LCD, Segmented LCD, OLED, OthersTFT-LCDOLED
By Sales ChannelOEM, AftermarketOEMAftermarket
By GeographyNorth America, Europe, Asia-Pacific, South America, Middle East & AfricaNorth AmericaAsia-Pacific


Market Segmentation Overview

By Cluster Type

Sub-SegmentKey Trend
AnalogRetained in commercial and entry platforms where display cost ceilings are absolute
HybridTransitional configuration pairing a mechanical speedometer with a compact reconfigurable panel
DigitalStandard on dedicated electric architectures; carries the highest software content per unit


Cluster type is the dimension where mix shift is most visible. Analog volume persists, but its revenue contribution declines each year as digital units carry two to three times the bill-of-materials value and add licensable software layers on top.

By Vehicle Type

Sub-SegmentKey Trend
Passenger CarsTrim-level escalation moves large digital panels from top trims into mid-grade
Light Commercial VehiclesFleet telematics visualization becomes a specification requirement
Heavy Commercial VehiclesHours-of-service and predictive maintenance alerts drive configurable displays


Passenger cars supply the volume base, but commercial vehicles are where specification is changing fastest. Fleet operators value data density over aesthetics, which favours suppliers offering ruggedised modules with deep vehicle-network integration rather than premium optical finishes.

By Propulsion Type

Sub-SegmentKey Trend
Internal CombustionLong model cycles sustain share despite declining new-platform nominations
Hybrid and Plug-in HybridDual-source energy routing requires unusually rich visualization content
Battery ElectricCharging-session, range projection, and thermal graphics lift content value


Propulsion mix determines content intensity more than any other dimension. Electric platforms specify displays that combustion vehicles simply do not need, so the propulsion transition mechanically raises average revenue per vehicle even where unit volumes stay flat.

By Display Technology

Sub-SegmentKey Trend
TFT-LCDBroad qualification depth and multi-source supply keep it the default choice
Segmented LCDSurvives at strict cost ceilings in entry and commercial applications
OLEDContrast and curved-form advantages secure premium trim placement
Others (Micro-LED, Hybrid)Early concept and halo-model deployment with limited volume


Display technology choice is governed more by qualification history and warranty risk than by specification appeal. Panel premiums and burn-in provisions still confine OLED to higher trims, while TFT-LCD holds the volume position through supply diversity.

By Sales Channel

Sub-SegmentKey Trend
OEMFactory-fit nomination dominates because of safety-critical network integration
AftermarketRetrofit and fleet refurbishment grow fastest, gated by cryptographic provisioning


Channel structure is being reshaped by security architecture. As automakers bind firmware to vehicle credentials, the aftermarket splits into an authorised segment with token access and an unauthorised segment that is progressively locked out.

By Geography

Sub-SegmentKey Trend
North AmericaHigh-content trucks and SUVs sustain the largest revenue base
EuropeRegulatory sequencing under GSR2 and R155 drives specification depth
Asia-PacificDomestic panel capacity plus EV proliferation deliver the fastest growth
South AmericaFlex-fuel platform refresh introduces colour displays to entry segments
Middle East & AfricaPremium import mix lifts value above unit share


Geographic performance separates value from volume. Asia-Pacific builds the most vehicles and grows fastest, yet North America still generates the largest revenue pool because its mix concentrates in high-content light trucks.




Download PDF ×

We do not share your information with anyone. However, we may send you emails based on your report interest from time to time. You may contact us at any time to opt-out.