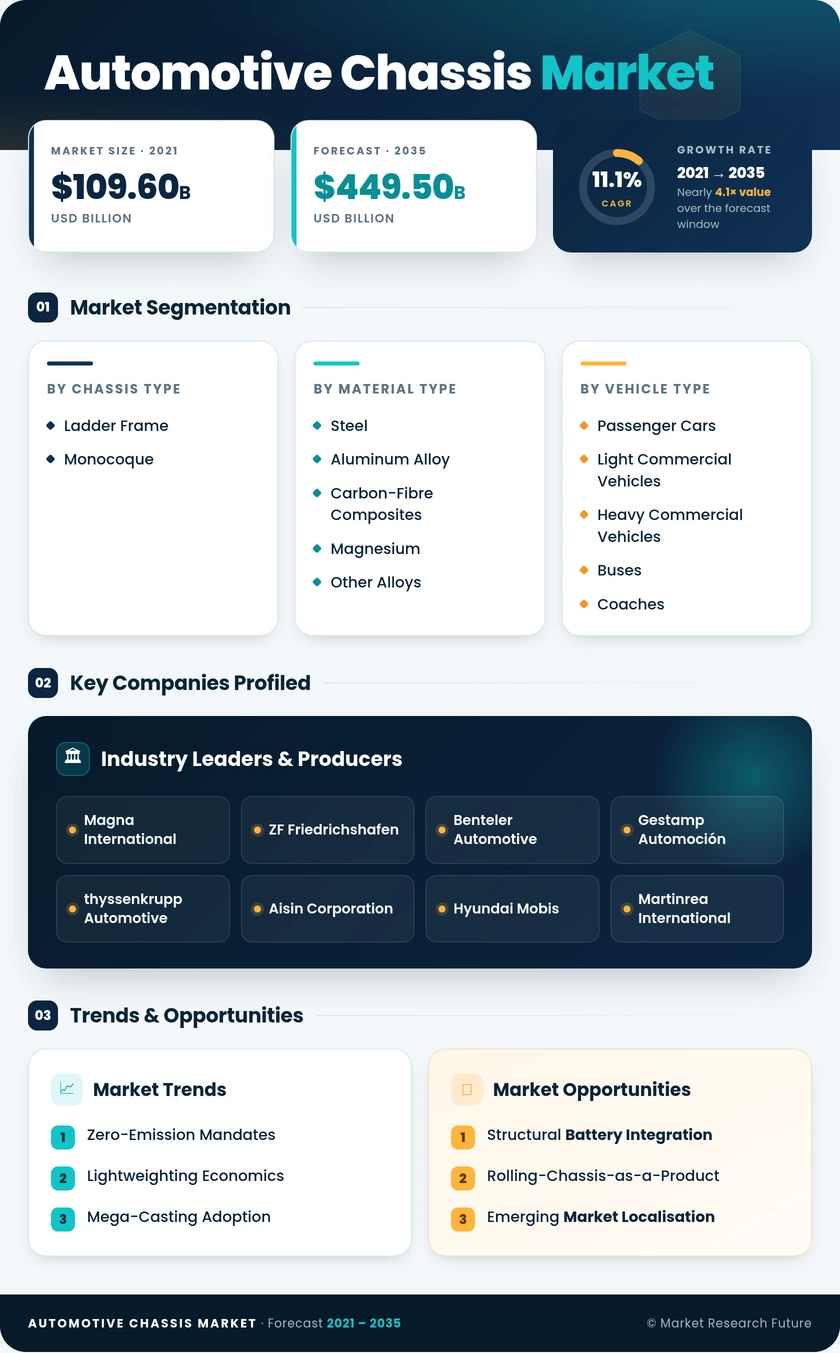
Automotive Chassis Market (2026 - 2035)

ID: MRFR/AT/3745-CR 100 Pages Triveni Bhoyar Last Updated: September 15, 2026
Automotive Chassis Market Research Report By Chassis Type (Ladder Frame, Monocoque), By Material Type (Steel, Aluminum Alloy, Carbon-Fibre Composites, Magnesium and Other Alloys), By Vehicle Type (Passenger Cars, Light Commercial Vehicles, Heavy Commercial Vehicles, Buses and Coaches), By Propulsion Type (Internal Combustion Engine, Hybrid and Plug-In Hybrid, Battery Electric, Fuel Cell Electric), By Sales Channel (OEM, Aftermarket) and By Regional (North America, Europe, South America, Asia Pacific, Middle East and Africa) - Forecast to 2035
Automotive Chassis Market
Market Size
Forecast Period2026-2035
CAGR (2026-2035)11.1%
2025 Market SizeUSD 156.9 Billion
Key Players
Magna International
ZF Friedrichshafen
Benteler Automotive
Gestamp Automoción
thyssenkrupp Automotive
Aisin Corporation
Opportunities
  • Structural Battery Integration
  • Rolling-Chassis-as-a-Product
  • Emerging Market Localisation
  1. 1 Market Overview |
    1. 1.1 Study Assumptions & Market Definition |
    2. 1.2 Scope of the Study |
    3. 1.3 Research Methodology
  2. 2 Market Summary & Key Takeaways
  3. 3 Market Dynamics |
    1. 3.1 Market Drivers Analysis | |
      1. 3.1.1 Zero-Emission Mandates & Platform Redesign | |
      2. 3.1.2 Lightweighting for Range and Fuel-Economy Compliance | |
      3. 3.1.3 Mega-Casting Adoption | |
      4. 3.1.4 Crash and Safety Standard Escalation | |
      5. 3.1.5 Last-Mile Commercial Fleet Expansion | |
      6. 3.1.6 Rolling-Chassis Contract Manufacturing |
    2. 3.2 Market Restraints Analysis | |
      1. 3.2.1 Steel and Aluminium Price Volatility | |
      2. 3.2.2 Capital Intensity of Casting Retooling | |
      3. 3.2.3 Repairability and Total-Loss Risk | |
      4. 3.2.4 Carbon-Fibre Cost and Cycle Time | |
      5. 3.2.5 Fragmented Homologation Regimes |
    3. 3.3 Market Opportunity Analysis | |
      1. 3.3.1 Structural Battery Integration | |
      2. 3.3.2 Rolling-Chassis-as-a-Product | |
      3. 3.3.3 Emerging Market Localisation | |
      4. 3.3.4 Digital Twin and Validation Services | |
      5. 3.3.5 Corrosion-Resistant Aftermarket |
    4. 3.4 Industry Value Chain Analysis |
    5. 3.5 Porter's Five Forces Analysis
  4. 4 Global Market Size & Forecast (2021–2035) |
    1. 4.1 Historical Market Size (2021–2025) |
    2. 4.2 Current & Forecast Market Size (2026–2035) |
    3. 4.3 Market Size by Revenue (USD Billion) |
    4. 4.4 Year-over-Year Growth Analysis
  5. 5 Segmentation Analysis |
    1. 5.1 By Chassis Type | |
      1. 5.1.1 Ladder Frame | |
      2. 5.1.2 Monocoque |
    2. 5.2 By Material Type | |
      1. 5.2.1 Steel | |
      2. 5.2.2 Aluminum Alloy | |
      3. 5.2.3 Carbon-Fibre Composites | |
      4. 5.2.4 Magnesium and Other Alloys |
    3. 5.3 By Vehicle Type | |
      1. 5.3.1 Passenger Cars | |
      2. 5.3.2 Light Commercial Vehicles | |
      3. 5.3.3 Heavy Commercial Vehicles | |
      4. 5.3.4 Buses and Coaches |
    4. 5.4 By Propulsion Type | |
      1. 5.4.1 Internal Combustion Engine | |
      2. 5.4.2 Hybrid and Plug-In Hybrid | |
      3. 5.4.3 Battery Electric | |
      4. 5.4.4 Fuel Cell Electric |
    5. 5.5 By Sales Channel | |
      1. 5.5.1 OEM | |
      2. 5.5.2 Aftermarket
  6. 6 Regional Analysis |
    1. 6.1 North America | |
      1. 6.1.1 United States | |
      2. 6.1.2 Canada | |
      3. 6.1.3 Mexico |
    2. 6.2 Europe | |
      1. 6.2.1 Germany | |
      2. 6.2.2 United Kingdom | |
      3. 6.2.3 France | |
      4. 6.2.4 Italy | |
      5. 6.2.5 Spain | |
      6. 6.2.6 Nordic Countries | |
      7. 6.2.7 Russia | |
      8. 6.2.8 Rest of Europe |
    3. 6.3 Asia-Pacific | |
      1. 6.3.1 China | |
      2. 6.3.2 India | |
      3. 6.3.3 Japan | |
      4. 6.3.4 South Korea | |
      5. 6.3.5 ASEAN | |
      6. 6.3.6 Rest of Asia-Pacific |
    4. 6.4 South America | |
      1. 6.4.1 Brazil | |
      2. 6.4.2 Argentina | |
      3. 6.4.3 Rest of South America |
    5. 6.5 Middle East & Africa | |
      1. 6.5.1 Saudi Arabia | |
      2. 6.5.2 United Arab Emirates | |
      3. 6.5.3 South Africa | |
      4. 6.5.4 Egypt | |
      5. 6.5.5 Rest of Middle East & Africa
  7. 7 Competitive Landscape |
    1. 7.1 Market Share Analysis (2026) |
    2. 7.2 Competitive Benchmarking Matrix |
    3. 7.3 Company Profiles | |
      1. 7.3.1 Magna International | |
      2. 7.3.2 ZF Friedrichshafen | |
      3. 7.3.3 Benteler Automotive | |
      4. 7.3.4 Gestamp Automoción | |
      5. 7.3.5 thyssenkrupp Automotive | |
      6. 7.3.6 Aisin Corporation | |
      7. 7.3.7 Hyundai Mobis | |
      8. 7.3.8 Martinrea International | |
      9. 7.3.9 Autokiniton | |
      10. 7.3.10 Dana Incorporated | |
      11. 7.3.11 F-Tech Inc. | |
      12. 7.3.12 CIE Automotive
  8. 8 Future Outlook & Strategic Recommendations (2026–2035) |
    1. 8.1 Near-Term Outlook (2026–2028) |
    2. 8.2 Medium-Term Outlook (2029–2031) |
    3. 8.3 Long-Term Outlook (2032–2035)
  9. 9 Recent Developments & News
  10. 10 Frequently Asked Questions
  11. 11 Report Scope & Methodology |
    1. 11.1 Study Period & Base Year |
    2. 11.2 Data Sources & Citations |
    3. 11.3 Abbreviations
  12. 12 LIST OF TABLES |
  13. TABLE 1 Global Automotive Chassis Market Size & Forecast, by Revenue (USD Billion), 2021–2035 |
  14. TABLE 2 Global Automotive Chassis Market — Year-over-Year Growth Analysis, 2021–2035 |
  15. TABLE 3 Driver Impact Analysis — Contribution to CAGR |
  16. TABLE 4 Restraint Impact Analysis — Drag on CAGR |
  17. TABLE 5 Global Market Size, by Chassis Type, 2021–2035 (USD Billion) |
  18. TABLE 6 Global Market Size, by Material Type, 2021–2035 (USD Billion) |
  19. TABLE 7 Global Market Size, by Vehicle Type, 2021–2035 (USD Billion) |
  20. TABLE 8 Global Market Size, by Propulsion Type, 2021–2035 (USD Billion) |
  21. TABLE 9 Global Market Size, by Sales Channel, 2021–2035 (USD Billion) |
  22. TABLE 10 Global Market Size, by Region, 2021–2035 (USD Billion) |
  23. TABLE 11 North America Market Size, by Country, 2021–2035 (USD Billion) |
  24. TABLE 12 Europe Market Size, by Country, 2021–2035 (USD Billion) |
  25. TABLE 13 Asia-Pacific Market Size, by Country, 2021–2035 (USD Billion) |
  26. TABLE 14 South America Market Size, by Country, 2021–2035 (USD Billion) |
  27. TABLE 15 Middle East & Africa Market Size, by Country, 2021–2035 (USD Billion) |
  28. TABLE 16 North America Market Size, by Chassis Type and Material Type, 2021–2035 (USD Billion) |
  29. TABLE 17 Europe Market Size, by Chassis Type and Material Type, 2021–2035 (USD Billion) |
  30. TABLE 18 Asia-Pacific Market Size, by Chassis Type and Material Type, 2021–2035 (USD Billion) |
  31. TABLE 19 South America Market Size, by Vehicle Type and Propulsion Type, 2021–2035 (USD Billion) |
  32. TABLE 20 Middle East & Africa Market Size, by Vehicle Type and Sales Channel, 2021–2035 (USD Billion) |
  33. TABLE 21 Competitive Benchmarking Matrix, 2026 |
  34. TABLE 22 Company Profiles — Key Players |
  35. TABLE 23 Recent Developments & Strategic Announcements, 2023–2025 |
  36. TABLE 24 Report Scope & Methodology Summary |
  37. TABLE 25 Detailed Sources and Citations Register
  38. 13 LIST OF FIGURES |
  39. FIGURE 1 Market Dynamics — Drivers, Restraints and Opportunities Snapshot |
  40. FIGURE 2 Industry Value Chain — Raw Material to OEM Assembly |
  41. FIGURE 3 Porter's Five Forces Analysis |
  42. FIGURE 4 Global Market Size Trend, 2021–2035 (USD Billion) |
  43. FIGURE 5 Year-over-Year Growth Trajectory, 2022–2035 |
  44. FIGURE 6 Market Share by Chassis Type, 2025 vs 2035 |
  45. FIGURE 7 Market Share by Material Type, 2025 vs 2035 |
  46. FIGURE 8 Market Share by Vehicle Type, 2025 |
  47. FIGURE 9 Market Share by Propulsion Type, 2025 vs 2035 |
  48. FIGURE 10 Market Share by Sales Channel, 2025 |
  49. FIGURE 11 Regional Market Share Distribution, 2025 |
  50. FIGURE 12 Regional CAGR Comparison, 2026–2035 |
  51. FIGURE 13 Country-Level Contribution Heat Map, 2025 |
  52. FIGURE 14 Competitive Landscape — Estimated Revenue Share Bands, 2026 |
  53. FIGURE 15 Supplier Positioning Matrix — Capability vs Geographic Reach

Segmentation Quick Reference

DimensionSub-SegmentsDominant SegmentFastest Growing Segment
By Chassis TypeLadder Frame; MonocoqueMonocoqueLadder Frame
By Material TypeSteel; Aluminum Alloy; Carbon-Fibre Composites; Magnesium and Other AlloysSteelCarbon-Fibre Composites
By Vehicle TypePassenger Cars; Light Commercial Vehicles; Heavy Commercial Vehicles; Buses and CoachesPassenger CarsLight Commercial Vehicles
By Propulsion TypeInternal Combustion Engine; Hybrid and Plug-In Hybrid; Battery Electric; Fuel Cell ElectricInternal Combustion EngineBattery Electric
By Sales ChannelOEM; AftermarketOEMAftermarket
By RegionNorth America; Europe; Asia-Pacific; South America; Middle East & AfricaAsia-PacificAsia-Pacific


Market Segmentation Overview

By Chassis Type

Sub-SegmentKey Trend
Ladder FrameElectrified body-on-frame pickups extend relevance beyond traditional commercial use
MonocoqueCasting consolidation reduces part count while raising torsional stiffness targets


Architecture choice is increasingly decided by battery packaging rather than by vehicle class convention. Monocoque retains the value majority, but frame platforms are no longer the declining category the industry assumed a decade ago.

By Material Type

Sub-SegmentKey Trend
SteelAdvanced high-strength grades defend share against substitution
Aluminum AlloyCasting suitability drives adoption into mainstream volume platforms
Carbon-Fibre CompositesCycle-time constraints keep penetration confined to premium applications
Magnesium and Other AlloysTargeted use in localised stiffness and bracket applications


Material mix is the single largest determinant of content value per vehicle. Aluminium's advance is genuine but slower than 2020-era projections, because steel metallurgy has not stood still.

By Vehicle Type

Sub-SegmentKey Trend
Passenger CarsPlatform consolidation raises volume per architecture
Light Commercial VehiclesE-commerce delivery demand sustains above-average growth
Heavy Commercial VehiclesEmissions regulation drives frame redesign for alternative powertrains
Buses and CoachesTransit electrification programmes concentrate demand in urban fleets


Passenger cars carry the volume, but commercial vehicles carry the higher structural content per unit — a mix effect that flatters value growth relative to unit growth.

By Propulsion Type

Sub-SegmentKey Trend
Internal Combustion EngineInstalled base sustains share while new platform investment slows
Hybrid and Plug-In HybridAdapted architectures bridge the transition without full redesign
Battery ElectricPurpose-built structures deliver the highest content value per vehicle
Fuel Cell ElectricHeavy-duty pilots define early requirements for tank-integrated frames


Propulsion is now the primary architectural input. A battery-electric platform carries measurably more structural value than the combustion vehicle it replaces, which is why value growth outpaces unit growth across the forecast.

By Sales Channel

Sub-SegmentKey Trend
OEMMulti-year platform awards concentrate volume with fewer suppliers
AftermarketAgeing parc and corrosion replacement sustain above-market growth


OEM remains overwhelmingly dominant, though the aftermarket's growth rate and margin profile make it disproportionately attractive relative to its share.




Download PDF ×

We do not share your information with anyone. However, we may send you emails based on your report interest from time to time. You may contact us at any time to opt-out.