Segmentation Quick Reference
| Dimension | Sub-Segments | Dominant Segment | Fastest Growing Segment |
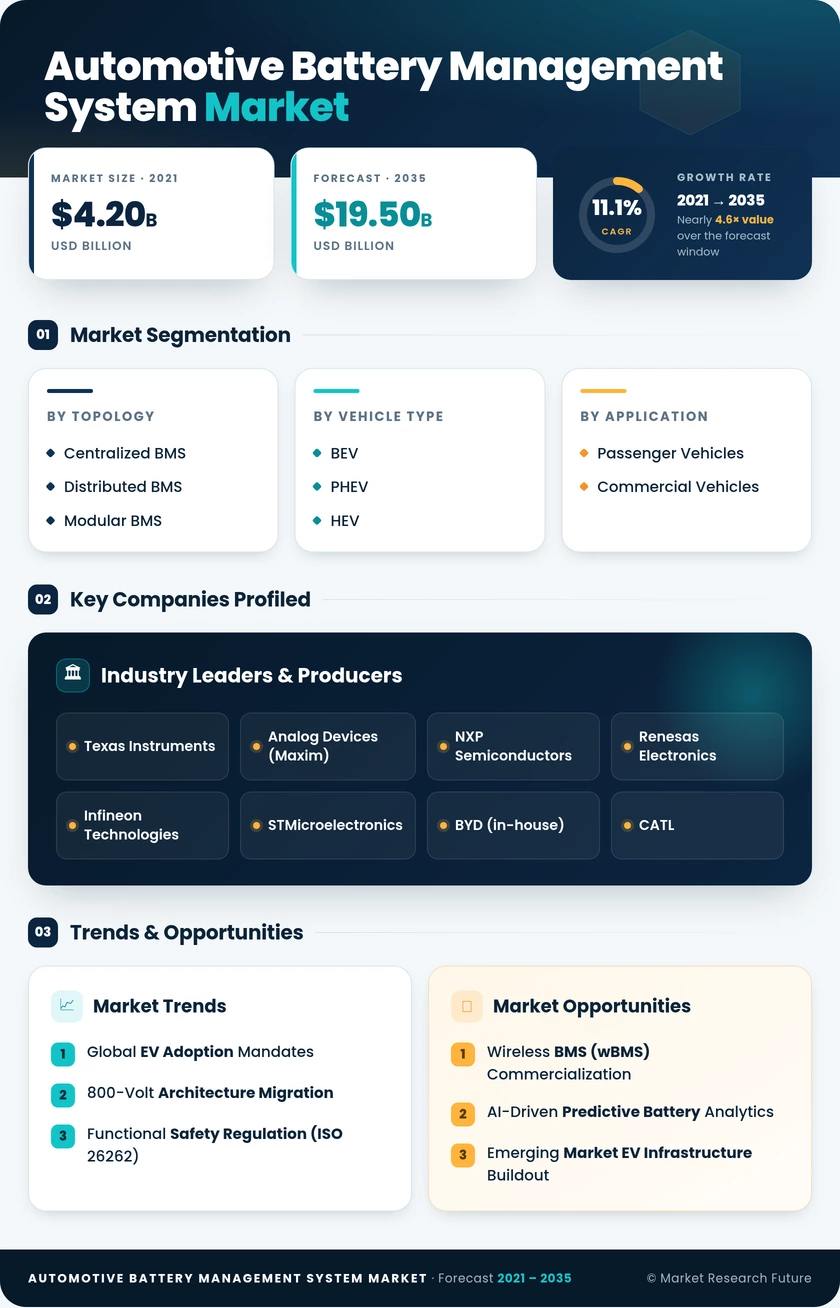
| By Topology | Centralized BMS, Distributed BMS, Modular BMS | Centralized BMS (48% share) | Distributed BMS (13.6% CAGR) |
| By Vehicle Type | BEV, PHEV, HEV | BEV (67% share) | PHEV (9.8% CAGR) |
| By Application | Passenger Vehicles, Commercial Vehicles | Passenger Vehicles (82% share) | Commercial Vehicles (14.8% CAGR) |
| By Component | Hardware, Software | Hardware (~62% share) | Software (~13.2% CAGR) |
Market Segmentation Overview
By Topology
| Sub-Segment | Key Trend |
| Centralized BMS | Cost-optimized single-controller architectures dominating sub-400V passenger EV platforms |
| Distributed BMS | Cell-level supervisory ICs enabling scalable 800V pack designs with modular fault isolation |
| Modular BMS | Configurable hardware blocks gaining traction in heavy-duty commercial and bus applications |
Centralized BMS remains dominant by volume due to its lower bill-of-materials cost, but the migration toward high-voltage platforms is eroding its addressable market above 100 kWh pack capacities. Distributed architectures are becoming the default specification for premium EV platforms from 2026 onward.
By Vehicle Type
| Sub-Segment | Key Trend |
| Battery Electric Vehicles (BEV) | Largest packs (60–120 kWh) driving highest per-unit BMS content value |
| Plug-in Hybrid Electric Vehicles (PHEV) | Dual-powertrain complexity requiring specialized thermal and SOC cycling algorithms |
| Hybrid Electric Vehicles (HEV) | 48V mild-hybrid proliferation in mass-market ICE vehicles expanding volume at lower ASPs |
BEVs account for two-thirds of BMS demand by value, driven by pack sizes three to five times larger than HEV packs. The PHEV segment, while smaller, presents outsized software complexity that sustains premium BMS pricing.
By Application
| Sub-Segment | Key Trend |
| Passenger Vehicles | Consumer EV adoption mandates driving consistent volume growth across all price tiers |
| Commercial Vehicles | Fleet electrification mandates and total-cost-of-ownership models accelerating BMS procurement cycles |
Passenger vehicles dominate unit volumes, but commercial vehicle BMS demand is growing nearly 50% faster in CAGR terms. Electric bus and last-mile delivery fleets require ruggedized BMS hardware with extended operational temperature ranges and enhanced diagnostic depth.
By Component
| Sub-Segment | Key Trend |
| Hardware | Analog front-end ICs, microcontrollers, current/temperature sensors forming the physical monitoring layer |
| Software | SOC/SOH algorithms, diagnostic firmware, and cloud-connected analytics platforms growing as a share of total BMS value |
Hardware still accounts for the majority of BMS revenue, but the software share is rising rapidly as OEMs increasingly treat BMS intelligence — predictive analytics, over-the-air calibration, and digital passport compliance — as a differentiating competitive layer.