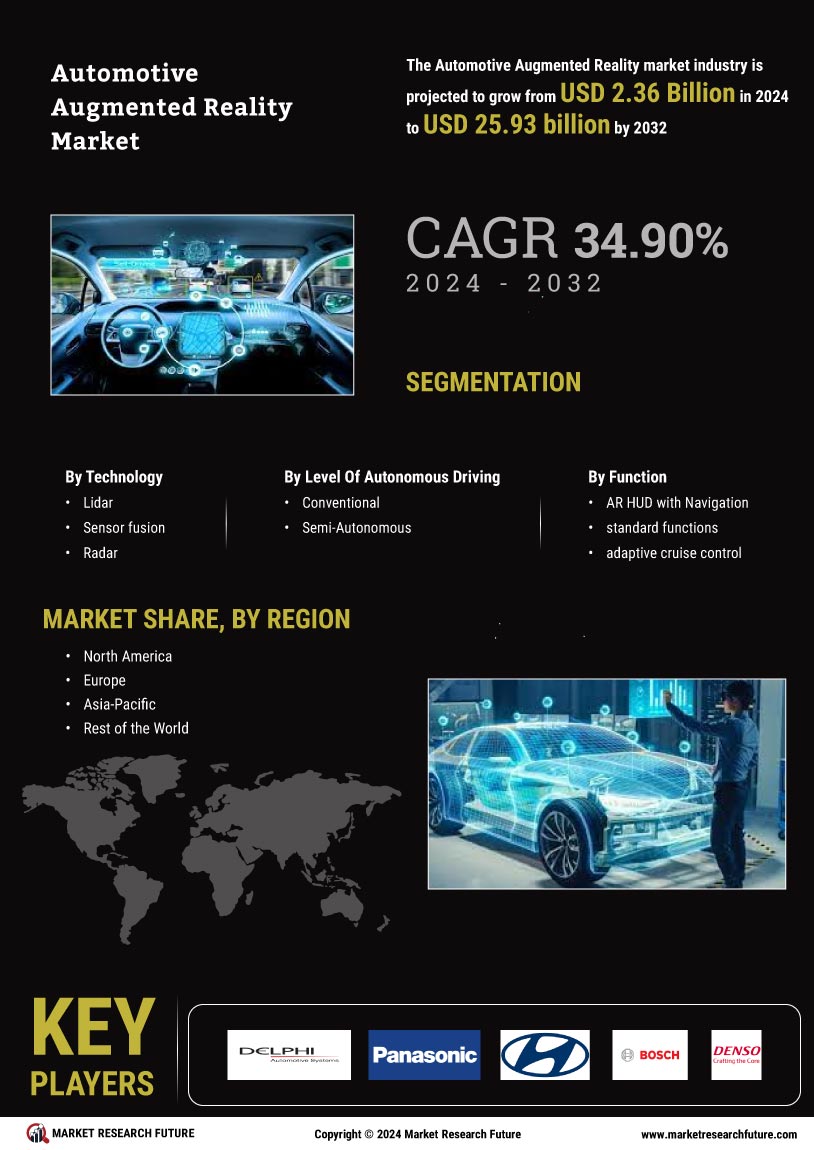
ID: MRFR/AM/5681-HCR | 100 Pages | Author: Sejal Akre | March 2024
Table of Contents
1. Executive Summary
2. Scope of the Report
2.1. Market Definition
2.2. Scope of the Study
2.2.1. Definition
2.2.2. Research Objective
2.2.3. Assumptions
2.2.4. Limitations
2.3. Research Process
2.3.1. Primary Research
2.3.2. Secondary Research
2.4. Market size Estimation
2.5. Forecast Model
3. Market Landscape
3.1. Porter’s Five Forces Analysis
3.1.1. Threat of New Entrants
3.1.2. Bargaining power of buyers
3.1.3. Threat of substitutes
3.1.4. Segment rivalry
3.1.5. Bargaining Power of Buyers
3.2. Value Chain/Supply Chain Analysis
4. Market Dynamics
4.1. Introduction
4.2. Market Drivers
4.3. Market Restraints
4.4. Market Opportunities
4.5. Market Trends
5. Global Automotive Augmented Reality Market, By Sensor Technology
5.1. Introduction
5.2. LIDAR
5.2.1. Market Estimates & Forecast, 2022-2030
5.2.2. Market Estimates & Forecast by Region, 2022-2030
5.3. Sensor Fusion
5.3.1. Market Estimates & Forecast, 2022-2030
5.3.2. Market Estimates & Forecast by Region, 2022-2030
5.4. Radar
5.4.1. Market Estimates & Forecast,2022-2030
5.4.2. Market Estimates & Forecast by Region,2022-2030
5.5. CCD/VMOS Image Source
5.5.1. Market Estimates & Forecast, 2022-2030
5.5.2. Market Estimates & Forecast by Region, 2022-2030
6. Global Automotive Augmented Reality Market, By Level of Autonomous Driving
6.1. Introduction
6.2. Conventional Driving
6.2.1. Market Estimates & Forecast,2022-2030
6.2.2. Market Estimates & Forecast by Region,2022-2030
6.3. Semi-Autonomous Driving
6.3.1. Market Estimates & Forecast,2022-2030
6.3.2. Market Estimates & Forecast by Region,2022-2030
7. Global Automotive Augmented Reality Market, By Functions
7.1. Introduction
7.2. AR HUD with Navigation
7.2.1. Market Estimates & Forecast,2022-2030
7.2.2. Market Estimates & Forecast by Region,2022-2030
7.3. AR HUD with standard functions
7.3.1. Market Estimates & Forecast,2022-2030
7.3.2. Market Estimates & Forecast by Region,2022-2030
7.4. AR HUD with adaptive cruise control
7.4.1. Market Estimates & Forecast,2022-2030
7.4.2. Market Estimates & Forecast by Region,2022-2030
7.5. AR HUD with Lane Departure Warning
7.5.1. Market Estimates & Forecast,2022-2030
7.5.2. Market Estimates & Forecast by Region,2022-2030
7.6. Advanced AR HUD
7.6.1. Market Estimates & Forecast,2022-2030
7.6.2. Market Estimates & Forecast by Region,2022-2030
8. Global Automotive Augmented Reality Market, By Region
8.1. Introduction
8.2. North America
8.2.1. Market Estimates & Forecast,2022-2030
8.2.2. Market Estimates & Forecast by Sensor Technology,2022-2030
8.2.3. Market Estimates & Forecast By Level of Autonomous Driving,2022-2030
8.2.4. Market Estimates & Forecast By Functions,2022-2030
8.2.5. U.S.
8.2.5.1. Market Estimates & Forecast,2022-2030
8.2.5.2. Market Estimates & Forecast by Sensor Technology,2022-2030
8.2.5.3. Market Estimates & Forecast By Level of Autonomous Driving,2022-2030
8.2.5.4. Market Estimates & Forecast By Functions,2022-2030
8.2.6. Canada
8.2.6.1. Market Estimates & Forecast,2022-2030
8.2.6.2. Market Estimates & Forecast by Sensor Technology,2022-2030
8.2.6.3. Market Estimates & Forecast By Level of Autonomous Driving,2022-2030
8.2.6.4. Market Estimates & Forecast By Functions,2022-2030
8.3. Europe
8.3.1. Market Estimates & Forecast,2022-2030
8.3.2. Market Estimates & Forecast by Sensor Technology,2022-2030
8.3.3. Market Estimates & Forecast By Level of Autonomous Driving,2022-2030
8.3.4. Market Estimates & Forecast By Functions,2022-2030
8.3.5. U.K.
8.3.5.1. Market Estimates & Forecast,2022-2030
8.3.5.2. Market Estimates & Forecast by Sensor Technology,2022-2030
8.3.5.3. Market Estimates & Forecast By Level of Autonomous Driving,2022-2030
8.3.5.4. Market Estimates & Forecast By Functions,2022-2030
8.3.6. Germany
8.3.6.1. Market Estimates & Forecast,2022-2030
8.3.6.2. Market Estimates & Forecast by Sensor Technology,2022-2030
8.3.6.3. Market Estimates & Forecast by Level of Autonomous Driving,2022-2030
8.3.6.4. Market Estimates & Forecast By Functions,2022-2030
8.3.7. France
8.3.7.1. Market Estimates & Forecast,2022-2030
8.3.7.2. Market Estimates & Forecast by Sensor Technology,2022-2030
8.3.7.3. Market Estimates & Forecast By Level of Autonomous Driving,2022-2030
8.3.7.4. Market Estimates & Forecast By Functions,2022-2030
8.3.8. Italy
8.3.8.1. Market Estimates & Forecast,2022-2030
8.3.8.2. Market Estimates & Forecast by Sensor Technology,2022-2030
8.3.8.3. Market Estimates & Forecast By Level of Autonomous Driving,2022-2030
8.3.8.4. Market Estimates & Forecast By Functions,2022-2030
8.3.9. Rest of Europe
8.3.9.1. Market Estimates & Forecast,2022-2030
8.3.9.2. Market Estimates & Forecast by Sensor Technology,2022-2030
8.3.9.3. Market Estimates & Forecast By Level of Autonomous Driving,2022-2030
8.3.9.4. Market Estimates & Forecast By Functions,2022-2030
8.4. Asia-Pacific
8.4.1. Market Estimates & Forecast,2022-2030
8.4.2. Market Estimates & Forecast by Sensor Technology,2022-2030
8.4.3. Market Estimates & Forecast By Level of Autonomous Driving,2022-2030
8.4.4. Market Estimates & Forecast By Functions,2022-2030
8.4.5. China
8.4.5.1. Market Estimates & Forecast,2022-2030
8.4.5.2. Market Estimates & Forecast by Sensor Technology,2022-2030
8.4.5.3. Market Estimates & Forecast By Level of Autonomous Driving,2022-2030
8.4.5.4. Market Estimates & Forecast By Functions,2022-2030
8.4.6. Japan
8.4.6.1. Market Estimates & Forecast,2022-2030
8.4.6.2. Market Estimates & Forecast by Sensor Technology,2022-2030
8.4.6.3. Market Estimates & Forecast By Level of Autonomous Driving,2022-2030
8.4.6.4. Market Estimates & Forecast By Functions,2022-2030
8.4.7. India
8.4.7.1. Market Estimates & Forecast,2022-2030
8.4.7.2. Market Estimates & Forecast by Sensor Technology,2022-2030
8.4.7.3. Market Estimates & Forecast By Level of Autonomous Driving,2022-2030
8.4.7.4. Market Estimates & Forecast By Functions2022-2030
8.4.8. Rest of Asia-Pacific
8.4.8.1. Market Estimates & Forecast,2022-2030
8.4.8.2. Market Estimates & Forecast by Sensor Technology,2022-2030
8.4.8.3. Market Estimates & Forecast By Level of Autonomous Driving,2022-2030
8.4.8.4. Market Estimates & Forecast By Functions,2022-2030
8.5. Rest of the World
8.5.1. Market Estimates & Forecast,2022-2030
8.5.2. Market Estimates & Forecast by Sensor Technology,2022-2030
8.5.3. Market Estimates & Forecast By Level of Autonomous Driving,2022-2030
8.5.4. Market Estimates & Forecast By Functions,2022-2030
9. Competitive Landscape
10. Company Profile
10.1. DelphiAutomotive(Dublin)
10.1.1. Company Overview
10.1.2. Products/Services Offering
10.1.3. Financial Overview
10.1.4. Key Developments
10.1.5. Strategy
10.1.6. SWOT Analysis
10.2. Panasonic(Japan),
10.2.1. Company Overview
10.2.2. Products/Services Offering
10.2.3. Financial Overview
10.2.4. Key Developments
10.2.5. Strategy
10.3. SWOT Analysis
10.4. HyundaiMotor(south korea)
10.4.1. Company Overview
10.4.2. Products/Services Offering
10.4.3. Financial Overview
10.4.4. Key Developments
10.4.5. Strategy
10.4.6. SWOT Analysis
10.5. BMW(Germany),
10.5.1. Company Overview
10.5.2. Products/Services Offering
10.5.3. Financial Overview
10.5.4. Key Developments
10.5.5. Strategy
10.5.6. SWOT Analysis
10.6. Alphabet (US),
10.6.1. Company Overview
10.6.2. Products/Services Offering
10.6.3. Financial Overview
10.6.4. Key Developments
10.6.5. Strategy
10.6.6. SWOT Analysis
10.7. RobertBosch GmbH (Germany),
10.7.1. Company Overview
10.7.2. Products/Services Offering
10.7.3. Financial Overview
10.7.4. Key Developments
10.7.5. Strategy
10.7.6. SWOT Analysis
10.8. Denso(US) ,
10.8.1. Company Overview
10.8.2. Products/Services Offering
10.8.3. Financial Overview
10.8.4. Key Developments
10.8.5. Strategy
10.8.6. SWOT Analysis
10.9. Garmin International(US)
10.9.1. Company Overview
10.9.2. Products/Services Offering
10.9.3. Financial Overview
10.9.4. Key Developments
10.9.5. Strategy
10.9.6. SWOT Analysis
10.10. ContinentalAG(Germany)
10.10.1. Company Overview
10.10.2. Products/Services Offering
10.10.3. Financial Overview
10.10.4. Key Developments
10.10.5. Strategy
10.10.6. SWOT Analysis
List of Tables
Table 1 Global Automotive Augmented Reality Market: By Region,2022-2030
Table 2 North America: Automotive Augmented Reality Market: By Country,2022-2030
Table 3 Europe Automotive Augmented Reality Market: By Country,2022-2030
Table 4 Asia-Pacific Automotive Augmented Reality Market: By Country,2022-2030
Table 5 RoW Automotive Augmented Reality Market: By Country,2022-2030
Table 6 Global Automotive Augmented Reality Market, By Sensor Technology, By Regions,2022-2030
Table 7 North America: Automotive Augmented Reality Market, By Sensor Technology, By Country,2022-2030
Table 8 Europe Automotive Augmented Reality Market, By Sensor Technology, By Country,2022-2030
Table 9 Asia-Pacific Automotive Augmented Reality Market by Sensor Technology, By Country,2022-2030
Table 10 RoW Automotive Augmented Reality Market by Sensor Technology, By Country,2022-2030
Table 11 Global Automotive Augmented Reality By Level of Autonomous Driving Market: By Regions,2022-2030
Table 12 North America: Automotive Augmented Reality Market By Level of Autonomous Driving: By Country,2022-2030
Table 13 Europe Automotive Augmented Reality Market By Level of Autonomous Driving: By Country,2022-2030
Table 14 Asia-Pacific Automotive Augmented Reality Market By Level of Autonomous Driving: By Country,2022-2030
Table 15 RoW Automotive Augmented Reality Market By Level of Autonomous Driving: By
Country,2022-2030
Table 16 Global Automotive Augmented Reality By Functions Market: By Regions,2022-2030
Table 17 North America: Automotive Augmented Reality Market By Functions: By Country, 2020-
2027
Table 18 Europe Automotive Augmented Reality Market By Functions: By Country,2022-2030
Table 19 Asia-Pacific Automotive Augmented Reality Market By Functions: By Country,2022-2030
Table 20 RoW Automotive Augmented Reality Market By Functions: By Country,2022-2030
Table 21 Global Automotive Augmented Reality by Vehicle Type Market: By Regions,2022-2030
Table 22 North America: Automotive Augmented Reality Market by Vehicle Type: By Country,
2022-2030
Table 23 Europe Automotive Augmented Reality Market by Vehicle Type: By Country,2022-2030
Table 24 Asia-Pacific Automotive Augmented Reality Market by Vehicle Type: By Country, 2020-
2027
Table 25 RoW Automotive Augmented Reality Market by Vehicle Type: By Country,2022-2030
Table 26 Global Automotive Augmented Reality Market: By Region,2022-2030
Table 27 Global Automotive Augmented Reality Market: By Sensor Technology,2022-2030
Table 18 Global Automotive Augmented Reality Market: By Level of Autonomous Driving, 2020-
2027
Table 27 Global Automotive Augmented Reality Market: By Functions,2022-2030
Table 18 Global Automotive Augmented Reality Market: By Vehicle Type,2022-2030
Table 19 North America: Automotive Augmented Reality Market, By Country
Table 20 North America: Automotive Augmented Reality Market, By Sensor Technology
Table 21 North America: Automotive Augmented Reality Market, By Level of Autonomous Driving
Table 20 North America: Automotive Augmented Reality Market, By Functions
Table 21 North America: Automotive Augmented Reality Market, By Vehicle Type
Table 22 Europe: Automotive Augmented Reality Market, By Country
Table 23 Europe: Automotive Augmented Reality Market, By Sensor Technology
Table 24 Europe: Automotive Augmented Reality Market, By Level of Autonomous Driving
Table 25 Europe: Automotive Augmented Reality Market, By Functions
Table 26 Europe: Automotive Augmented Reality Market, By Vehicle Type
Table 27 Asia-Pacific: Automotive Augmented Reality Market, By Country
Table 28 Asia-Pacific: Automotive Augmented Reality Market, By Sensor Technology
Table 29 Asia-Pacific: Automotive Augmented Reality Market, By Level of Autonomous Driving
Table 30 Asia-Pacific: Automotive Augmented Reality Market, By Functions
Table 31 Asia-Pacific: Automotive Augmented Reality Market, By Vehicle Type
Table 32 RoW: Automotive Augmented Reality Market, By Region
Table 33 RoW Automotive Augmented Reality Market, By Sensor Technology
Table 34 RoW Automotive Augmented Reality Market, By Level of Autonomous Driving
Table 35 RoW Automotive Augmented Reality Market, By Functions
Table 36 RoW Automotive Augmented Reality Market, By Vehicle Type
List of Figures
FIGURE 1 Research Process of MRFR
FIGURE 2 Top-down & Bottom-up Approach
FIGURE 3 Market Dynamics
FIGURE 4 impact analysis: market drivers
FIGURE 5 impact analysis: market restraints
FIGURE 6 Porter's five forces analysis
FIGURE 7 Value chain analysis
FIGURE 8 Global Automotive Augmented Reality Market Share, By Sensor Technology, 2020 (%)
FIGURE 9 Global Automotive Augmented Reality Market, By Sensor Technology,2022-2030(USD
MILLION)
FIGURE 10 Global Automotive Augmented Reality Market Share, By Level of Autonomous Driving,
2020 (%)
FIGURE 11 Global Automotive Augmented Reality Market, By Level of Autonomous Driving, 2020-
2027 (USD MILLION)
FIGURE 12 Global Automotive Augmented Reality Market Share, By Functions, 2020 (%)
FIGURE 13 Global Automotive Augmented Reality Market, By Functions,2022-2030(USD MILLION)
FIGURE 14 Global Automotive Augmented Reality Market Share, By Vehicle Type, 2020 (%)
FIGURE 15 Global Automotive Augmented Reality Market, By Vehicle Type,2022-2030(USD
MILLION
FIGURE 16 Global Automotive Augmented Reality Market Share (%), BY REGION, 2020
FIGURE 17 Global Automotive Augmented Reality Market, BY REGION,2022-2030(USD MILLION)
FIGURE 18 North America: Automotive Augmented Reality Market SHARE (%), 2020
FIGURE 19 North America: Automotive Augmented Reality Market BY Country,2022-2030(USD MILLION)
FIGURE 20 Europe Automotive Augmented Reality Market SHARE (%), 2020
FIGURE 21 Europe Automotive Augmented Reality Market BY Country,2022-2030(USD MILLION)
FIGURE 22 Asia-Pacific Automotive Augmented Reality Market SHARE (%), 2020
FIGURE 23 Asia-Pacific Automotive Augmented Reality Market BY Country,2022-2030(USD MILLION)
FIGURE 24 Rest of the World Automotive Augmented Reality Market SHARE (%), 2020
FIGURE 25 Rest of the World Automotive Augmented Reality Market BY Country,2022-2030(USD
MILLION)
Market Segmentation
Automotive Augmented Reality Sensor technology Outlook (USD Billion, 2018-2032)
Lidar
Sensor fusion
Radar
CCD
Automotive Augmented Reality Level of Autonomous Driving Outlook (USD Billion, 2018-2032)
Conventional
Semi-Autonomous
Automotive Augmented Reality Function Outlook (USD Billion, 2018-2032)
AR HUD with Navigation
Standard functions
Adaptive cruise control
Automotive Augmented Reality Regional Outlook (USD Billion, 2018-2032)
North America Outlook (USD Billion, 2018-2032)
North America Automotive Augmented Reality by Sensor technology
Lidar
Sensor fusion
Radar
CCD
North America Automotive Augmented Reality by Level of autonomous driving
Conventional
Semi-Autonomous
North America Automotive Augmented Reality by Function
AR HUD with Navigation
Standard functions
Adaptive cruise control
US Outlook (USD Billion, 2018-2032)
US Automotive Augmented Reality by Sensor technology
Lidar
Sensor fusion
Radar
CCD
US Automotive Augmented Reality by Level of autonomous driving
Conventional
Semi-Autonomous
US Automotive Augmented Reality by Function
AR HUD with Navigation
Standard functions
Adaptive cruise control
CANADA Outlook (USD Billion, 2018-2032)
CANADA Automotive Augmented Reality by Sensor technology
Lidar
Sensor fusion
Radar
CCD
CANADA Automotive Augmented Reality by Level of autonomous driving
Conventional
Semi-Autonomous
CANADA Automotive Augmented Reality by Function
AR HUD with Navigation
Standard functions
Adaptive cruise control
Europe Outlook (USD Billion, 2018-2032)
Europe Automotive Augmented Reality by Sensor technology
Lidar
Sensor fusion
Radar
CCD
Europe Automotive Augmented Reality by Level of autonomous driving
Conventional
Semi-Autonomous
Europe Automotive Augmented Reality by Function
AR HUD with Navigation
Standard functions
Adaptive cruise control
Germany Outlook (USD Billion, 2018-2032)
Germany Automotive Augmented Reality by Sensor technology
Lidar
Sensor fusion
Radar
CCD
Germany Automotive Augmented Reality by Level of autonomous driving
Conventional
Semi-Autonomous
Germany Automotive Augmented Reality by Function
AR HUD with Navigation
Standard functions
Adaptive cruise control
France Outlook (USD Billion, 2018-2032)
France Automotive Augmented Reality by Sensor technology
Lidar
Sensor fusion
Radar
CCD
France Automotive Augmented Reality by Level of autonomous driving
Conventional
Semi-Autonomous
France Automotive Augmented Reality by Function
AR HUD with Navigation
Standard functions
Adaptive cruise control
UK Outlook (USD Billion, 2018-2032)
UK Automotive Augmented Reality by Sensor technology
Lidar
Sensor fusion
Radar
CCD
UK Automotive Augmented Reality by Level of autonomous driving
Conventional
Semi-Autonomous
UK Automotive Augmented Reality by Function
AR HUD with Navigation
Standard functions
Adaptive cruise control
ITALY Outlook (USD Billion, 2018-2032)
ITALY Automotive Augmented Reality by Sensor technology
Lidar
Sensor fusion
Radar
CCD
ITALY Automotive Augmented Reality by Level of autonomous driving
Conventional
Semi-Autonomous
ITALY Automotive Augmented Reality by Function
AR HUD with Navigation
Standard functions
Adaptive cruise control
SPAIN Outlook (USD Billion, 2018-2032)
Spain Automotive Augmented Reality by Sensor technology
Lidar
Sensor fusion
Radar
CCD
Spain Automotive Augmented Reality by Level of autonomous driving
Conventional
Semi-Autonomous
Spain Automotive Augmented Reality by Function
AR HUD with Navigation
Standard functions
Adaptive cruise control
Rest Of Europe Outlook (USD Billion, 2018-2032)
Rest Of Europe Automotive Augmented Reality by Sensor technology
Lidar
Sensor fusion
Radar
CCD
REST OF EUROPE Automotive Augmented Reality by Level of autonomous driving
Conventional
Semi-Autonomous
Rest Of Europe Automotive Augmented Reality by Function
AR HUD with Navigation
Standard functions
Adaptive cruise control
Asia-Pacific Outlook (USD Billion, 2018-2032)
Asia-Pacific Automotive Augmented Reality by Sensor technology
Lidar
Sensor fusion
Radar
CCD
Asia-Pacific Automotive Augmented Reality by Level of autonomous driving
Conventional
Semi-Autonomous
Asia-Pacific Automotive Augmented Reality by Function
AR HUD with Navigation
Standard functions
Adaptive cruise control
China Outlook (USD Billion, 2018-2032)
China Automotive Augmented Reality by Sensor technology
Lidar
Sensor fusion
Radar
CCD
China Automotive Augmented Reality by Level of autonomous driving
Conventional
Semi-Autonomous
China Automotive Augmented Reality by Function
AR HUD with Navigation
Standard functions
Adaptive cruise control
Japan Outlook (USD Billion, 2018-2032)
Japan Automotive Augmented Reality by Sensor technology
Lidar
Sensor fusion
Radar
CCD
Japan Automotive Augmented Reality by Level of autonomous driving
Conventional
Semi-Autonomous
Japan Automotive Augmented Reality by Function
AR HUD with Navigation
Standard functions
Adaptive cruise control
India Outlook (USD Billion, 2018-2032)
India Automotive Augmented Reality by Sensor technology
Lidar
Sensor fusion
Radar
CCD
India Automotive Augmented Reality by Level of autonomous driving
Conventional
Semi-Autonomous
India Automotive Augmented Reality by Function
AR HUD with Navigation
Standard functions
Adaptive cruise control
Australia Outlook (USD Billion, 2018-2032)
Australia Automotive Augmented Reality by Sensor technology
Lidar
Sensor fusion
Radar
CCD
Australia Automotive Augmented Reality by Level of autonomous driving
Conventional
Semi-Autonomous
Australia Automotive Augmented Reality by Function
AR HUD with Navigation
Standard functions
Adaptive cruise control
Rest of Asia-Pacific Outlook (USD Billion, 2018-2032)
Rest of Asia-Pacific Automotive Augmented Reality by Sensor technology
Lidar
Sensor fusion
Radar
CCD
Rest of Asia-Pacific Automotive Augmented Reality by Level of autonomous driving
Conventional
Semi-Autonomous
Rest of Asia-Pacific Automotive Augmented Reality by Function
AR HUD with Navigation
Standard functions
Adaptive cruise control
Rest of the World Outlook (USD Billion, 2018-2032)
Rest of the World Automotive Augmented Reality by Sensor technology
Lidar
Sensor fusion
Radar
CCD
Rest of the World Automotive Augmented Reality by Level of autonomous driving
Conventional
Semi-Autonomous
Rest of the World Automotive Augmented Reality by Function
AR HUD with Navigation
Standard functions
Adaptive cruise control
Middle East Outlook (USD Billion, 2018-2032)
Middle East Automotive Augmented Reality by Sensor technology
Lidar
Sensor fusion
Radar
CCD
Middle East Automotive Augmented Reality by Level of autonomous driving
Conventional
Semi-Autonomous
Middle East Automotive Augmented Reality by Function
AR HUD with Navigation
Standard functions
Adaptive cruise control
Africa Outlook (USD Billion, 2018-2032)
Africa Automotive Augmented Reality by Sensor technology
Lidar
Sensor fusion
Radar
CCD
Africa Automotive Augmented Reality by Level of autonomous driving
Conventional
Semi-Autonomous
Africa Automotive Augmented Reality by Function
AR HUD with Navigation
Standard functions
Adaptive cruise control
Latin America Outlook (USD Billion, 2018-2032)
Latin America Automotive Augmented Reality by Sensor technology
Lidar
Sensor fusion
Radar
CCD
Latin America Automotive Augmented Reality by Level of autonomous driving
Conventional
Semi-Autonomous
Latin America Automotive Augmented Reality by Function
Â
Research Methodology on Automotive Augmented Reality Market
Introduction
Market Research Future (MRFR) is a comprehensive research organization which harnesses the power of data and information to understand customer insights and design strategies for success. Automotive augmented reality is a rapidly emerging technology which uses computer enhancement of real-world environments for enhanced user experience. To create a comprehensive report on automotive augmented reality, it is important to understand the technology, the key market players, and the current market and industry trends in order to make appropriate predictions for the future. MRFR's research methodology involves the collection and analysis of primary and secondary data from credible sources. The following document will cover the research methodology used to create the comprehensive report on Automotive Augmented Reality Market.
Primary Data
Primary data is the data that is collected at the source or generated by the researcher. The primary data can be collected through various methods among which the most commonly used are surveys, interviews, and experiments. In order to create a comprehensive report on Automotive Augmented Reality Market, MRFR conducts surveys and interviews of market players and industry experts. The survey includes questions related to current market trends and user preferences, market opportunities and challenges, technological developments and advancements in the field, future market scope and potential, and various other topics related to the Automotive Augmented Reality Market. The interviews are conducted with the key market players and industry experts to gain their perspective on the market landscape and their views on the current trends and upcoming opportunities in the market.
Secondary Data
Secondary data is the data that is already available from the sources such as books, journals, reports, etc. In order to create an accurate and comprehensive report on Automotive Augmented Reality Market, MRFR collects secondary data from sources such as product catalogues, published reports, whitepapers, historical data, etc. In addition to this, MRFR also collects secondary data from industry databases such as NASSCOM, INCs, DEL indexes, IDC, Forrester, Gartner, etc. These industry databases provide data related to technological advancements, customer insights, market trends, current and upcoming opportunities, etc.
Market Analysis
In order to analyze the market and create insights, various analytical tools such as SWOT analysis, Porter's Five Forces Model, and PESTLE analysis are used. SWOT analysis provides insights into the strengths, weaknesses, opportunities, and threats of the market. These insights help in understanding the current market landscape and provide valuable information for decision-making. Porter's Five Forces Model provides insights into the competitive landscape of the market. PESTLE analysis provides information related to the political, economic, social, technological, legal, and environmental factors that are affecting the market. These analytical tools help in understanding the market dynamics and trends which help predict the future of the Automotive Augmented Reality Market.
Conclusion
Market Research Future (MRFR) is a comprehensive research organization which harnesses the power of data and information to understand customer insights and design strategies for success. In order to create a comprehensive report on automotive augmented reality, MRFR adopts a comprehensive research methodology which involves the collection and analysis of primary and secondary data from credible sources. The primary data is collected through surveys and interviews, while the secondary data is collected from product catalogues, industry databases, published reports, and other sources. In addition to this, MRFR also uses analytical tools such as SWOT analysis, Porter's Five Forces Model, and PESTLE analysis to understand the market dynamics and trends which helps in making predictions for the future of the Automotive Augmented Reality Market.