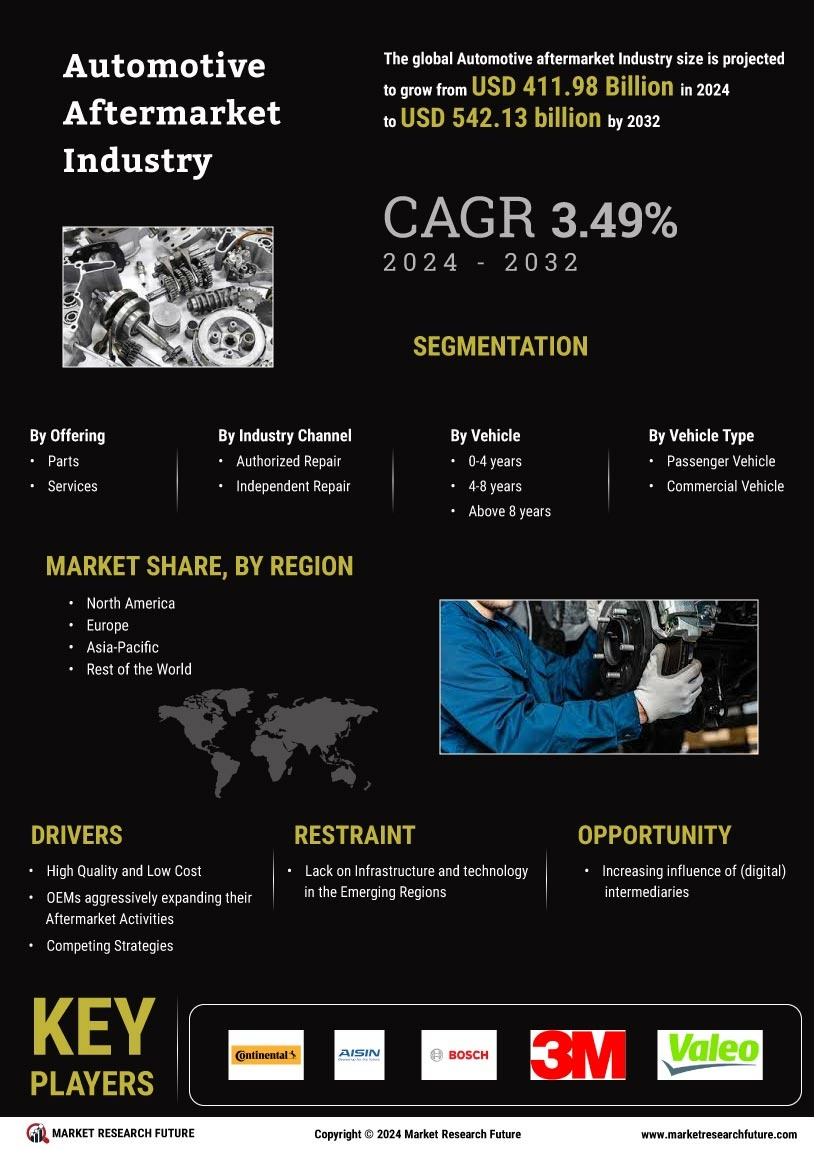
Automotive Aftermarket Industry
ID: MRFR/AT/4790-CR
100 Pages
Triveni Bhoyar
Last Updated: April 17, 2026
Automotive AfterMarket Size, Share & Growth Analysis Report By Product Type (Parts, Accessories, Tires, Lubricants, Service Equipment), By Sales Channel (Online, Offline Retail, Wholesale, Direct Sales), By Vehicle Type (Passenger Cars, Commercial Vehicles, Motorcycles, Heavy-Duty Vehicles), By Service Type (Maintenance Services, Repair Services, Installation Services, Modification Services) and By Regional (North America, Europe, South America, Asia Pacific, Middle East and Africa) - Industry Outlook & Forecast to 2035