Automated Breach Attack Simulation Market Segmentation
Automated Breach Attack Simulation Market By Components (USD Billion, 2025-2035)
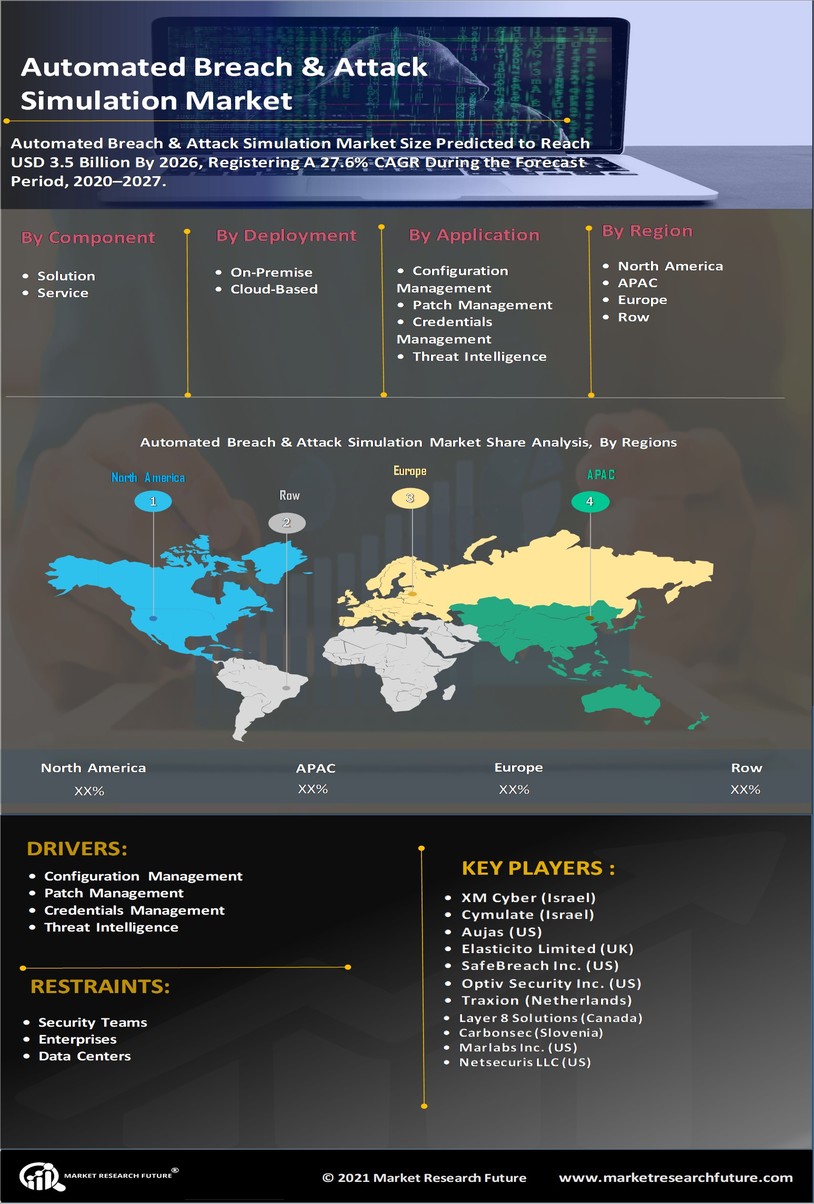
- Solutions
- Services
Automated Breach Attack Simulation Market By Deployment (USD Billion, 2025-2035)
- On-Premise
- Cloud-based
Automated Breach Attack Simulation Market By Application (USD Billion, 2025-2035)
- Configuration Management
- Patch Management
- Credentials Management
- Threat Intelligence
- Others