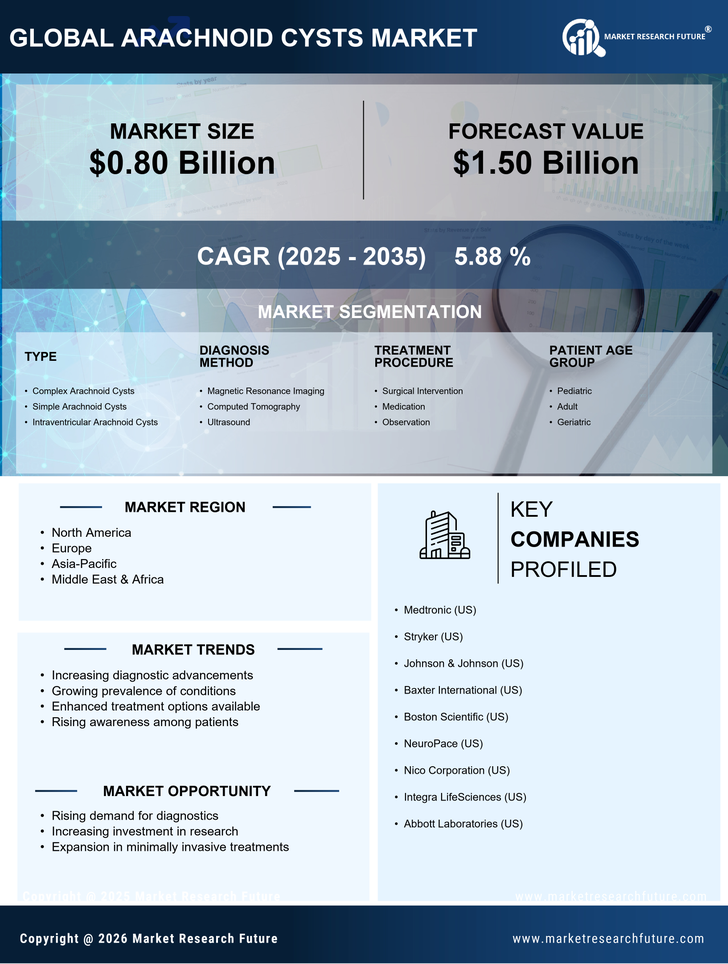
Certified Global Research Member
Isomar fd.webp Wcrc 57.webp
Key Questions Answered
  • Global Market Outlook
  • In-depth analysis of global and regional trends
  • Analyze and identify the major players in the market, their market share, key developments, etc.
  • To understand the capability of the major players based on products offered, financials, and strategies.
  • Identify disrupting products, companies, and trends.
  • To identify opportunities in the market.
  • Analyze the key challenges in the market.
  • Analyze the regional penetration of players, products, and services in the market.
  • Comparison of major players’ financial performance.
  • Evaluate strategies adopted by major players.
  • Recommendations
Why Choose Market Research Future?
  • Vigorous research methodologies for specific market.
  • Knowledge partners across the globe
  • Large network of partner consultants.
  • Ever-increasing/ Escalating data base with quarterly monitoring of various markets
  • Trusted by fortune 500 companies/startups/ universities/organizations
  • Large database of 5000+ markets reports.
  • Effective and prompt pre- and post-sales support.

Arachnoid Cysts Market Research Report Information By Type (Intracranial & Spinal), by Diagnosis (CT Scan, MRI Scan, Prenatal Ultrasound, Other Tests), by Treatment (Permanent Drainage System Surgery, Fenestration, Endoscopic Cyst Fenestration) - Forecast till 2030


ID: MRFR/MED/5089-HCR | 100 Pages | Author: Rahul Gotadki| April 2024
Leading companies partner with us for data-driven Insights
client_1 client_2 client_3 client_4 client_5 client_6 client_7 client_8 client_9 client_10
Please fill in Business Email for Quick Response

Table of Contents:

Chapter 1. Report Prologue

Chapter 2. Market Introduction

2.1 Definition

2.2 Scope of the Study

2.2.1 Research Objective

2.2.2 Assumptions

2.2.3 Limitations

Chapter 3. Research Methodology

3.1 Introduction

3.2 Primary Research

3.3 Secondary Research

3.4 Market Size Estimation

Chapter 4. Market Dynamics

4.1 Drivers

4.2 Restraints

4.3 Opportunities

4.4 Challenges

4.5 Macroeconomic Indicators

4.6 Technology Trends & Assessment

Chapter 5. Market Factor Analysis

5.1 Porter’s Five Forces Analysis

5.1.1 Bargaining Power of Suppliers

5.1.2 Bargaining Power of Buyers

5.1.3 Threat of New Entrants

5.1.4 Threat of Substitutes

5.1.5 Intensity of Rivalry

5.2 Value Chain Analysis

5.3 Investment Feasibility Analysis

5.4 Pricing Analysis

Chapter 6. Global Arachnoid Cysts Market, by Type

6.1 Introduction

6.2 Intracranial

Market Estimates & Forecast, by Region, 2023-2030

Market Estimates & Forecast, by Country, 2023-2030

6.3 Spinal

Market Estimates & Forecast, by Region, 2023-2030

Market Estimates & Forecast, by Country, 2023-2030

Chapter 7. Global Arachnoid Cysts Market, by Diagnosis

7.1 Introduction

7.2 CT Scan

Market Estimates & Forecast, by Region, 2023-2030

Market Estimates & Forecast, by Country, 2023-2030

7.3 MRI Scan

Market Estimates & Forecast, by Region, 2023-2030

Market Estimates & Forecast, by Country, 2023-2030

7.4 Prenatal Ultrasound

Market Estimates & Forecast, by Region, 2023-2030

Market Estimates & Forecast, by Country, 2023-2030

7.7 Other Tests

Chapter 8. Global Arachnoid Cysts Market, by Treatment

8.1 Introduction

8.2 Permanent drainage system surgery

Market Estimates & Forecast, by Region, 2023-2030

Market Estimates & Forecast, by Country, 2023-2030

8.3 Fenestration

Market Estimates & Forecast, by Region, 2023-2030

Market Estimates & Forecast, by Country, 2023-2030

8.4 Endoscopic Cyst Fenestration

Market Estimates & Forecast, by Region, 2023-2030

Market Estimates & Forecast, by Country, 2023-2030

Chapter 9. Global Arachnoid Cysts Market, by Region

9.1 Introduction

9.2 Americas

9.2.1 North America

9.2.1.1 US

9.2.1.2 Canada

9.2.2 South America

9.3 Europe

9.3.1 Western Europe

9.3.1.1 Germany

9.3.1.2 France

9.3.1.3 Italy

9.3.1.4 Spain

9.3.1.5 UK

9.3.1.6 Rest of Western Europe

9.3.2 Eastern Europe

9.4 Asia-Pacific

9.4.1 Japan

9.4.2 China

9.4.3 India

9.4.4 Australia

9.4.5 South Korea

9.4.6 Rest of Asia-Pacific

9.5 Middle East & Africa

9.5.1 Middle East

9.5.2 Africa

Chapter 10. Company Landscape

10.1 Introduction

10.2 Market Share Analysis

10.3 Key Development & Strategies

Chapter 11. Company Profiles

11.1 Spiegelberg GmbH & Co. KG .

11.1.1 Company Overview

11.1.2 Product Overview

11.1.3 Financials Overview

11.1.4 Key Developments

11.1.5 SWOT Analysis

11.2 Sophysa

11.2.1 Company Overview

11.2.2 Product Overview

11.2.3 Financial Overview

11.2.4 Key Developments

11.2.5 SWOT Analysis

11.3 Aesculap, Inc.

11.3.1 Company Overview

11.3.2 Product Overview

11.3.3 Financial Overview

11.3.4 Key Development

11.3.5 SWOT Analysis

11.4 DePuy Synthes

11.4.1 Company Overview

11.4.2 Product Overview

11.4.3 Financial Overview

11.4.4 Key Development

11.4.5 SWOT Analysis

11.5 Medtronic

11.5.1 Company Overview

11.5.2 Product Overview

11.5.3 Financial overview

11.5.4 Key Developments

11.5.5 SWOT Analysis

11.6 Integra LifeSciences

11.6.1 Company Overview

11.6.2 Product Overview

11.6.3 Financial Overview

11.6.4 Key Developments

11.6.5 SWOT Analysis

11.7 Christoph Miethke GmbH & Co. KG

11.7.1 Overview

11.7.2 Product Overview

11.7.3 Financial Overview

11.7.4 Key Developments

11.7.5 SWOT Analysis

11.8 Tokibo Co. Ltd.

11.8.1 Overview

11.8.2 Product Overview

11.8.3 Financials

11.8.4 Key Developments

11.8.5 SWOT Analysis

11.9 Boston Neurosciences

11.9.1 Overview

11.9.2 Product Overview

11.9.3 Financials

11.9.4 Key Developments

11.9.5 SWOT Analysis

11.10 Koninklijke Philips N.V.

11.10.1 Company Overview

11.10.2 Product Overview

11.10.3 Financial Overview

11.10.4 Key Developments

11.10.5 SWOT Analysis

11.11 GENERAL ELECTRIC COMPANY

11.11.1 Overview

11.11.2 Product Overview

11.11.3 Financial Overview

11.11.4 Key Developments

11.11.5 SWOT Analysis

11.12 Hitachi Medical Systems Europe

11.12.1 Overview

11.12.2 Product Overview

11.12.3 Financials

11.12.4 Key Developments

11.12.5 SWOT Analysis

11.13 Siemens Healthcare Private Limited

11.13.1 Overview

11.13.2 Product Overview

11.13.3 Financials

11.13.4 Key Developments

11.13.5 SWOT Analysis

11.14 FUJIFILM SonoSite, Inc.

11.14.1 Overview

11.14.2 Product Overview

11.14.3 Financials

11.14.4 Key Developments

11.14.5 SWOT Analysis

Chapter 12 MRFR Conclusion

12.1 Key Findings

12.1.1 From CEO’s Viewpoint

12.1.2 Unmet Needs of the Market

12.2 Key Companies to Watch

12.3 Predictions for the Arachnoid Cysts Industry

Chapter 13. Appendix

LIST OF TABLES

Table 1 Global Arachnoid Cysts Market Synopsis, 2023-2030

Table 2 Global Arachnoid Cysts Market Estimates and Forecast, 2023-2030 (USD Million)

Table 3 Global Arachnoid Cysts Market, by Region, 2023-2030 (USD Million)

Table 4 Global Arachnoid Cysts Market, by Type, 2023-2030 (USD Million)

Table 5 Global Arachnoid Cysts Market, by Diagnosis, 2023-2030(USD Million)

Table 6 Global Arachnoid Cysts Market, by Treatment, 2023-2030 (USD Million)

Table 7 North America: Arachnoid Cysts Market, by Type, 2023-2030 (USD Million)

Table 8 North America: Arachnoid Cysts Market, by Diagnosis, 2023-2030 (USD Million)

Table 9 North America: Arachnoid Cysts Market, by Treatment, 2023-2030 (USD Million)

Table 10 US: Arachnoid Cysts Market, by Type, 2023-2030 (USD Million)

Table 11 US: Arachnoid Cysts Market, by Diagnosis, 2023-2030 (USD Million)

Table 12 US: Arachnoid Cysts Market, by Treatment, 2023-2030 (USD Million)

Table 13 Canada: Arachnoid Cysts Market, by Type, 2023-2030 (USD Million)

Table 14 Canada: Arachnoid Cysts Market, by Diagnosis, 2023-2030 (USD Million)

Table 15 Canada: Arachnoid Cysts Market, by Treatment, 2023-2030 (USD Million)

Table 16 South America: Arachnoid Cysts Market, by Type, 2023-2030 (USD Million)

Table 17 South America: Arachnoid Cysts Market, by Diagnosis, 2023-2030 (USD Million)

Table 18 South America: Arachnoid Cysts Market, by Treatment, 2023-2030 (USD Million)

Table 19 Europe: Arachnoid Cysts Market, by Type, 2023-2030 (USD Million)

Table 20 Europe: Arachnoid Cysts Market, by Diagnosis, 2023-2030 (USD Million)

Table 21 Europe: Arachnoid Cysts Market, by Treatment, 2023-2030 (USD Million)

Table 22 Western Europe: Arachnoid Cysts Market, by Type, 2023-2030 (USD Million)

Table 23 Western Europe: Arachnoid Cysts Market, by Diagnosis, 2023-2030 (USD Million)

Table 24 Western Europe: Arachnoid Cysts Market, by Treatment, 2023-2030 (USD

Million)

Table 25 Eastern Europe: Arachnoid Cysts Market, by Type, 2023-2030 (USD Million)

Table 26 Eastern Europe: Arachnoid Cysts Market, by Diagnosis, 2023-2030 (USD Million)

Table 27 Eastern Europe: Arachnoid Cysts Market, by Treatment, 2023-2030 (USD Million)

Table 28 Asia-Pacific: Arachnoid Cysts Market, by Type, 2023-2030 (USD Million)

Table 29 Asia-Pacific: Arachnoid Cysts Market, by Diagnosis, 2023-2030 (USD Million)

Table 30 Asia-Pacific: Arachnoid Cysts Market, by Treatment, 2023-2030 (USD Million)

Table 31 Middle East & Africa: Arachnoid Cysts Market, by Type, 2023-2030 (USD Million)

Table 32 Middle East & Africa: Arachnoid Cysts Market, by Diagnosis, 2023-2030 (USD Million)

Table 33 Middle East & Africa: Arachnoid Cysts Market, by Treatment, 2023-2030 (USD

Million)

LIST OF FIGURES

Figure 1 Research Process

Figure 2 Segmentation for Global Arachnoid Cysts Market

Figure 3 Segmentation Market Dynamics for Global Arachnoid Cysts Market

Figure 4 Global Arachnoid Cysts Market Share, by Type, 2023

Figure 5 Global Arachnoid Cysts Market Share, by Diagnosis, 2023

Figure 6 Global Arachnoid Cysts Market Share, by Treatment, 2023

Figure 7 Global Arachnoid Cysts Market Share, by Region, 2023

Figure 8 North America: Arachnoid Cysts Market Share, by Country, 2023

Figure 9 Europe: Arachnoid Cysts Market Share, by Country, 2023

Figure 10 Asia-Pacific: Arachnoid Cysts Market Share, by Country, 2023

Figure 11 Middle East & Africa: Arachnoid Cysts Market Share, by Country, 2023

Figure 12 Global Arachnoid Cysts Market: Company Share Analysis, 2023 (%)

Figure 13 Spiegelberg GmbH & Co. KG .: Key Financials

Figure 14 Spiegelberg GmbH & Co. KG .: Segmental Revenue

Figure 15 Spiegelberg GmbH & Co. KG .: Geographical Revenue

Figure 16 Sophysa: Key Financials

Figure 17 Sophysa: Segmental Revenue

Figure 18 Sophysa: Geographical Revenue

Figure 19 Aesculap, Inc.: Key Financials

Figure 20 Aesculap, Inc.: Segmental Revenue

Figure 21 Aesculap, Inc.: Geographical Revenue

Figure 22 DePuy Synthes: Key Financials

Figure 23 DePuy Synthes: Segmental Revenue

Figure 24 DePuy Synthes: Geographical Revenue

Figure 25 Medtronic: Key Financials

Figure 26 Medtronic: Segmental Revenue

Figure 27 Medtronic: Geographical Revenue

Figure 28 Integra LifeSciences: Key Financials

Figure 29 Integra LifeSciences: Segmental Revenue

Figure 30 Integra LifeSciences: Geographical Revenue

Figure 31 Christoph Miethke GmbH & Co. KG: Key Financials

Figure 32 Christoph Miethke GmbH & Co. KG: Segmental Revenue

Figure 33 Christoph Miethke GmbH & Co. KG: Geographical Revenue

Figure 34 Tokibo Co. Ltd.: Financials

Figure 35 Tokibo Co. Ltd.: Segmental Revenue

Figure 36 Tokibo Co. Ltd.: Geographical Revenue

Figure 37 Boston Neurosciences: Key Financials

Figure 38 Boston Neurosciences: Segmental Revenue

Figure 39 Boston Neurosciences: Geographical Revenue

Figure 40 Koninklijke Philips N.V.: Key Financials

Figure 41 Koninklijke Philips N.V.: Segmental Revenue

Figure 42 Koninklijke Philips N.V.: Geographical Revenue

Figure 43 GENERAL ELECTRIC COMPANY: Key Financials

Figure 44 GENERAL ELECTRIC COMPANY: Segmental Revenue

Figure 45 GENERAL ELECTRIC COMPANY: Geographical Revenue

Figure 46 Hitachi Medical Systems Europe: Key Financials

Figure 47 Hitachi Medical Systems Europe: Segmental Revenue

Figure 48 Hitachi Medical Systems Europe: Geographical Revenue

Figure 49 Siemens Healthcare Private Limited: Financials

Figure 50 Siemens Healthcare Private Limited: Segmental Revenue

Figure 51 Siemens Healthcare Private Limited: Geographical Revenue

Figure 52 FUJIFILM SonoSite, Inc.: Key Financials

Figure 53 FUJIFILM SonoSite, Inc.: Segmental Revenue

Figure 54 FUJIFILM SonoSite, Inc.: Geographical Revenue

Purchase Option
Single User $ 4,950
Multiuser License $ 5,950
Enterprise User $ 7,250
Compare Licenses
Tailored for You
  • Dedicated Research on any specifics segment or region.
  • Focused Research on specific players in the market.
  • Custom Report based only on your requirements.
  • Flexibility to add or subtract any chapter in the study.
  • Historic data from 2014 and forecasts outlook till 2040.
  • Flexibility of providing data/insights in formats (PDF, PPT, Excel).
  • Provide cross segmentation in applicable scenario/markets.