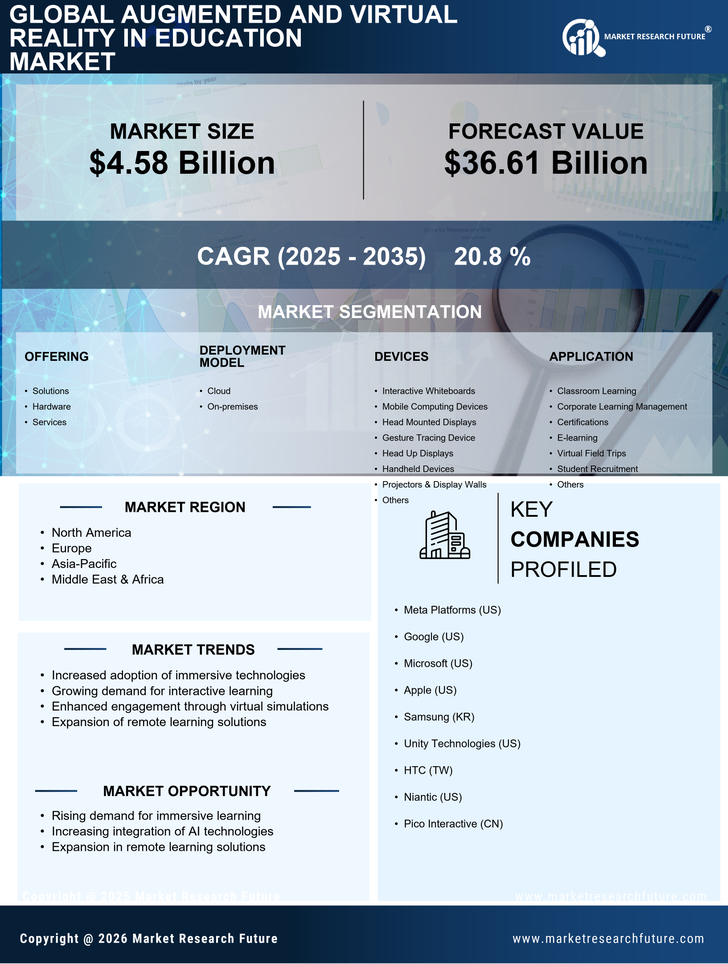
Certified Global Research Member
Isomar fd.webp Wcrc 57.webp
Key Questions Answered
  • Global Market Outlook
  • In-depth analysis of global and regional trends
  • Analyze and identify the major players in the market, their market share, key developments, etc.
  • To understand the capability of the major players based on products offered, financials, and strategies.
  • Identify disrupting products, companies, and trends.
  • To identify opportunities in the market.
  • Analyze the key challenges in the market.
  • Analyze the regional penetration of players, products, and services in the market.
  • Comparison of major players’ financial performance.
  • Evaluate strategies adopted by major players.
  • Recommendations
Why Choose Market Research Future?
  • Vigorous research methodologies for specific market.
  • Knowledge partners across the globe
  • Large network of partner consultants.
  • Ever-increasing/ Escalating data base with quarterly monitoring of various markets
  • Trusted by fortune 500 companies/startups/ universities/organizations
  • Large database of 5000+ markets reports.
  • Effective and prompt pre- and post-sales support.

Augmented and Virtual Reality in Education Market Research Report Information by Offering (Hardware (Sensors, Controllers, Cameras, and VR headset), Software, Services (Managed Services and Professional Services)) Devices (Interactive Whiteboards, Mobile Computing Devices, Head Mounted displays) Application (Classroom Learning, Corporate Learning Management, e-learning, Corporate (Telecommunications and IT, Healthcare, Retail and Ecommerce, Banking, Financial Services, and Insurance, Manufacturing) and Regions -Forecast till 2032


ID: MRFR/ICT/9350-HCR | 141 Pages | Author: Shubham Munde| April 2024

Research Methodology on AR and VR in Education Market


Introduction


In recent years, the usage of Augmented Reality (AR) and Virtual Reality (VR) in education has taken the world by storm. AR and VR technologies provide a unique learning experience through which users can actively engage with virtual or augmented content. The use of these technologies has resulted in tremendous transformations in the way educational content is imparted and how learning is perceived. It allows students to learn interactively and gain insights from a 3D environment.


The objective of this research is to investigate the potential of AR and VR in education and analyse their impact on student learning outcomes. Moreover, this research discusses the challenges associated with the adoption and implementation of AR and VR in educational institutions.


The research is based on secondary research and primary data which includes surveys, interviews, and focus groups.


Research Methodology


This research adopts a componential methodology, which shall include both qualitative and quantitative research techniques. The aim of the research is to gain a better understanding of the impact of the use of AR and VR technology in the education sector. The following is a step-by-step guide to the theoretical framework:


1. Collection of secondary data


The first step of the research process involves the collection of secondary data to gain insight into the existing scenarios and current trends associated with AR and VR in education. This secondary data includes information from online sources such as journals, websites, books and the annual reports of educational institutions. Additionally, it also includes data from other relevant sources such as market research reports, industry analysis, etc. Maximum usage of research shall be given to secondary sources.


2. Design of survey questionnaire


The next step involves the design of a survey questionnaire to evaluate the effectiveness of AR and VR technologies in education. Questions shall include, but not be limited to, the student’s opinions on the benefits and use of AR and VR technology in the education sector, their views on the cost efficiency, user experience, and any possible challenges they have faced due to the adoption of such technologies.


3. Sample selection


The sample shall include undergraduates and postgraduates from both primary and secondary educational institutions. The selection of participants shall be done using a random technique and a purposive technique. This means that a certain percentage of students are surveyed using randomly generated numbers, as well as handpicked individuals with relevant profiles.


4. Primary data collection


This step of the research involves the collection of primary data from the surveyed participants. This includes both quantitative (structured) and qualitative (unstructured) data, which is further used to analyze the recommendations, potential challenges and outcomes associated with the use of AR and VR in the education sector.


5. Data analysis


The collected data is analyzed using appropriate statistical tools. The aim of this step is to identify and evaluate the key factors leading to the successful and efficient adoption of AR and VR technologies in education. Emphasized is given to the user experience in order to address any issues with the deployment of such technologies.


6. Identification of challenges and recommendations


The conclusion of this research includes the challenges and recommendations based on the primary and secondary data collected and analyzed. Various suggestions, such as providing appropriate training to teachers and ensuring increased accessibility to the technology, are provided based on the collected data. Additionally, strategies for the implementation of AR and VR technologies in educational institutions are also outlined.


Conclusion


This research aims to investigate the potential of AR and VR in education and the impact it has on student learning outcomes. Utilizing componential methodology, primary and secondary data is collected and analyzed to identify the challenges and potential benefits associated with the adoption of such technologies. It also provides recommendations and strategies to ensure their successful implementation in educational institutions. The report hopes to create a platform where students are provided with relevant and interactive insights related to educational subjects using AR and VR.

Leading companies partner with us for data-driven Insights
client_1 client_2 client_3 client_4 client_5 client_6 client_7 client_8 client_9 client_10
Please fill in Business Email for Quick Response

TABLE OF CONTENTS

1. EXECUTIVE SUMMARY

1.1. Market Attractiveness Analysis

1.1.1. Global Augmented and Virtual Reality in Education Market, by Offering

1.1.2. Global Augmented and Virtual Reality in Education Market, by Devices

1.1.3. Global Augmented and Virtual Reality in Education Market, by Deployment Model

1.1.4. Global Augmented and Virtual Reality in Education Market, by Application

1.1.5. Global Augmented and Virtual Reality in Education Market, by End Users

1.1.6. Global Augmented and Virtual Reality in Education Market, by Region

2. MARKET INTRODUCTION

2.1. Definition

2.2. Scope of the Study

2.3. Market Structure

3. RESEARCH METHODOLOGY

3.1. Research Process

3.2. Primary Research

3.3. Secondary Research

3.4. Market Size Estimation

3.5. Forecast Model

3.6. List of Assumptions

4. MARKET DYNAMICS

4.1. Introduction

4.2. Drivers

4.2.1. Increasing adoption of advanced technology products and devices and growing development in education sector

4.2.2. Increasing penetration of internet of things (IoT) and adoption of connected devices

4.3. Restraint

4.3.1. High cost of products

4.3.2. Data security and privacy concerns

4.4. Opportunity

4.4.1. Growing adoption of virtual trips

4.5. Impact of COVID-19

4.5.1. Impact of COVID-19 on corporate and academic

5. MARKET FACTOR ANALYSIS

5.1. Value Chain Analysis/Supply Chain Analysis

5.2. Porter’s Five Forces Model

5.2.1. Bargaining Power of Suppliers

5.2.2. Bargaining Power of Buyers

5.2.3. Threat of New Entrants

5.2.4. Threat of Substitutes

5.2.5. Intensity of Rivalry

6. GLOBAL AUGMENTED AND VIRTUAL REALITY IN EDUCATION MARKET, BY OFFERING

6.1. Introduction

6.1.1. Hardware

6.1.1.1. Sensors

6.1.1.2. Controllers

6.1.1.3. Cameras

6.1.1.4. VR headset

6.1.1.5. Others

6.1.2. Software

6.1.3. Services

6.1.3.1. Managed Services

6.1.3.2. Professional Services

7. GLOBAL AUGMENTED AND VIRTUAL REALITY IN EDUCATION MARKET, BY DEVICES

7.1. Introduction

7.2. Interactive whiteboards

7.3. Mobile Computing Devices

7.4. Head Mounted displays

7.5. Gesture Tracing Device

7.5.1. Head up displays

7.5.2. Handheld devices

7.6. Projectors & display walls

7.7. Others

8. GLOBAL AUGMENTED AND VIRTUAL REALITY IN EDUCATION MARKET, BY DEPLOYMENT MODEL

8.1. Introduction

8.2. Cloud

8.3. On-premises

9. GLOBAL AUGMENTED AND VIRTUAL REALITY IN EDUCATION MARKET, BY APPLICATION

9.1. Introduction

9.2. Classroom Learning

9.3. Corporate Learning Management

9.4. Certifications

9.5. e-learning

9.6. Virtual field trips

9.7. Student Recruitment

9.8. Others

10. GLOBAL AUGMENTED AND VIRTUAL REALITY IN EDUCATION MARKET, BY END USERS

10.1. Introduction

10.2. Academic

10.2.1. K-12

10.2.2. Higher Education

10.2.3. Vocational

10.3. Corporate

10.3.1. IT & Telecommunication

10.3.2. BFSI

10.3.3. Healthcare & Life sciences

10.3.4. Retail & E-commerce

10.3.5. Government & Public Sector

10.3.6. Others

11. GLOBAL AUGMENTED AND VIRTUAL REALITY IN EDUCATION MARKET, BY REGION

11.1. Introduction

11.2. North America

11.2.1. Market Size & Estimates, by Offering 2019–2027

11.2.2. Market Size & Estimates, by Devices, 2019–2027

11.2.3. Market Size & Estimates, by Deployment Model, 2019–2027

11.2.4. Market Size & Estimates, by Application, 2019–2027

11.2.5. Market Size & Estimates, by End Users, 2019–2027

11.2.6. Market Size & Estimates, by Region, 2018–2026

11.2.7. US

11.2.7.1. Market Size & Estimates, by Offering 2019–2027

11.2.7.2. Market Size & Estimates, by Devices, 2019–2027

11.2.7.3. Market Size & Estimates, by Deployment Model, 2019–2027

11.2.7.4. Market Size & Estimates, by Application, 2019–2027

11.2.7.5. Market Size & Estimates, by End Users, 2019–2027

11.2.8. Canada

11.2.8.1. Market Size & Estimates, by Offering 2019–2027

11.2.8.2. Market Size & Estimates, by Devices, 2019–2027

11.2.8.3. Market Size & Estimates, by Deployment Model, 2019–2027

11.2.8.4. Market Size & Estimates, by Application, 2019–2027

11.2.8.5. Market Size & Estimates, by End Users, 2019–2027

11.2.9. Mexico

11.2.9.1. Market Size & Estimates, by Offering 2019–2027

11.2.9.2. Market Size & Estimates, by Devices, 2019–2027

11.2.9.3. Market Size & Estimates, by Deployment Model, 2019–2027

11.2.9.4. Market Size & Estimates, by Application, 2019–2027

11.2.9.5. Market Size & Estimates, by End Users, 2019–2027

11.3. Europe

11.3.1. Market Size & Estimates, by Offering 2019–2027

11.3.2. Market Size & Estimates, by Devices, 2019–2027

11.3.3. Market Size & Estimates, by Deployment Model, 2019–2027

11.3.4. Market Size & Estimates, by Application, 2019–2027

11.3.5. Market Size & Estimates, by End Users, 2019–2027

11.3.6. Germany

11.3.6.1. Market Size & Estimates, by Offering 2019–2027

11.3.6.2. Market Size & Estimates, by Devices, 2019–2027

11.3.6.3. Market Size & Estimates, by Deployment Model, 2019–2027

11.3.6.4. Market Size & Estimates, by Application, 2019–2027

11.3.6.5. Market Size & Estimates, by End Users, 2019–2027

11.3.7. France

11.3.7.1. Market Size & Estimates, by Offering 2019–2027

11.3.7.2. Market Size & Estimates, by Devices, 2019–2027

11.3.7.3. Market Size & Estimates, by Deployment Model, 2019–2027

11.3.7.4. Market Size & Estimates, by Application, 2019–2027

11.3.7.5. Market Size & Estimates, by End Users, 2019–2027

11.3.8. UK

11.3.8.1. Market Size & Estimates, by Offering 2019–2027

11.3.8.2. Market Size & Estimates, by Devices, 2019–2027

11.3.8.3. Market Size & Estimates, by Deployment Model, 2019–2027

11.3.8.4. Market Size & Estimates, by Application, 2019–2027

11.3.8.5. Market Size & Estimates, by End Users, 2019–2027

11.3.9. Rest of Europe

11.3.9.1. Market Size & Estimates, by Offering 2019–2027

11.3.9.2. Market Size & Estimates, by Devices, 2019–2027

11.3.9.3. Market Size & Estimates, by Deployment Model, 2019–2027

11.3.9.4. Market Size & Estimates, by Application, 2019–2027

11.3.9.5. Market Size & Estimates, by End Users, 2019–2027

11.4. Asia-Pacific

11.4.1. Market Size & Estimates, by Offering 2019–2027

11.4.2. Market Size & Estimates, by Devices, 2019–2027

11.4.3. Market Size & Estimates, by Deployment Model, 2019–2027

11.4.4. Market Size & Estimates, by Application, 2019–2027

11.4.5. Market Size & Estimates, by End Users, 2019–2027

11.4.6. China

11.4.6.1. Market Size & Estimates, by Offering 2019–2027

11.4.6.2. Market Size & Estimates, by Devices, 2019–2027

11.4.6.3. Market Size & Estimates, by Deployment Model, 2019–2027

11.4.6.4. Market Size & Estimates, by Application, 2019–2027

11.4.6.5. Market Size & Estimates, by End Users, 2019–2027

11.4.7. Japan

11.4.7.1. Market Size & Estimates, by Offering 2019–2027

11.4.7.2. Market Size & Estimates, by Devices, 2019–2027

11.4.7.3. Market Size & Estimates, by Deployment Model, 2019–2027

11.4.7.4. Market Size & Estimates, by Application, 2019–2027

11.4.7.5. Market Size & Estimates, by End Users, 2019–2027

11.4.8. India

11.4.8.1. Market Size & Estimates, by Offering 2019–2027

11.4.8.2. Market Size & Estimates, by Devices, 2019–2027

11.4.8.3. Market Size & Estimates, by Deployment Model, 2019–2027

11.4.8.4. Market Size & Estimates, by Application, 2019–2027

11.4.8.5. Market Size & Estimates, by End Users, 2019–2027

11.4.9. Rest of Asia-Pacific

11.4.9.1. Market Size & Estimates, by Offering 2019–2027

11.4.9.2. Market Size & Estimates, by Devices, 2019–2027

11.4.9.3. Market Size & Estimates, by Deployment Model, 2019–2027

11.4.9.4. Market Size & Estimates, by Application, 2019–2027

11.4.9.5. Market Size & Estimates, by End Users, 2019–2027

11.5. Middle East & Africa

11.5.1.1. Market Size & Estimates, by Offering 2019–2027

11.5.1.2. Market Size & Estimates, by Devices, 2019–2027

11.5.1.3. Market Size & Estimates, by Deployment Model, 2019–2027

11.5.1.4. Market Size & Estimates, by Application, 2019–2027

11.5.1.5. Market Size & Estimates, by End Users, 2019–2027

11.6. South America

11.6.1.1. Market Size & Estimates, by Offering 2019–2027

11.6.1.2. Market Size & Estimates, by Devices, 2019–2027

11.6.1.3. Market Size & Estimates, by Deployment Model, 2019–2027

11.6.1.4. Market Size & Estimates, by Application, 2019–2027

11.6.1.5. Market Size & Estimates, by End Users, 2019–2027

12. COMPETITIVE LANDSCAPE

12.1. Introduction

12.2. Key Players Market Share Analysis, 2021 (%)

12.3. Competitive Benchmarking

12.4. Competitor Dashboard

12.5. Major Growth Strategy in the Market

12.6. Key Developments & Growth Strategies

12.6.1. Product Developments

12.6.2. Mergers & Acquisitions

12.6.3. Contracts & Agreements

13. COMPANY PROFILES

13.1. Sony

13.1.1. Company Overview

13.1.2. Financial Overview

13.1.3. Products Offered

13.1.4. Key Developments

13.1.5. SWOT Analysis

13.1.6. Key Strategies

13.2. Samsung Electronics

13.2.1. Company Overview

13.2.2. Financial Overview

13.2.3. Products Offered

13.2.4. Key Developments

13.2.5. SWOT Analysis

13.2.6. Key Strategies

13.3. HTC

13.3.1. Company Overview

13.3.2. Financial Overview

13.3.3. Products Offered

13.3.4. Key Developments

13.3.5. SWOT Analysis

13.3.6. Key Strategies

13.4. Google

13.4.1. Company Overview

13.4.2. Financial Overview

13.4.3. Products Offered

13.4.4. Key Developments

13.4.5. SWOT Analysis

13.4.6. Key Strategies

13.5. Microsoft

13.5.1. Company Overview

13.5.2. Financial Overview

13.5.3. Products Offered

13.5.4. Key Developments

13.5.5. SWOT Analysis

13.5.6. Key Strategies

13.6. Panasonic

13.6.1. Company Overview

13.6.2. Financial Overview

13.6.3. Products Offered

13.6.4. Key Developments

13.6.5. SWOT Analysis

13.6.6. Key Strategies

13.7. Hitachi

13.7.1. Company Overview

13.7.2. Financial Overview

13.7.3. Products Offered

13.7.4. Key Developments

13.7.5. SWOT Analysis

13.7.6. Key Strategies

13.8. Barco

13.8.1. Company Overview

13.8.2. Financial Overview

13.8.3. Products Offered

13.8.4. Key Developments

13.8.5. SWOT Analysis

13.8.6. Key Strategies

13.9. LG Electronics

13.9.1. Company Overview

13.9.2. Financial Overview

13.9.3. Products Offered

13.9.4. Key Developments

13.9.5. SWOT Analysis

13.9.6. Key Strategies

13.10. Veative Labs

13.10.1. Company Overview

13.10.2. Financial Overview

13.10.3. Products Offered

13.10.4. Key Developments

13.10.5. SWOT Analysis

13.10.6. Key Strategies

13.11. Cisco

13.11.1. Company Overview

13.11.2. Financial Overview

13.11.3. Products Offered

13.11.4. Key Developments

13.11.5. SWOT Analysis

13.11.6. Key Strategies

13.12. Blackboard

13.12.1. Company Overview

13.12.2. Financial Overview

13.12.3. Products Offered

13.12.4. Key Developments

13.12.5. SWOT Analysis

13.12.6. Key Strategies

13.13. Dell

13.13.1. Company Overview

13.13.2. Financial Overview

13.13.3. Products Offered

13.13.4. Key Developments

13.13.5. SWOT Analysis

13.13.6. Key Strategies

13.14. SIBM

13.14.1. Company Overview

13.14.2. Financial Overview

13.14.3. Products Offered

13.14.4. Key Developments

13.14.5. SWOT Analysis

13.14.6. Key Strategies

13.15. Saba Software

13.15.1. Company Overview

13.15.2. Financial Overview

13.15.3. Products Offered

13.15.4. Key Developments

13.15.5. SWOT Analysis

13.15.6. Key Strategies

14. APPENDIX

14.1.1. Discussion Blueprint

LIST OF TABLES

TABLE 1 LIST OF ASSUMPTIONS

TABLE 2 GLOBAL AUGMENTED AND VIRTUAL REALITY IN EDUCATION MARKET, BY OFFERING, 2019–2027 (USD MILLION)

TABLE 3 GLOBAL AUGMENTED AND VIRTUAL REALITY IN EDUCATION MARKET, BY DEPLOYMENT MODEL, 2019–2027 (USD MILLION)

TABLE 4 GLOBAL AUGMENTED AND VIRTUAL REALITY IN EDUCATION MARKET, BY DEVICES, 2019–2027 (USD MILLION)

TABLE 5 GLOBAL AUGMENTED AND VIRTUAL REALITY IN EDUCATION MARKET, BY APPLICATION, 2019–2027 (USD MILLION)

TABLE 6 GLOBAL AUGMENTED AND VIRTUAL REALITY IN EDUCATION MARKET, BY END USERS, 2019–2027 (USD MILLION)

TABLE 7 GLOBAL AUGMENTED AND VIRTUAL REALITY IN EDUCATION MARKET, BY REGION, 2019–2027 (USD MILLION)

TABLE 8 NORTH AMERICA: AUGMENTED AND VIRTUAL REALITY IN EDUCATION MARKET, BY COUNTRY, 2019–2027 (USD MILLION)

TABLE 10 NORTH AMERICA : AUGMENTED AND VIRTUAL REALITY IN EDUCATION MARKET, BY OFFERING, 2019–2027 (USD MILLION)

TABLE 11 NORTH AMERICA: AUGMENTED AND VIRTUAL REALITY IN EDUCATION MARKET, BY DEPLOYMENT MODEL, 2019–2027 (USD MILLION)

TABLE 12 NORTH AMERICA: AUGMENTED AND VIRTUAL REALITY IN EDUCATION MARKET, BY DEVICES, 2019–2027 (USD MILLION)

TABLE 13 NORTH AMERICA: AUGMENTED AND VIRTUAL REALITY IN EDUCATION MARKET, BY APPLICATION, 2019–2027 (USD MILLION)

TABLE 14 NORTH AMERICA: AUGMENTED AND VIRTUAL REALITY IN EDUCATION MARKET, BY END USERS, 2019–2027 (USD MILLION)

TABLE 15 US: AUGMENTED AND VIRTUAL REALITY IN EDUCATION MARKET, BY OFFERING, 2019–2027 (USD MILLION)

TABLE 16 US: AUGMENTED AND VIRTUAL REALITY IN EDUCATION MARKET, BY DEPLOYMENT MODEL, 2019–2027 (USD MILLION)

TABLE 17 US: AUGMENTED AND VIRTUAL REALITY IN EDUCATION MARKET, BY DEVICES, 2019–2027 (USD MILLION)

TABLE 18 US: AUGMENTED AND VIRTUAL REALITY IN EDUCATION MARKET, BY APPLICATION, 2019–2027 (USD MILLION)

TABLE 19 US: AUGMENTED AND VIRTUAL REALITY IN EDUCATION MARKET, BY END USERS, 2019–2027 (USD MILLION)

TABLE 20 CANADA: AUGMENTED AND VIRTUAL REALITY IN EDUCATION MARKET, BY OFFERING, 2019–2027 (USD MILLION)

TABLE 21 CANADA: AUGMENTED AND VIRTUAL REALITY IN EDUCATION MARKET, BY DEPLOYMENT MODEL, 2019–2027 (USD MILLION)

TABLE 22 CANADA: AUGMENTED AND VIRTUAL REALITY IN EDUCATION MARKET, BY DEVICES, 2019–2027 (USD MILLION)

TABLE 23 CANADA: AUGMENTED AND VIRTUAL REALITY IN EDUCATION MARKET, BY APPLICATION, 2019–2027 (USD MILLION)

TABLE 24 CANADA: AUGMENTED AND VIRTUAL REALITY IN EDUCATION MARKET, BY END USERS, 2019–2027 (USD MILLION)

TABLE 25 MEXICO: AUGMENTED AND VIRTUAL REALITY IN EDUCATION MARKET, BY OFFERING, 2019–2027 (USD MILLION)

TABLE 26 MEXICO: AUGMENTED AND VIRTUAL REALITY IN EDUCATION MARKET, BY DEPLOYMENT MODEL, 2019–2027 (USD MILLION)

TABLE 27 MEXICO: AUGMENTED AND VIRTUAL REALITY IN EDUCATION MARKET, BY DEVICES, 2019–2027 (USD MILLION)

TABLE 28 MEXICO: AUGMENTED AND VIRTUAL REALITY IN EDUCATION MARKET, BY APPLICATION, 2019–2027 (USD MILLION)

TABLE 29 MEXICO: AUGMENTED AND VIRTUAL REALITY IN EDUCATION MARKET, BY END USERS, 2019–2027 (USD MILLION)

TABLE 30 EUROPE: AUGMENTED AND VIRTUAL REALITY IN EDUCATION MARKET, BY COUNTRY, 2019–2027 (USD MILLION)

TABLE 31 EUROPE: AUGMENTED AND VIRTUAL REALITY IN EDUCATION MARKET, BY OFFERING, 2019–2027 (USD MILLION)

TABLE 32 EUROPE: AUGMENTED AND VIRTUAL REALITY IN EDUCATION MARKET, BY DEPLOYMENT MODEL, 2019–2027 (USD MILLION)

TABLE 33 EUROPE: AUGMENTED AND VIRTUAL REALITY IN EDUCATION MARKET, BY DEVICES, 2019–2027 (USD MILLION)

TABLE 34 EUROPE: AUGMENTED AND VIRTUAL REALITY IN EDUCATION MARKET, BY APPLICATION, 2019–2027 (USD MILLION)

TABLE 35 EUROPE: AUGMENTED AND VIRTUAL REALITY IN EDUCATION MARKET, BY END USERS, 2019–2027 (USD MILLION)

TABLE 36 UK: AUGMENTED AND VIRTUAL REALITY IN EDUCATION MARKET, BY OFFERING, 2019–2027 (USD MILLION)

TABLE 37 UK: AUGMENTED AND VIRTUAL REALITY IN EDUCATION MARKET, BY DEPLOYMENT MODEL, 2019–2027 (USD MILLION)

TABLE 38 UK: AUGMENTED AND VIRTUAL REALITY IN EDUCATION MARKET, BY DEVICES, 2019–2027 (USD MILLION)

TABLE 39 UK: AUGMENTED AND VIRTUAL REALITY IN EDUCATION MARKET, BY APPLICATION, 2019–2027 (USD MILLION)

TABLE 40 UK: AUGMENTED AND VIRTUAL REALITY IN EDUCATION MARKET, BY END USERS, 2019–2027 (USD MILLION)

TABLE 41 GERMANY: AUGMENTED AND VIRTUAL REALITY IN EDUCATION MARKET, BY OFFERING, 2019–2027 (USD MILLION)

TABLE 42 GERMANY: AUGMENTED AND VIRTUAL REALITY IN EDUCATION MARKET, BY DEPLOYMENT MODEL, 2019–2027 (USD MILLION)

TABLE 43 GERMANY: AUGMENTED AND VIRTUAL REALITY IN EDUCATION MARKET, BY DEVICES, 2019–2027 (USD MILLION)

TABLE 44 GERMANY: AUGMENTED AND VIRTUAL REALITY IN EDUCATION MARKET, BY APPLICATION, 2019–2027 (USD MILLION)

TABLE 45 GERMANY: AUGMENTED AND VIRTUAL REALITY IN EDUCATION MARKET, BY END USERS, 2019–2027 (USD MILLION)

TABLE 46 FRANCE: AUGMENTED AND VIRTUAL REALITY IN EDUCATION MARKET, BY OFFERING, 2019–2027 (USD MILLION)

TABLE 47 FRANCE: AUGMENTED AND VIRTUAL REALITY IN EDUCATION MARKET, BY DEPLOYMENT MODEL, 2019–2027 (USD MILLION)

TABLE 48 FRANCE: AUGMENTED AND VIRTUAL REALITY IN EDUCATION MARKET, BY DEVICES, 2019–2027 (USD MILLION)

TABLE 49 FRANCE: AUGMENTED AND VIRTUAL REALITY IN EDUCATION MARKET, BY APPLICATION, 2019–2027 (USD MILLION)

TABLE 50 FRANCE: AUGMENTED AND VIRTUAL REALITY IN EDUCATION MARKET, BY END USERS, 2019–2027 (USD MILLION)

TABLE 51 REST OF EUROPE: AUGMENTED AND VIRTUAL REALITY IN EDUCATION MARKET, BY OFFERING, 2019–2027 (USD MILLION)

TABLE 52 REST OF EUROPE: AUGMENTED AND VIRTUAL REALITY IN EDUCATION MARKET, BY DEPLOYMENT MODEL, 2019–2027 (USD MILLION)

TABLE 53 REST OF EUROPE: AUGMENTED AND VIRTUAL REALITY IN EDUCATION MARKET, BY DEVICES, 2019–2027 (USD MILLION)

TABLE 54 REST OF EUROPE: AUGMENTED AND VIRTUAL REALITY IN EDUCATION MARKET, BY APPLICATION, 2019–2027 (USD MILLION)

TABLE 55 REST OF EUROPE: AUGMENTED AND VIRTUAL REALITY IN EDUCATION MARKET, BY END USERS, 2019–2027 (USD MILLION)

TABLE 56 ASIA-PACIFIC: AUGMENTED AND VIRTUAL REALITY IN EDUCATION MARKET, BY COUNTRY, 2019–2027 (USD MILLION)

TABLE 57 ASIA-PACIFIC: AUGMENTED AND VIRTUAL REALITY IN EDUCATION MARKET, BY OFFERING, 2019–2027 (USD MILLION)

TABLE 58 ASIA-PACIFIC: AUGMENTED AND VIRTUAL REALITY IN EDUCATION MARKET, BY DEPLOYMENT MODEL, 2019–2027 (USD MILLION)

TABLE 59 ASIA-PACIFIC: AUGMENTED AND VIRTUAL REALITY IN EDUCATION MARKET, BY DEVICES, 2019–2027 (USD MILLION)

TABLE 60 ASIA-PACIFIC: AUGMENTED AND VIRTUAL REALITY IN EDUCATION MARKET, BY APPLICATION, 2019–2027 (USD MILLION)

TABLE 61 ASIA-PACIFIC: AUGMENTED AND VIRTUAL REALITY IN EDUCATION MARKET, BY END USERS, 2019–2027 (USD MILLION)

TABLE 62 CHINA: AUGMENTED AND VIRTUAL REALITY IN EDUCATION MARKET, BY OFFERING, 2019–2027 (USD MILLION)

TABLE 63 CHINA: AUGMENTED AND VIRTUAL REALITY IN EDUCATION MARKET, BY DEPLOYMENT, 2019–2027 (USD MILLION)

TABLE 64 CHINA: AUGMENTED AND VIRTUAL REALITY IN EDUCATION MARKET, BY APPLICATION, 2019–2027 (USD MILLION)

TABLE 65 CHINA: AUGMENTED AND VIRTUAL REALITY IN EDUCATION MARKET, BY END USERS, 2019–2027 (USD MILLION)

TABLE 66 CHINA: AUGMENTED AND VIRTUAL REALITY IN EDUCATION MARKET, BY DEVICES, 2019–2027 (USD MILLION)

TABLE 67 INDIA: AUGMENTED AND VIRTUAL REALITY IN EDUCATION MARKET, BY OFFERING, 2019–2027 (USD MILLION)

TABLE 68 INDIA: AUGMENTED AND VIRTUAL REALITY IN EDUCATION MARKET, BY DEPLOYMENT, 2019–2027 (USD MILLION)

TABLE 69 INDIA: AUGMENTED AND VIRTUAL REALITY IN EDUCATION MARKET, BY APPLICATION, 2019–2027 (USD MILLION)

TABLE 70 INDIA: AUGMENTED AND VIRTUAL REALITY IN EDUCATION MARKET, BY END USERS, 2019–2027 (USD MILLION)

TABLE 71 INDIA: AUGMENTED AND VIRTUAL REALITY IN EDUCATION MARKET, BY DEVICES, 2019–2027 (USD MILLION)

TABLE 72 JAPAN: AUGMENTED AND VIRTUAL REALITY IN EDUCATION MARKET, BY OFFERING, 2019–2027 (USD MILLION)

TABLE 73 JAPAN: AUGMENTED AND VIRTUAL REALITY IN EDUCATION MARKET, BY DEPLOYMENT, 2019–2027 (USD MILLION)

TABLE 74 JAPAN: AUGMENTED AND VIRTUAL REALITY IN EDUCATION MARKET, BY APPLICATION, 2019–2027 (USD MILLION)

TABLE 75 JAPAN: AUGMENTED AND VIRTUAL REALITY IN EDUCATION MARKET, BY END USERS, 2019–2027 (USD MILLION)

TABLE 76 JAPAN: AUGMENTED AND VIRTUAL REALITY IN EDUCATION MARKET, BY DEVICES, 2019–2027 (USD MILLION)

TABLE 77 REST OF ASIA-PACIFIC: AUGMENTED AND VIRTUAL REALITY IN EDUCATION MARKET, BY OFFERING, 2019–2027 (USD MILLION)

TABLE 78 REST OF ASIA-PACIFIC: AUGMENTED AND VIRTUAL REALITY IN EDUCATION MARKET, BY DEPLOYMENT, 2019–2027 (USD MILLION)

TABLE 79 REST OF ASIA-PACIFIC: AUGMENTED AND VIRTUAL REALITY IN EDUCATION MARKET, BY APPLICATION, 2019–2027 (USD MILLION)

TABLE 80 REST OF ASIA-PACIFIC: AUGMENTED AND VIRTUAL REALITY IN EDUCATION MARKET, BY END USERS, 2019–2027 (USD MILLION)

TABLE 81 REST OF ASIA-PACIFIC: AUGMENTED AND VIRTUAL REALITY IN EDUCATION MARKET, BY DEVICES, 2019–2027 (USD MILLION)

TABLE 82 MIDDLE EAST & AFRICA: AUGMENTED AND VIRTUAL REALITY IN EDUCATION MARKET, BY OFFERING, 2019–2027 (USD MILLION)

TABLE 83 MIDDLE EAST & AFRICA: AUGMENTED AND VIRTUAL REALITY IN EDUCATION MARKET, BY DEPLOYMENT, 2019–2027 (USD MILLION)

TABLE 84 MIDDLE EAST & AFRICA: AUGMENTED AND VIRTUAL REALITY IN EDUCATION MARKET, BY APPLICATION, 2019–2027 (USD MILLION)

TABLE 85 MIDDLE EAST & AFRICA: AUGMENTED AND VIRTUAL REALITY IN EDUCATION MARKET, BY END USERS, 2019–2027 (USD MILLION)

TABLE 86 MIDDLE EAST & AFRICA: AUGMENTED AND VIRTUAL REALITY IN EDUCATION MARKET, BY DEVICES, 2019–2027 (USD MILLION)

TABLE 87 SOUTH AMERICA: AUGMENTED AND VIRTUAL REALITY IN EDUCATION MARKET, BY OFFERING, 2019–2027 (USD MILLION)

TABLE 88 SOUTH AMERICA: AUGMENTED AND VIRTUAL REALITY IN EDUCATION MARKET, BY DEPLOYMENT, 2019–2027 (USD MILLION)

TABLE 89 SOUTH AMERICA: AUGMENTED AND VIRTUAL REALITY IN EDUCATION MARKET, BY APPLICATION, 2019–2027 (USD MILLION)

TABLE 90 SOUTH AMERICA: AUGMENTED AND VIRTUAL REALITY IN EDUCATION MARKET, BY END USERS, 2019–2027 (USD MILLION)

TABLE 91 SOUTH AMERICA: AUGMENTED AND VIRTUAL REALITY IN EDUCATION MARKET, BY DEVICES, 2019–2027 (USD MILLION)

LIST OF FIGURES

FIGURE 1 MARKET SYNOPSIS

FIGURE 2 RESEARCH PROCESS OF MRFR

FIGURE 3 TOP-DOWN AND BOTTOM-UP APPROACHES

FIGURE 4 GLOBAL AUGMENTED AND VIRTUAL REALITY IN EDUCATION MARKET, BY OFFERING, 2019–2027 (USD MILLION)

FIGURE 5 GLOBAL AUGMENTED AND VIRTUAL REALITY IN EDUCATION MARKET, BY DEPLOYMENT, 2019–2027 (USD MILLION)

FIGURE 6 GLOBAL AUGMENTED AND VIRTUAL REALITY IN EDUCATION MARKET, BY APPLICATION, 2019–2027 (USD MILLION)

FIGURE 7 GLOBAL AUGMENTED AND VIRTUAL REALITY IN EDUCATION MARKET, BY REGION, 2019–2027 (USD MILLION)

FIGURE 8 NORTH AMERICA: AUGMENTED AND VIRTUAL REALITY IN EDUCATION MARKET, BY COUNTRY, 2019–2027 (USD MILLION)

FIGURE 9 NORTH AMERICA: AUGMENTED AND VIRTUAL REALITY IN EDUCATION MARKET, BY OFFERING, 2019–2027 (USD MILLION)

FIGURE 10 NORTH AMERICA: AUGMENTED AND VIRTUAL REALITY IN EDUCATION MARKET, BY DEPLOYMENT, 2019–2027 (USD MILLION)

FIGURE 11 NORTH AMERICA: AUGMENTED AND VIRTUAL REALITY IN EDUCATION MARKET, BY APPLICATION, 2019–2027 (USD MILLION)

FIGURE 12 EUROPE: AUGMENTED AND VIRTUAL REALITY IN EDUCATION MARKET, BY COUNTRY, 2019–2027 (USD MILLION)

FIGURE 13 EUROPE: AUGMENTED AND VIRTUAL REALITY IN EDUCATION MARKET, BY OFFERING, 2019–2027 (USD MILLION)

FIGURE 14 EUROPE: AUGMENTED AND VIRTUAL REALITY IN EDUCATION MARKET, BY DEPLOYMENT, 2019–2027 (USD MILLION)

FIGURE 15 EUROPE: AUGMENTED AND VIRTUAL REALITY IN EDUCATION MARKET, BY APPLICATION, 2019–2027 (USD MILLION)

FIGURE 16 ASIA-PACIFIC: AUGMENTED AND VIRTUAL REALITY IN EDUCATION MARKET, BY COUNTRY, 2019–2027 (USD MILLION)

FIGURE 17 ASIA-PACIFIC: AUGMENTED AND VIRTUAL REALITY IN EDUCATION MARKET, BY OFFERING, 2019–2027 (USD MILLION)

FIGURE 18 ASIA-PACIFIC: AUGMENTED AND VIRTUAL REALITY IN EDUCATION MARKET, BY DEPLOYMENT, 2019–2027 (USD MILLION)

FIGURE 19 ASIA-PACIFIC: AUGMENTED AND VIRTUAL REALITY IN EDUCATION MARKET, BY APPLICATION, 2019–2027 (USD MILLION)

FIGURE 20 MIDDLE EAST & AFRICA: AUGMENTED AND VIRTUAL REALITY IN EDUCATION MARKET, BY OFFERING, 2019–2027 (USD MILLION)

FIGURE 21 MIDDLE EAST & AFRICA: AUGMENTED AND VIRTUAL REALITY IN EDUCATION MARKET, BY DEVICES, 2019–2027 (USD MILLION)

FIGURE 22 MIDDLE EAST & AFRICA: AUGMENTED AND VIRTUAL REALITY IN EDUCATION MARKET, BY DEPLOYMENT, 2019–2027 (USD MILLION)

FIGURE 23 MIDDLE EAST & AFRICA: AUGMENTED AND VIRTUAL REALITY IN EDUCATION MARKET, BY APPLICATION, 2019–2027 (USD MILLION)

FIGURE 24 SOUTH AMERICA: AUGMENTED AND VIRTUAL REALITY IN EDUCATION MARKET, BY OFFERING, 2019–2027 (USD MILLION)

FIGURE 25 SOUTH AMERICA: AUGMENTED AND VIRTUAL REALITY IN EDUCATION MARKET, BY DEVICES, 2019–2027 (USD MILLION)

FIGURE 26 SOUTH AMERICA: AUGMENTED AND VIRTUAL REALITY IN EDUCATION MARKET, BY DEPLOYMENT, 2019–2027 (USD MILLION)

FIGURE 27 SOUTH AMERICA: AUGMENTED AND VIRTUAL REALITY IN EDUCATION MARKET, BY APPLICATION, 2019–2027 (USD MILLION)

Purchase Option
Single User $ 4,950
Multiuser License $ 5,950
Enterprise User $ 7,250
Compare Licenses
Tailored for You
  • Dedicated Research on any specifics segment or region.
  • Focused Research on specific players in the market.
  • Custom Report based only on your requirements.
  • Flexibility to add or subtract any chapter in the study.
  • Historic data from 2014 and forecasts outlook till 2040.
  • Flexibility of providing data/insights in formats (PDF, PPT, Excel).
  • Provide cross segmentation in applicable scenario/markets.