Applied AI in Energy & Utilities Market Segmentation
Applied AI in Energy & Utilities Market By Deployment Type (USD Million, 2025-2035)
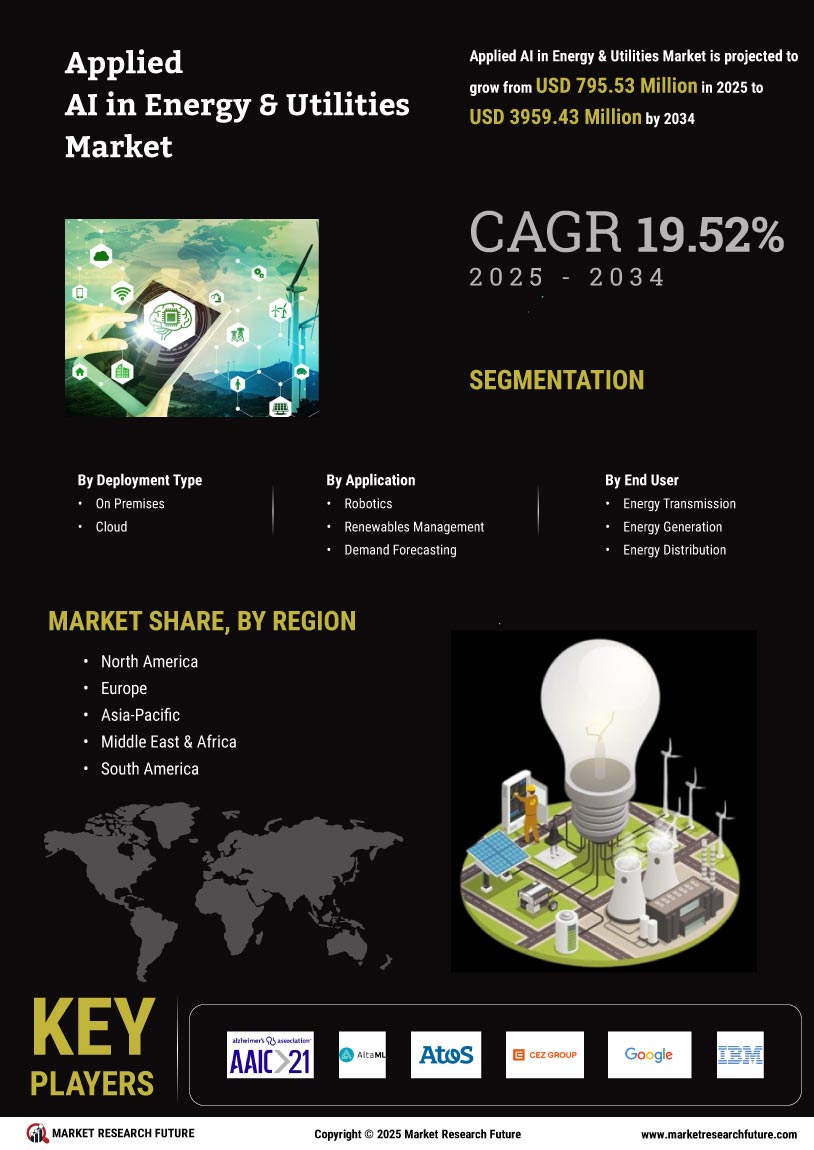
- On Premises
- Applied AI in Energy & Utilities Market
Applied AI in Energy & Utilities Market By Application (USD Million, 2025-2035)
- Robotics
- Renewables Management
- Demand Forecasting
- AI-Based Inventory Management
- Energy Production and Scheduling
- Asset Tracking and Maintenance
- Digital Twins
- AI-Based Cybersecurity
- Emission Tracking
- Logistics Network Optimizations
- Others
Applied AI in Energy & Utilities Market By End User (USD Million, 2025-2035)
- Energy Transmission
- Energy Generation
- Energy Distribution
- Utilities
- Wind Farms
- Others