Application Gateway Market Segmentation
Application Gateway Market By Component (USD Billion, 2025-2035)
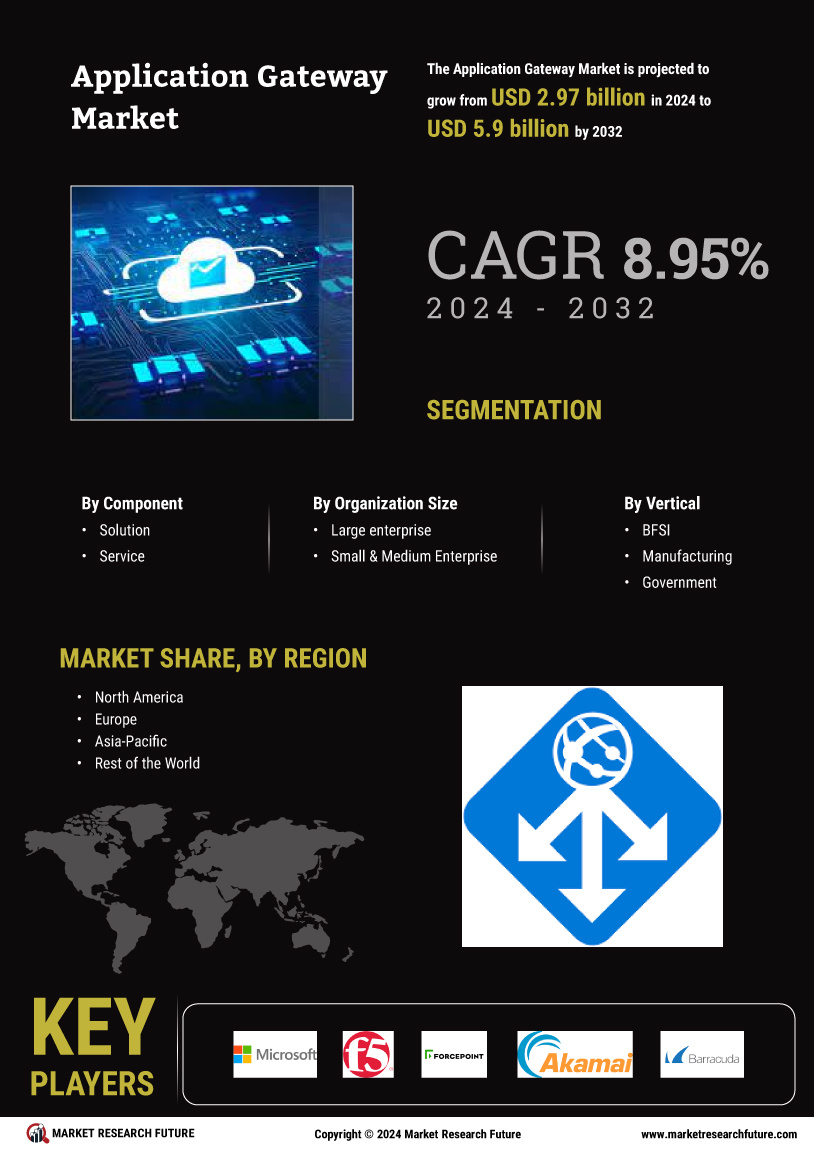
- Solution
- Service
Application Gateway Market By Organization Size (USD Billion, 2025-2035)
- Large Enterprise
- Small & Medium Enterprise
Application Gateway Market By Vertical (USD Billion, 2025-2035)
- BFSI
- Manufacturing
- Government
- IT & Telecommunication
- Retail
- Healthcare