APAC APAC Super Capacitor Market Segmentation
APAC Super Capacitor Market By Type (USD Million, 2025-2035)
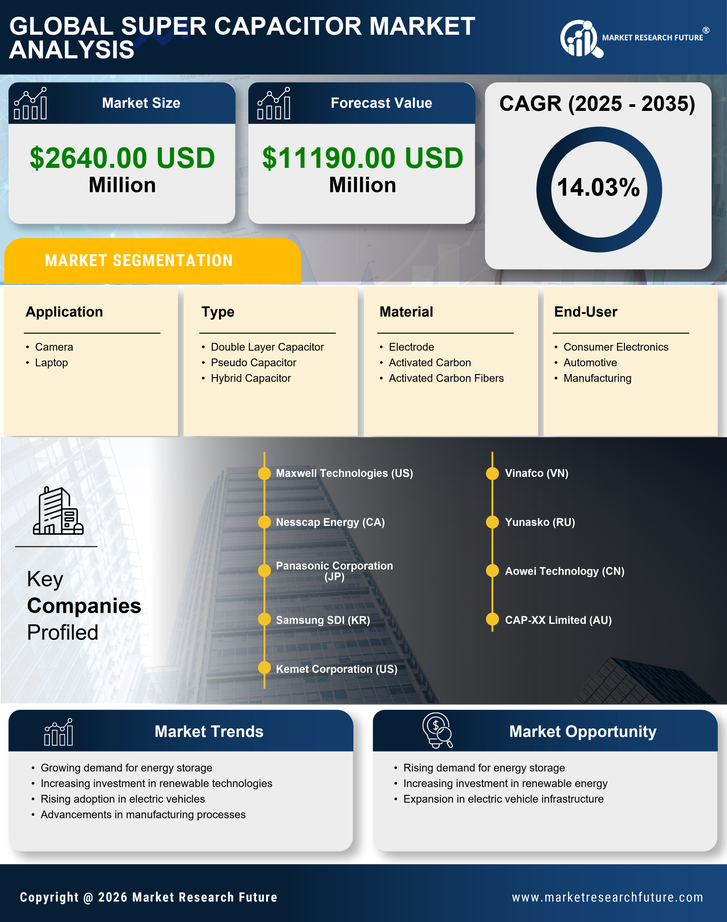
- Double Layer Capacitor
- Pseudo Capacitor
- Hybrid Capacitor
APAC Super Capacitor Market By Material (USD Million, 2025-2035)
- Electrode
- Activated Carbon
- Activated Carbon Fibers
APAC Super Capacitor Market By Application (USD Million, 2025-2035)
- Camera
- Laptop
APAC Super Capacitor Market By End-User (USD Million, 2025-2035)
- Consumer Electronics
- Automotive
- Manufacturing