APAC Data Governance Market

ID: MRFR/ICT/58257-HCR
200 Pages
Aarti Dhapte
Last Updated: February 06, 2026
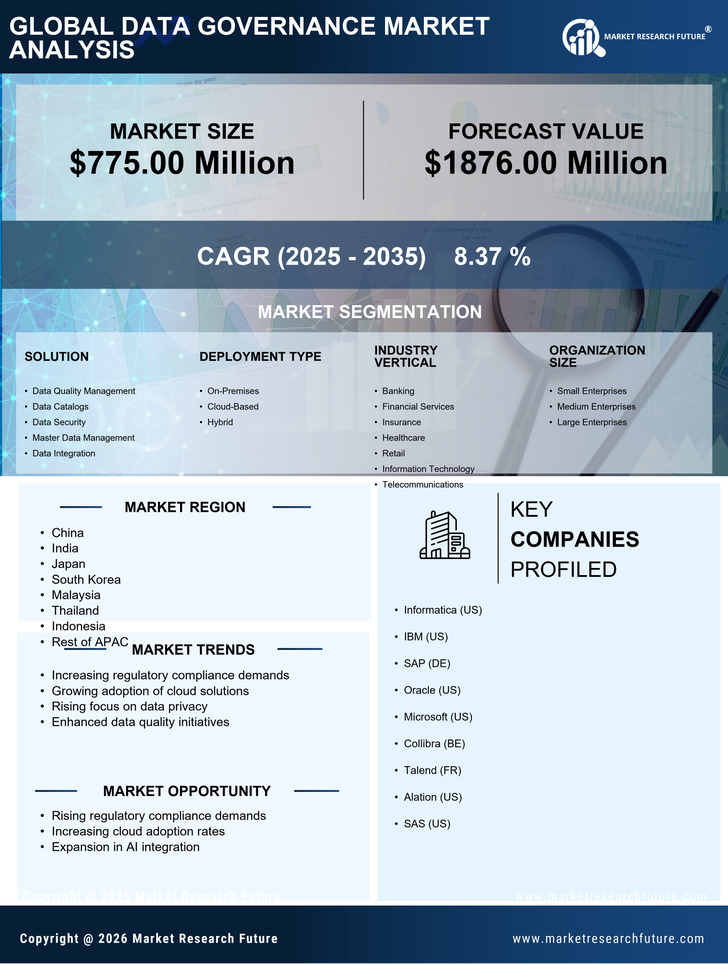
APAC Data Governance Market Research Report By Solution (Data Quality Management, Data Catalogs, Data Security, Master Data Management, Data Integration), By Deployment Type (On-Premises, Cloud-Based, Hybrid), By Industry Vertical (Banking, Financial Services, Insurance, Healthcare, Retail, Information Technology, Telecommunications), By Organization Size (Small Enterprises, Medium Enterprises, Large Enterprises) and By Regional (China, India, Japan, South Korea, Malaysia, Thailand, Indonesia, Rest of APAC) - Forecast to 2035
Download PDF ×

We do not share your information with anyone. However, we may send you emails based on your report interest from time to time. You may contact us at any time to opt-out.

APAC Data Governance Market

Market Size

Forecast Period2025 - 2035
CAGR (2025 - 2035)8.37%
2024 Market Size$ 775 Million
2025 Market Size$ 839.87 Million
2035 Market Size$ 1,876 Million

Key Players

Informatica
IBM
SAP
Oracle
Microsoft
Collibra
Opportunities
  • Rising Data Privacy Concerns
  • Adoption of Cloud Technologies
  • Emergence of Advanced Analytics
  1. 1 SECTION I: EXECUTIVE SUMMARY AND KEY HIGHLIGHTS
    1. 1.1 EXECUTIVE SUMMARY
      1. 1.1.1 Market Overview
      2. 1.1.2 Key Findings
      3. 1.1.3 Market Segmentation
      4. 1.1.4 Competitive Landscape
      5. 1.1.5 Challenges and Opportunities
      6. 1.1.6 Future Outlook
  2. 2 SECTION II: SCOPING, METHODOLOGY AND MARKET STRUCTURE
    1. 2.1 MARKET INTRODUCTION
      1. 2.1.1 Definition
      2. 2.1.2 Scope of the study
        1. 2.1.2.1 Research Objective
        2. 2.1.2.2 Assumption
        3. 2.1.2.3 Limitations
    2. 2.2 RESEARCH METHODOLOGY
      1. 2.2.1 Overview
      2. 2.2.2 Data Mining
      3. 2.2.3 Secondary Research
      4. 2.2.4 Primary Research
        1. 2.2.4.1 Primary Interviews and Information Gathering Process
        2. 2.2.4.2 Breakdown of Primary Respondents
      5. 2.2.5 Forecasting Model
      6. 2.2.6 Market Size Estimation
        1. 2.2.6.1 Bottom-Up Approach
        2. 2.2.6.2 Top-Down Approach
      7. 2.2.7 Data Triangulation
      8. 2.2.8 Validation
  3. 3 SECTION III: QUALITATIVE ANALYSIS
    1. 3.1 MARKET DYNAMICS
      1. 3.1.1 Overview
      2. 3.1.2 Drivers
      3. 3.1.3 Restraints
      4. 3.1.4 Opportunities
    2. 3.2 MARKET FACTOR ANALYSIS
      1. 3.2.1 Value chain Analysis
      2. 3.2.2 Porter's Five Forces Analysis
        1. 3.2.2.1 Bargaining Power of Suppliers
        2. 3.2.2.2 Bargaining Power of Buyers
        3. 3.2.2.3 Threat of New Entrants
        4. 3.2.2.4 Threat of Substitutes
        5. 3.2.2.5 Intensity of Rivalry
      3. 3.2.3 COVID-19 Impact Analysis
        1. 3.2.3.1 Market Impact Analysis
        2. 3.2.3.2 Regional Impact
        3. 3.2.3.3 Opportunity and Threat Analysis
  4. 4 SECTION IV: QUANTITATIVE ANALYSIS
    1. 4.1 Information and Communications Technology, BY Solution (USD Million)
      1. 4.1.1 Data Quality Management
      2. 4.1.2 Data Catalogs
      3. 4.1.3 Data Security
      4. 4.1.4 Master Data Management
      5. 4.1.5 Data Integration
    2. 4.2 Information and Communications Technology, BY Deployment Type (USD Million)
      1. 4.2.1 On-Premises
      2. 4.2.2 Cloud-Based
      3. 4.2.3 Hybrid
    3. 4.3 Information and Communications Technology, BY Industry Vertical (USD Million)
      1. 4.3.1 Banking
      2. 4.3.2 Financial Services
      3. 4.3.3 Insurance
      4. 4.3.4 Healthcare
      5. 4.3.5 Retail
      6. 4.3.6 Information Technology
      7. 4.3.7 Telecommunications
    4. 4.4 Information and Communications Technology, BY Organization Size (USD Million)
      1. 4.4.1 Small Enterprises
      2. 4.4.2 Medium Enterprises
      3. 4.4.3 Large Enterprises
  5. 5 SECTION V: COMPETITIVE ANALYSIS
    1. 5.1 Competitive Landscape
      1. 5.1.1 Overview
      2. 5.1.2 Competitive Analysis
      3. 5.1.3 Market share Analysis
      4. 5.1.4 Major Growth Strategy in the Information and Communications Technology
      5. 5.1.5 Competitive Benchmarking
      6. 5.1.6 Leading Players in Terms of Number of Developments in the Information and Communications Technology
      7. 5.1.7 Key developments and growth strategies
        1. 5.1.7.1 New Product Launch/Service Deployment
        2. 5.1.7.2 Merger & Acquisitions
        3. 5.1.7.3 Joint Ventures
      8. 5.1.8 Major Players Financial Matrix
        1. 5.1.8.1 Sales and Operating Income
        2. 5.1.8.2 Major Players R&D Expenditure. 2023
    2. 5.2 Company Profiles
      1. 5.2.1 Informatica (US)
        1. 5.2.1.1 Financial Overview
        2. 5.2.1.2 Products Offered
        3. 5.2.1.3 Key Developments
        4. 5.2.1.4 SWOT Analysis
        5. 5.2.1.5 Key Strategies
      2. 5.2.2 IBM (US)
        1. 5.2.2.1 Financial Overview
        2. 5.2.2.2 Products Offered
        3. 5.2.2.3 Key Developments
        4. 5.2.2.4 SWOT Analysis
        5. 5.2.2.5 Key Strategies
      3. 5.2.3 SAP (DE)
        1. 5.2.3.1 Financial Overview
        2. 5.2.3.2 Products Offered
        3. 5.2.3.3 Key Developments
        4. 5.2.3.4 SWOT Analysis
        5. 5.2.3.5 Key Strategies
      4. 5.2.4 Oracle (US)
        1. 5.2.4.1 Financial Overview
        2. 5.2.4.2 Products Offered
        3. 5.2.4.3 Key Developments
        4. 5.2.4.4 SWOT Analysis
        5. 5.2.4.5 Key Strategies
      5. 5.2.5 Microsoft (US)
        1. 5.2.5.1 Financial Overview
        2. 5.2.5.2 Products Offered
        3. 5.2.5.3 Key Developments
        4. 5.2.5.4 SWOT Analysis
        5. 5.2.5.5 Key Strategies
      6. 5.2.6 Collibra (BE)
        1. 5.2.6.1 Financial Overview
        2. 5.2.6.2 Products Offered
        3. 5.2.6.3 Key Developments
        4. 5.2.6.4 SWOT Analysis
        5. 5.2.6.5 Key Strategies
      7. 5.2.7 Talend (FR)
        1. 5.2.7.1 Financial Overview
        2. 5.2.7.2 Products Offered
        3. 5.2.7.3 Key Developments
        4. 5.2.7.4 SWOT Analysis
        5. 5.2.7.5 Key Strategies
      8. 5.2.8 Alation (US)
        1. 5.2.8.1 Financial Overview
        2. 5.2.8.2 Products Offered
        3. 5.2.8.3 Key Developments
        4. 5.2.8.4 SWOT Analysis
        5. 5.2.8.5 Key Strategies
      9. 5.2.9 SAS (US)
        1. 5.2.9.1 Financial Overview
        2. 5.2.9.2 Products Offered
        3. 5.2.9.3 Key Developments
        4. 5.2.9.4 SWOT Analysis
        5. 5.2.9.5 Key Strategies
    3. 5.3 Appendix
      1. 5.3.1 References
      2. 5.3.2 Related Reports
  6. 6 LIST OF FIGURES
    1. 6.1 MARKET SYNOPSIS
    2. 6.2 APAC MARKET ANALYSIS BY SOLUTION
    3. 6.3 APAC MARKET ANALYSIS BY DEPLOYMENT TYPE
    4. 6.4 APAC MARKET ANALYSIS BY INDUSTRY VERTICAL
    5. 6.5 APAC MARKET ANALYSIS BY ORGANIZATION SIZE
    6. 6.6 KEY BUYING CRITERIA OF INFORMATION AND COMMUNICATIONS TECHNOLOGY
    7. 6.7 RESEARCH PROCESS OF MRFR
    8. 6.8 DRO ANALYSIS OF INFORMATION AND COMMUNICATIONS TECHNOLOGY
    9. 6.9 DRIVERS IMPACT ANALYSIS: INFORMATION AND COMMUNICATIONS TECHNOLOGY
    10. 6.10 RESTRAINTS IMPACT ANALYSIS: INFORMATION AND COMMUNICATIONS TECHNOLOGY
    11. 6.11 SUPPLY / VALUE CHAIN: INFORMATION AND COMMUNICATIONS TECHNOLOGY
    12. 6.12 INFORMATION AND COMMUNICATIONS TECHNOLOGY, BY SOLUTION, 2024 (% SHARE)
    13. 6.13 INFORMATION AND COMMUNICATIONS TECHNOLOGY, BY SOLUTION, 2024 TO 2035 (USD Million)
    14. 6.14 INFORMATION AND COMMUNICATIONS TECHNOLOGY, BY DEPLOYMENT TYPE, 2024 (% SHARE)
    15. 6.15 INFORMATION AND COMMUNICATIONS TECHNOLOGY, BY DEPLOYMENT TYPE, 2024 TO 2035 (USD Million)
    16. 6.16 INFORMATION AND COMMUNICATIONS TECHNOLOGY, BY INDUSTRY VERTICAL, 2024 (% SHARE)
    17. 6.17 INFORMATION AND COMMUNICATIONS TECHNOLOGY, BY INDUSTRY VERTICAL, 2024 TO 2035 (USD Million)
    18. 6.18 INFORMATION AND COMMUNICATIONS TECHNOLOGY, BY ORGANIZATION SIZE, 2024 (% SHARE)
    19. 6.19 INFORMATION AND COMMUNICATIONS TECHNOLOGY, BY ORGANIZATION SIZE, 2024 TO 2035 (USD Million)
    20. 6.20 BENCHMARKING OF MAJOR COMPETITORS
  7. 7 LIST OF TABLES
    1. 7.1 LIST OF ASSUMPTIONS
  8. 7.1.1
    1. 7.2 APAC MARKET SIZE ESTIMATES; FORECAST
      1. 7.2.1 BY SOLUTION, 2025-2035 (USD Million)
      2. 7.2.2 BY DEPLOYMENT TYPE, 2025-2035 (USD Million)
      3. 7.2.3 BY INDUSTRY VERTICAL, 2025-2035 (USD Million)
      4. 7.2.4 BY ORGANIZATION SIZE, 2025-2035 (USD Million)
    2. 7.3 PRODUCT LAUNCH/PRODUCT DEVELOPMENT/APPROVAL
  9. 7.3.1
    1. 7.4 ACQUISITION/PARTNERSHIP
  10. 7.4.1

APAC APAC Data Governance Market Segmentation

APAC Data Governance Market By Solution (USD Million, 2025-2035)

  • Data Quality Management
  • Data Catalogs
  • Data Security
  • Master Data Management
  • Data Integration

APAC Data Governance Market By Deployment Type (USD Million, 2025-2035)

  • On-Premises
  • Cloud-Based
  • Hybrid

APAC Data Governance Market By Industry Vertical (USD Million, 2025-2035)

  • Banking
  • Financial Services
  • Insurance
  • Healthcare
  • Retail
  • Information Technology
  • Telecommunications

APAC Data Governance Market By Organization Size (USD Million, 2025-2035)

  • Small Enterprises
  • Medium Enterprises
  • Large Enterprises