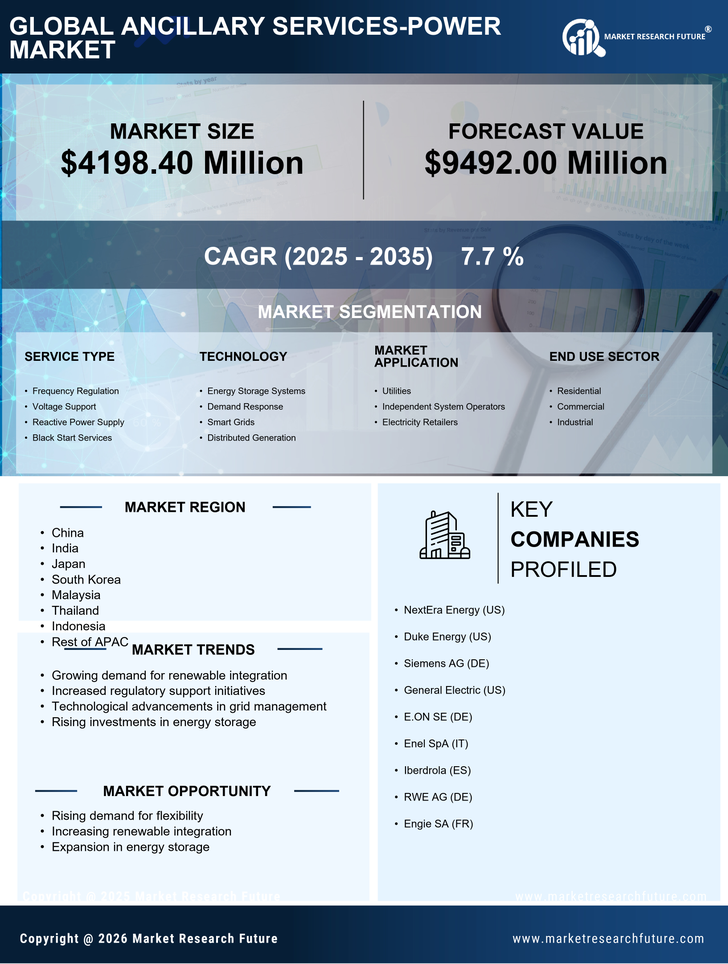
Request Free Sample ×

Kindly complete the form below to receive a free sample of this Report

* Please use a valid business email

Leading companies partner with us for data-driven Insights

clients tt-cursor
Hero Background

APAC Ancillary Services Power Market

ID: MRFR/EnP/53493-HCR
200 Pages
Chitranshi Jaiswal
Last Updated: February 06, 2026

APAC Ancillary Services Power Market Research Report By Service Type (Frequency Regulation, Voltage Support, Reactive Power Supply, Black Start Services), By Technology (Energy Storage Systems, Demand Response, Smart Grids, Distributed Generation), By Market Application (Utilities, Independent System Operators, Electricity Retailers), By End Use Sector (Residential, Commercial, Industrial) and By Regional (China, India, Japan, South Korea, Malaysia, Thailand, Indonesia, Rest of APAC)-Forecast to 2035

Share:
Download PDF ×

We do not share your information with anyone. However, we may send you emails based on your report interest from time to time. You may contact us at any time to opt-out.

APAC Ancillary Services Power Market Infographic
Purchase Options
  1. 1 SECTION I: EXECUTIVE SUMMARY AND KEY HIGHLIGHTS
    1. 1.1 EXECUTIVE SUMMARY
      1. 1.1.1 Market Overview
      2. 1.1.2 Key Findings
      3. 1.1.3 Market Segmentation
      4. 1.1.4 Competitive Landscape
      5. 1.1.5 Challenges and Opportunities
      6. 1.1.6 Future Outlook
  2. 2 SECTION II: SCOPING, METHODOLOGY AND MARKET STRUCTURE
    1. 2.1 MARKET INTRODUCTION
      1. 2.1.1 Definition
      2. 2.1.2 Scope of the study
        1. 2.1.2.1 Research Objective
        2. 2.1.2.2 Assumption
        3. 2.1.2.3 Limitations
    2. 2.2 RESEARCH METHODOLOGY
      1. 2.2.1 Overview
      2. 2.2.2 Data Mining
      3. 2.2.3 Secondary Research
      4. 2.2.4 Primary Research
        1. 2.2.4.1 Primary Interviews and Information Gathering Process
        2. 2.2.4.2 Breakdown of Primary Respondents
      5. 2.2.5 Forecasting Model
      6. 2.2.6 Market Size Estimation
        1. 2.2.6.1 Bottom-Up Approach
        2. 2.2.6.2 Top-Down Approach
      7. 2.2.7 Data Triangulation
      8. 2.2.8 Validation
  3. 3 SECTION III: QUALITATIVE ANALYSIS
    1. 3.1 MARKET DYNAMICS
      1. 3.1.1 Overview
      2. 3.1.2 Drivers
      3. 3.1.3 Restraints
      4. 3.1.4 Opportunities
    2. 3.2 MARKET FACTOR ANALYSIS
      1. 3.2.1 Value chain Analysis
      2. 3.2.2 Porter's Five Forces Analysis
        1. 3.2.2.1 Bargaining Power of Suppliers
        2. 3.2.2.2 Bargaining Power of Buyers
        3. 3.2.2.3 Threat of New Entrants
        4. 3.2.2.4 Threat of Substitutes
        5. 3.2.2.5 Intensity of Rivalry
      3. 3.2.3 COVID-19 Impact Analysis
        1. 3.2.3.1 Market Impact Analysis
        2. 3.2.3.2 Regional Impact
        3. 3.2.3.3 Opportunity and Threat Analysis
  4. 4 SECTION IV: QUANTITATIVE ANALYSIS
    1. 4.1 Energy & Power, BY Service Type (USD Billion)
      1. 4.1.1 Frequency Regulation
      2. 4.1.2 Voltage Control
      3. 4.1.3 Reserve Services
      4. 4.1.4 Black Start Services
      5. 4.1.5 Load Following
    2. 4.2 Energy & Power, BY Market Structure (USD Billion)
      1. 4.2.1 Regulated Market
      2. 4.2.2 Deregulated Market
      3. 4.2.3 Hybrid Market
    3. 4.3 Energy & Power, BY Technology Type (USD Billion)
      1. 4.3.1 Battery Energy Storage System
      2. 4.3.2 Flywheel Energy Storage System
      3. 4.3.3 Pumped Hydro Storage
      4. 4.3.4 Demand Response
      5. 4.3.5 Synchronous Condenser
    4. 4.4 Energy & Power, BY End User (USD Billion)
      1. 4.4.1 Utilities
      2. 4.4.2 Independent Power Producers
      3. 4.4.3 Commercial Users
      4. 4.4.4 Industrial Users
    5. 4.5 Energy & Power, BY Operational Scale (USD Billion)
      1. 4.5.1 Centralized Services
      2. 4.5.2 Decentralized Services
      3. 4.5.3 Distributed Services
  5. 5 SECTION V: COMPETITIVE ANALYSIS
    1. 5.1 Competitive Landscape
      1. 5.1.1 Overview
      2. 5.1.2 Competitive Analysis
      3. 5.1.3 Market share Analysis
      4. 5.1.4 Major Growth Strategy in the Energy & Power
      5. 5.1.5 Competitive Benchmarking
      6. 5.1.6 Leading Players in Terms of Number of Developments in the Energy & Power
      7. 5.1.7 Key developments and growth strategies
        1. 5.1.7.1 New Product Launch/Service Deployment
        2. 5.1.7.2 Merger & Acquisitions
        3. 5.1.7.3 Joint Ventures
      8. 5.1.8 Major Players Financial Matrix
        1. 5.1.8.1 Sales and Operating Income
        2. 5.1.8.2 Major Players R&D Expenditure. 2023
    2. 5.2 Company Profiles
      1. 5.2.1 Toshiba (JP)
        1. 5.2.1.1 Financial Overview
        2. 5.2.1.2 Products Offered
        3. 5.2.1.3 Key Developments
        4. 5.2.1.4 SWOT Analysis
        5. 5.2.1.5 Key Strategies
      2. 5.2.2 Siemens (DE)
        1. 5.2.2.1 Financial Overview
        2. 5.2.2.2 Products Offered
        3. 5.2.2.3 Key Developments
        4. 5.2.2.4 SWOT Analysis
        5. 5.2.2.5 Key Strategies
      3. 5.2.3 General Electric (US)
        1. 5.2.3.1 Financial Overview
        2. 5.2.3.2 Products Offered
        3. 5.2.3.3 Key Developments
        4. 5.2.3.4 SWOT Analysis
        5. 5.2.3.5 Key Strategies
      4. 5.2.4 Mitsubishi Electric (JP)
        1. 5.2.4.1 Financial Overview
        2. 5.2.4.2 Products Offered
        3. 5.2.4.3 Key Developments
        4. 5.2.4.4 SWOT Analysis
        5. 5.2.4.5 Key Strategies
      5. 5.2.5 Schneider Electric (FR)
        1. 5.2.5.1 Financial Overview
        2. 5.2.5.2 Products Offered
        3. 5.2.5.3 Key Developments
        4. 5.2.5.4 SWOT Analysis
        5. 5.2.5.5 Key Strategies
      6. 5.2.6 Hitachi (JP)
        1. 5.2.6.1 Financial Overview
        2. 5.2.6.2 Products Offered
        3. 5.2.6.3 Key Developments
        4. 5.2.6.4 SWOT Analysis
        5. 5.2.6.5 Key Strategies
      7. 5.2.7 ABB (CH)
        1. 5.2.7.1 Financial Overview
        2. 5.2.7.2 Products Offered
        3. 5.2.7.3 Key Developments
        4. 5.2.7.4 SWOT Analysis
        5. 5.2.7.5 Key Strategies
      8. 5.2.8 Eaton (IE)
        1. 5.2.8.1 Financial Overview
        2. 5.2.8.2 Products Offered
        3. 5.2.8.3 Key Developments
        4. 5.2.8.4 SWOT Analysis
        5. 5.2.8.5 Key Strategies
      9. 5.2.9 Samsung C&T (KR)
        1. 5.2.9.1 Financial Overview
        2. 5.2.9.2 Products Offered
        3. 5.2.9.3 Key Developments
        4. 5.2.9.4 SWOT Analysis
        5. 5.2.9.5 Key Strategies
    3. 5.3 Appendix
      1. 5.3.1 References
      2. 5.3.2 Related Reports
  6. 6 LIST OF FIGURES
    1. 6.1 MARKET SYNOPSIS
    2. 6.2 APAC MARKET ANALYSIS BY SERVICE TYPE
    3. 6.3 APAC MARKET ANALYSIS BY MARKET STRUCTURE
    4. 6.4 APAC MARKET ANALYSIS BY TECHNOLOGY TYPE
    5. 6.5 APAC MARKET ANALYSIS BY END USER
    6. 6.6 APAC MARKET ANALYSIS BY OPERATIONAL SCALE
    7. 6.7 KEY BUYING CRITERIA OF ENERGY & POWER
    8. 6.8 RESEARCH PROCESS OF MRFR
    9. 6.9 DRO ANALYSIS OF ENERGY & POWER
    10. 6.10 DRIVERS IMPACT ANALYSIS: ENERGY & POWER
    11. 6.11 RESTRAINTS IMPACT ANALYSIS: ENERGY & POWER
    12. 6.12 SUPPLY / VALUE CHAIN: ENERGY & POWER
    13. 6.13 ENERGY & POWER, BY SERVICE TYPE, 2024 (% SHARE)
    14. 6.14 ENERGY & POWER, BY SERVICE TYPE, 2024 TO 2035 (USD Billion)
    15. 6.15 ENERGY & POWER, BY MARKET STRUCTURE, 2024 (% SHARE)
    16. 6.16 ENERGY & POWER, BY MARKET STRUCTURE, 2024 TO 2035 (USD Billion)
    17. 6.17 ENERGY & POWER, BY TECHNOLOGY TYPE, 2024 (% SHARE)
    18. 6.18 ENERGY & POWER, BY TECHNOLOGY TYPE, 2024 TO 2035 (USD Billion)
    19. 6.19 ENERGY & POWER, BY END USER, 2024 (% SHARE)
    20. 6.20 ENERGY & POWER, BY END USER, 2024 TO 2035 (USD Billion)
    21. 6.21 ENERGY & POWER, BY OPERATIONAL SCALE, 2024 (% SHARE)
    22. 6.22 ENERGY & POWER, BY OPERATIONAL SCALE, 2024 TO 2035 (USD Billion)
    23. 6.23 BENCHMARKING OF MAJOR COMPETITORS
  7. 7 LIST OF TABLES
    1. 7.1 LIST OF ASSUMPTIONS
  8. 7.1.1
    1. 7.2 APAC MARKET SIZE ESTIMATES; FORECAST
      1. 7.2.1 BY SERVICE TYPE, 2026-2035 (USD Billion)
      2. 7.2.2 BY MARKET STRUCTURE, 2026-2035 (USD Billion)
      3. 7.2.3 BY TECHNOLOGY TYPE, 2026-2035 (USD Billion)
      4. 7.2.4 BY END USER, 2026-2035 (USD Billion)
      5. 7.2.5 BY OPERATIONAL SCALE, 2026-2035 (USD Billion)
    2. 7.3 PRODUCT LAUNCH/PRODUCT DEVELOPMENT/APPROVAL
  9. 7.3.1
    1. 7.4 ACQUISITION/PARTNERSHIP
  10. 7.4.1

APAC Energy & Power Market Segmentation

Energy & Power By Service Type (USD Billion, 2022-2035)

  • Frequency Regulation
  • Voltage Control
  • Reserve Services
  • Black Start Services
  • Load Following

Energy & Power By Market Structure (USD Billion, 2022-2035)

  • Regulated Market
  • Deregulated Market
  • Hybrid Market

Energy & Power By Technology Type (USD Billion, 2022-2035)

  • Battery Energy Storage System
  • Flywheel Energy Storage System
  • Pumped Hydro Storage
  • Demand Response
  • Synchronous Condenser

Energy & Power By End User (USD Billion, 2022-2035)

  • Utilities
  • Independent Power Producers
  • Commercial Users
  • Industrial Users

Energy & Power By Operational Scale (USD Billion, 2022-2035)

  • Centralized Services
  • Decentralized Services
  • Distributed Services

Compare Licence

×
Features License Type
Single User Multiuser License Enterprise User
Price $4,950 $5,950 $7,250
Maximum User Access Limit 1 User Upto 10 Users Unrestricted Access Throughout the Organization
Free Customization
Direct Access to Analyst
Deliverable Format
Platform Access
Discount on Next Purchase 10% 15% 15%
Printable Versions