Antibody Drug Conjugate Market (2026 - 2035)

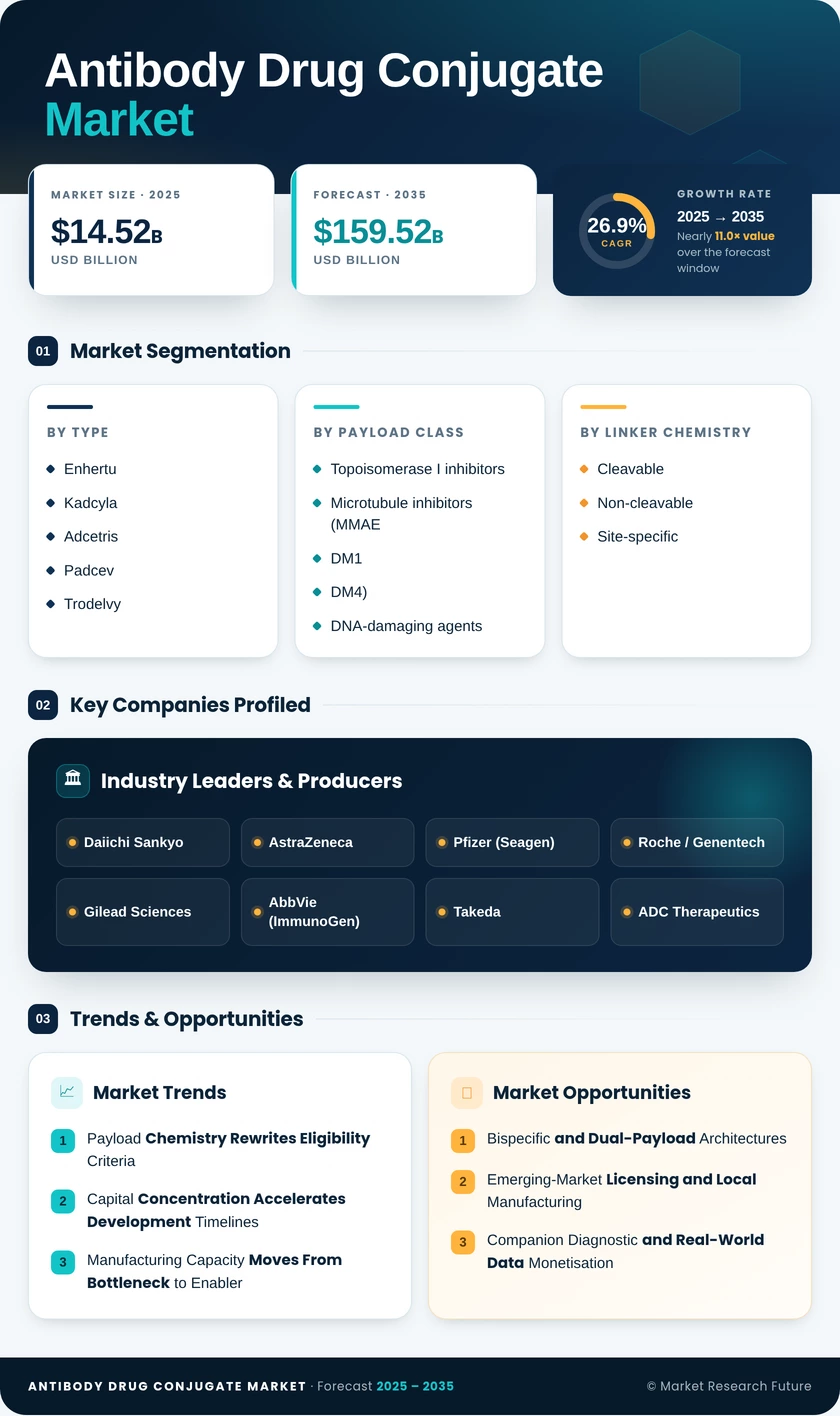
Antibody Drug Conjugate Market Research Report: Size, Share, Trend Analysis By Types (Cytotoxic Drug Conjugates, Immunomodulatory Drug Conjugates, Radiolabeled Drug Conjugates, Dual Action Drug Conjugates), By Therapeutic Area (Oncology, Autoimmune Diseases, Infectious Diseases, Neurological Disorders), By Mechanism of Action (Targeted Delivery, Cell Cycle Disruption, Immune Modulation, Antibody-Dependent Cellular Cytotoxicity), By Route of Administration (Intravenous, Subcutaneous, Intramuscular) and By Regional (North America, Europe, South America, Asia Pacific, Middle East and Africa) - Growth Outlook & Industry Forecast Till 2035

Forecast Period
2026-2035
CAGR
26.9%
2025 Market Size
USD 14.52 Billion
2035 Market Size
USD 159.52 Billion
Healthcare ● Updated August 2026 Report ID: MRFR/HC/0607-HCR | Pages: 200 | Author: Nidhi Mandole, Rahul Gotadki
  1. 1 Market Summary |
    1. 1.1 Study Assumptions & Market Definition |
    2. 1.2 Scope of the Study |
    3. 1.3 Research Methodology
  2. 2 Key Report Takeaways |
    1. 2.1 By Product and Payload |
    2. 2.2 By Application and End User |
    3. 2.3 By Geography
  3. 3 Market Size & Forecast (2021–2035) |
    1. 3.1 Historical Market Size (2021–2025) |
    2. 3.2 Current & Forecast Market Size (2026–2035) |
    3. 3.3 Year-over-Year Growth Analysis
  4. 4 Driver Impact Analysis |
    1. 4.1 Payload Chemistry Rewrites Eligibility Criteria |
    2. 4.2 Capital Concentration Accelerates Development Timelines |
    3. 4.3 Manufacturing Capacity Moves From Bottleneck to Enabler |
    4. 4.4 Reimbursement Architecture Rewards Outpatient Delivery
  5. 5 Restraints Impact Analysis |
    1. 5.1 Toxicity Profiles Constrain Duration of Therapy |
    2. 5.2 Manufacturing Complexity Limits Launch Velocity |
    3. 5.3 Health Technology Assessment Slows European Uptake
  6. 6 Opportunities |
    1. 6.1 Bispecific and Dual-Payload Architectures |
    2. 6.2 Emerging-Market Licensing and Local Manufacturing |
    3. 6.3 Companion Diagnostic and Real-World Data Monetisation |
    4. 6.4 Subcutaneous and Fixed-Dose Reformulation |
    5. 6.5 Non-Oncology Indication Expansion
  7. 7 Regional Market Share & Country-Level Analysis |
    1. 7.1 North America | |
      1. 7.1.1 US | |
      2. 7.1.2 Canada | |
      3. 7.1.3 Mexico |
    2. 7.2 Europe | |
      1. 7.2.1 Germany | |
      2. 7.2.2 UK | |
      3. 7.2.3 France | |
      4. 7.2.4 Italy | |
      5. 7.2.5 Spain | |
      6. 7.2.6 Nordic Countries | |
      7. 7.2.7 Russia | |
      8. 7.2.8 Rest of Europe |
    3. 7.3 Asia-Pacific | |
      1. 7.3.1 China | |
      2. 7.3.2 India | |
      3. 7.3.3 Japan | |
      4. 7.3.4 South Korea | |
      5. 7.3.5 ASEAN | |
      6. 7.3.6 Rest of Asia-Pacific |
    4. 7.4 South America | |
      1. 7.4.1 Brazil | |
      2. 7.4.2 Argentina | |
      3. 7.4.3 Rest of South America |
    5. 7.5 Middle East & Africa | |
      1. 7.5.1 Saudi Arabia | |
      2. 7.5.2 UAE | |
      3. 7.5.3 South Africa | |
      4. 7.5.4 Egypt | |
      5. 7.5.5 Rest of Middle East & Africa
  8. 8 Future Outlook (2026–2035) |
    1. 8.1 Computational Design Compresses Discovery Cycles |
    2. 8.2 Platform Licensing Becomes the Dominant Economic Model |
    3. 8.3 Resistance Management Shapes Sequencing Strategy |
    4. 8.4 Supply Chain Regionalisation Under Biosecurity Policy
  9. 9 Market Segmentation Analysis |
    1. 9.1 By Product | |
      1. 9.1.1 Enhertu | |
      2. 9.1.2 Kadcyla | |
      3. 9.1.3 Adcetris | |
      4. 9.1.4 Padcev | |
      5. 9.1.5 Trodelvy | |
      6. 9.1.6 Polivy | |
      7. 9.1.7 Other and Emerging Assets |
    2. 9.2 By Payload Class | |
      1. 9.2.1 Topoisomerase I Inhibitors | |
      2. 9.2.2 Microtubule Inhibitors (MMAE, DM1, DM4) | |
      3. 9.2.3 DNA-Damaging Agents | |
      4. 9.2.4 Immunomodulatory and Other Payloads |
    3. 9.3 By Linker Chemistry | |
      1. 9.3.1 Cleavable | |
      2. 9.3.2 Non-Cleavable | |
      3. 9.3.3 Site-Specific |
    4. 9.4 By Application | |
      1. 9.4.1 Hematologic Cancers | |
      2. 9.4.2 Breast | |
      3. 9.4.3 Urothelial | |
      4. 9.4.4 Lung | |
      5. 9.4.5 Other Solid Tumours |
    5. 9.5 By End User | |
      1. 9.5.1 Hospitals | |
      2. 9.5.2 Specialty Cancer Centres | |
      3. 9.5.3 Biopharma and CRO Partnerships | |
      4. 9.5.4 Ambulatory and Other Settings
  10. 10 Competitive Landscape |
    1. 10.1 Market Concentration Analysis (2026) |
    2. 10.2 Competitive Benchmarking Matrix |
    3. 10.3 Company Profiles | |
      1. 10.3.1 Daiichi Sankyo | |
      2. 10.3.2 AstraZeneca | |
      3. 10.3.3 Pfizer (Seagen) | |
      4. 10.3.4 Roche / Genentech | |
      5. 10.3.5 Gilead Sciences | |
      6. 10.3.6 AbbVie (ImmunoGen) | |
      7. 10.3.7 Takeda | |
      8. 10.3.8 ADC Therapeutics | |
      9. 10.3.9 RemeGen | |
      10. 10.3.10 Zai Lab | |
      11. 10.3.11 Merck & Co. | |
      12. 10.3.12 Sichuan Kelun-Biotech
  11. 11 Recent News & Developments
  12. 12 Report Scope & Methodology |
    1. 12.1 Study Period & Base Year |
    2. 12.2 Valuation Currency & Assumptions |
    3. 12.3 Abbreviations
  13. 13 Detailed Sources & Citations
  14. 14 Frequently Asked Questions
  15. 15 LIST OF TABLES |
  16. TABLE 1 Global Antibody Drug Conjugate Market Size & Forecast, by Revenue (USD Billion), 2021–2035 |
  17. TABLE 2 Global Antibody Drug Conjugate Market — Year-over-Year Growth Analysis, 2021–2035 |
  18. TABLE 3 Driver Impact Analysis Matrix, 2026–2035 |
  19. TABLE 4 Restraint Impact Analysis Matrix, 2026–2035 |
  20. TABLE 5 Global Market Size, by Region, 2021–2035 (USD Billion) |
  21. TABLE 6 North America Market Size, by Country, 2021–2035 (USD Billion) |
  22. TABLE 7 Europe Market Size, by Country, 2021–2035 (USD Billion) |
  23. TABLE 8 Asia-Pacific Market Size, by Country, 2021–2035 (USD Billion) |
  24. TABLE 9 South America Market Size, by Country, 2021–2035 (USD Billion) |
  25. TABLE 10 Middle East & Africa Market Size, by Country, 2021–2035 (USD Billion) |
  26. TABLE 11 Global Market Size, by Product, 2021–2035 (USD Billion) |
  27. TABLE 12 Global Market Size, by Payload Class, 2021–2035 (USD Billion) |
  28. TABLE 13 Global Market Size, by Linker Chemistry, 2021–2035 (USD Billion) |
  29. TABLE 14 Global Market Size, by Application, 2021–2035 (USD Billion) |
  30. TABLE 15 Global Market Size, by End User, 2021–2035 (USD Billion) |
  31. TABLE 16 North America Market Size, by Product and Payload Class, 2021–2035 (USD Billion) |
  32. TABLE 17 Europe Market Size, by Application and End User, 2021–2035 (USD Billion) |
  33. TABLE 18 Asia-Pacific Market Size, by Linker Chemistry, 2021–2035 (USD Billion) |
  34. TABLE 19 Competitive Benchmarking Matrix, 2026 |
  35. TABLE 20 Company Profiles — Key Players |
  36. TABLE 21 Recent Developments & Strategic Announcements, 2023–2025 |
  37. TABLE 22 Report Scope & Methodology Summary |
  38. TABLE 23 Detailed Sources & Citations Index
  39. 16 LIST OF FIGURES |
  40. FIGURE 1 Market Dynamics — Drivers, Restraints, Opportunities and Challenges |
  41. FIGURE 2 Industry Value Chain Analysis — Antibody Sourcing to Clinical Administration |
  42. FIGURE 3 Porter's Five Forces Analysis |
  43. FIGURE 4 Global Market Size Trend and Forecast Curve, 2021–2035 (USD Billion) |
  44. FIGURE 5 Year-over-Year Growth Trajectory, 2022–2035 (%) |
  45. FIGURE 6 Revenue Share by Product, 2025 vs 2035 (%) |
  46. FIGURE 7 Revenue Share by Payload Class, 2025 (%) |
  47. FIGURE 8 Revenue Share by Linker Chemistry, 2025 (%) |
  48. FIGURE 9 Revenue Share by Application, 2025 (%) |
  49. FIGURE 10 Revenue Share by End User, 2025 (%) |
  50. FIGURE 11 Regional Revenue Share Distribution, 2025 (%) |
  51. FIGURE 12 Regional CAGR Comparison, 2026–2035 (%) |
  52. FIGURE 13 Country-Level Contribution Heat Map, 2025 |
  53. FIGURE 14 Competitive Landscape — Estimated Revenue Share Bands, 2026 |
  54. FIGURE 15 Strategic Positioning Quadrant — Pipeline Depth vs Commercial Reach |
  55. FIGURE 16 Clinical Pipeline Distribution by Development Phase, 2025
Share::
Request Free Sample

Segmentation Quick Reference

DimensionSub-SegmentsDominant SegmentFastest Growing Segment
By ProductAdcetris, Kadcyla, Padcev, Enhertu, Trodelvy, Polivy, Other and Emerging AssetsEnhertuOther and Emerging Assets
By Payload ClassMicrotubule Inhibitors, DNA-Damaging Agents, Topoisomerase I Inhibitors, Immunomodulatory and Other PayloadsTopoisomerase I InhibitorsMicrotubule Inhibitors
By Linker ChemistryCleavable, Non-Cleavable, Site-SpecificCleavableSite-Specific
By ApplicationBreast, Hematologic, Urothelial, Lung, Other Solid TumoursHematologicUrothelial
By End UserHospitals, Specialty Cancer Centres, Biopharma and CRO Partnerships, Ambulatory and Other SettingsHospitalsBiopharma and CRO Partnerships
By GeographyNorth America, Europe, Asia-Pacific, South America, Middle East & AfricaNorth AmericaAsia-Pacific


Market Segmentation Overview

By Product

Sub-SegmentKey Trend
AdcetrisFrontline Hodgkin lymphoma combination regimens sustain volume against approaching patent milestones
KadcylaAdjuvant residual-disease positioning holds steady share despite newer HER2 entrants
PadcevCheckpoint-combination approval reset first-line urothelial standard of care
EnhertuSequential label expansion across HER2-positive, low, and ultralow disease drives franchise economics
TrodelvyTROP2 targeting extends reach into HR-positive breast and lung indications
PolivyFrontline DLBCL data displaces long-standing R-CHOP regimens
Other and Emerging AssetsAccelerated approvals in gynaecologic, gastric, and lung cancers broaden the base


Product-level economics increasingly follow label breadth rather than launch order. Assets able to demonstrate efficacy across antigen-expression gradients capture disproportionate revenue because they convert previously ineligible patients into treatable ones.

By Payload Class

Sub-SegmentKey Trend
Microtubule InhibitorsMature safety databases and familiar manufacturing keep this class commercially durable
DNA-Damaging AgentsPotency advantages concentrate use in refractory hematologic settings
Topoisomerase I InhibitorsBystander effect enables efficacy across low-antigen tumour phenotypes
Immunomodulatory and Other PayloadsEarly-stage combinations with checkpoint blockade target immune-cold tumours


Payload selection now precedes antibody selection in most discovery programmes. Sponsors optimise for therapeutic index and bystander behaviour first, then screen antibody candidates against the chosen chemistry.

By Linker Chemistry

Sub-SegmentKey Trend
CleavableProtease- and pH-sensitive designs remain the volume default across approved assets
Non-CleavableLower systemic release supports use where off-target toxicity is the binding constraint
Site-SpecificHomogeneous drug-antibody ratio attracts premium licensing and faster CMC review


Linker design has become the primary differentiator among otherwise similar constructs. Platform owners increasingly monetise chemistry through royalties rather than carrying commercial infrastructure themselves.

By Application

Sub-SegmentKey Trend
BreastHER2-low reclassification enlarged the eligible cohort by more than half
HematologicValidated CD30, CD19, and CD79b targets underpin the largest revenue pool
UrothelialCombination with checkpoint inhibition delivered the strongest survival readout to date
LungTROP2 and HER3 candidates in late-stage trials position this as the next major expansion
Other Solid TumoursGynaecologic and gastric approvals extend the modality beyond established niches


Application mix is migrating from hematologic toward solid tumours as payload chemistry improves tumour penetration. That shift raises the ceiling considerably given solid-tumour incidence volumes.

By End User

Sub-SegmentKey Trend
HospitalsInfusion infrastructure and toxicity monitoring capability concentrate administration here
Specialty Cancer CentresTrial participation and biomarker testing depth support earlier adoption of new assets
Biopharma and CRO PartnershipsOutsourced conjugation and analytical services grow fastest as pipelines expand
Ambulatory and Other SettingsSubcutaneous reformulation will progressively shift lower-acuity administration outward


End-user distribution will change more in the next decade than it has in the last. Reformulation and improved safety profiles both push administration toward lower-cost settings.

By Geography

Sub-SegmentKey Trend
North AmericaOutpatient reimbursement design and domestic manufacturing sustain leadership
EuropeCentralised approval paired with fragmented national pricing creates uneven access timing
Asia-PacificDomestic origination and out-licensing economics deliver the fastest regional growth
South AmericaPublic-private access divergence concentrates early volume in supplementary insurance
Middle East & AfricaSovereign healthcare investment builds specialty capacity ahead of demand


Regional trajectories diverge on infrastructure rather than epidemiology. Where pathology capacity and infusion reimbursement exist together, adoption follows quickly; where either is missing, approval alone changes little.




Share::
Request Free Sample
Download PDF ×

We do not share your information with anyone. However, we may send you emails based on your report interest from time to time. You may contact us at any time to opt-out.