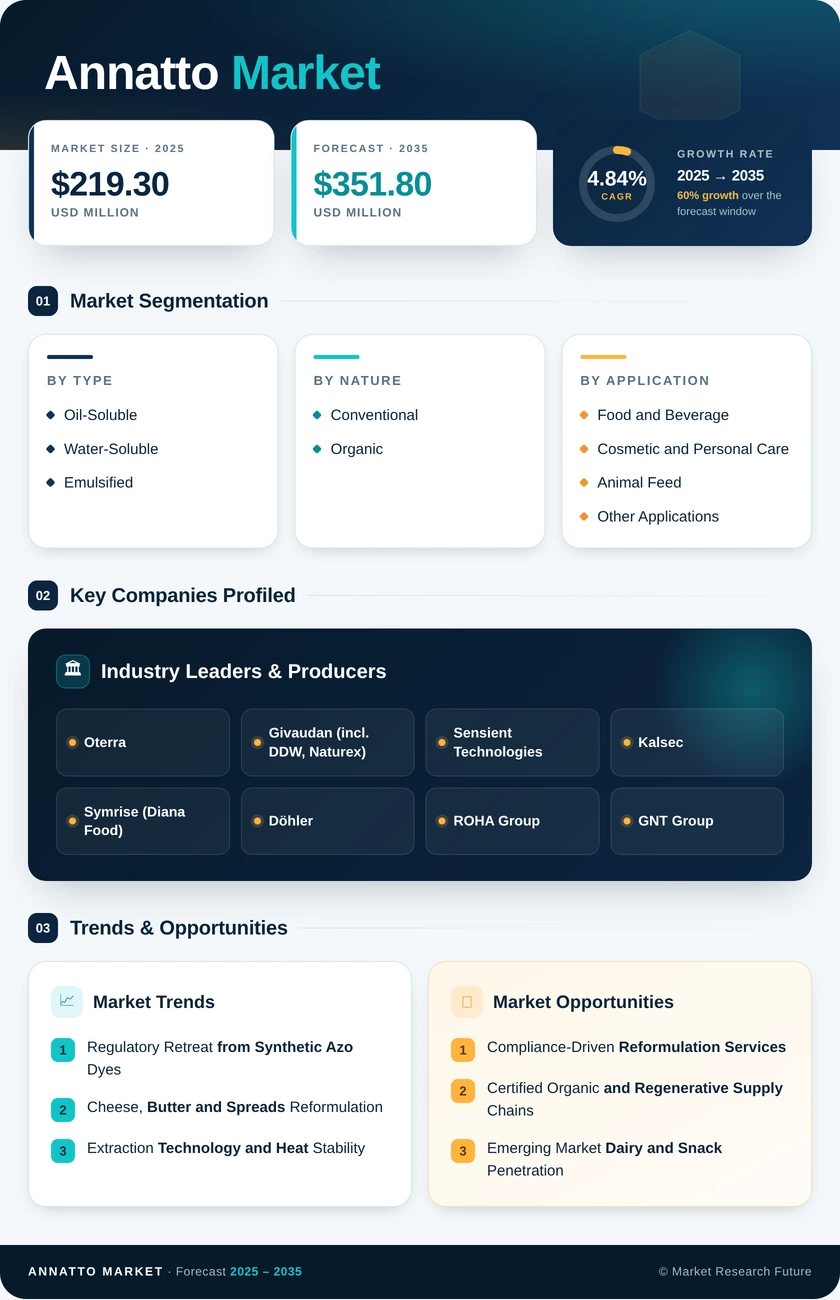
Annatto Market (2026 - 2035)

Annatto Market Size, Share, Industry Trend & Analysis Research Report By Product Type (Oil-Soluble, Water-Soluble, Emulsified), By Nature (Organic, Conventional), By Application (Food and Beverage, Cosmetic and Personal Care, Animal Feed, Other Applications), By Region (North America, Europe, Asia-Pacific, South America, Middle East and Africa) - Forecast to 2035

Forecast Period
2026-2035
CAGR
4.84%
2025 Market Size
USD 219.3 Million
2035 Market Size
USD 351.8 Million
Food, Beverages & Nutrition ● Updated August 2026 Report ID: MRFR/FnB/24532-HCR | Pages: 128 | Author: Snehal Singh
  1. 1 Market Overview |
    1. 1.1 Study Assumptions & Market Definition |
    2. 1.2 Scope of the Study |
    3. 1.3 Research Methodology
  2. 2 Market Summary & Key Takeaways |
    1. 2.1 Key Findings by Product Type |
    2. 2.2 Key Findings by Nature |
    3. 2.3 Key Findings by Application |
    4. 2.4 Key Findings by Region
  3. 3 Global Market Size & Forecast (2021–2035) |
    1. 3.1 Historical Market Size (2021–2025) |
    2. 3.2 Current & Forecast Market Size (2026–2035) |
    3. 3.3 Market Size by Revenue (USD Million) |
    4. 3.4 Year-over-Year Growth Analysis
  4. 4 Market Drivers Analysis |
    1. 4.1 Regulatory Retreat from Synthetic Azo Dyes |
    2. 4.2 Cheese, Butter and Spreads Reformulation |
    3. 4.3 Extraction Technology and Heat Stability |
    4. 4.4 Plant-Based and Alternative Protein Systems
  5. 5 Market Restraints Analysis |
    1. 5.1 Origin Concentration and Price Volatility |
    2. 5.2 Formulation Limits in Clear Beverages |
    3. 5.3 Cost Positioning Against Synthetic Alternatives
  6. 6 Market Opportunity Analysis |
    1. 6.1 Compliance-Driven Reformulation Services |
    2. 6.2 Certified Organic and Regenerative Supply Chains |
    3. 6.3 Emerging Market Dairy and Snack Penetration |
    4. 6.4 Colour Cosmetics and Personal Care Crossover |
    5. 6.5 Traceability Data as a Commercial Product |
    6. 6.6 Industry Value Chain Analysis |
    7. 6.7 Porter's Five Forces Analysis
  7. 7 Regional Analysis |
    1. 7.1 North America | |
      1. 7.1.1 US | |
      2. 7.1.2 Canada | |
      3. 7.1.3 Mexico |
    2. 7.2 Europe | |
      1. 7.2.1 Germany | |
      2. 7.2.2 UK | |
      3. 7.2.3 France | |
      4. 7.2.4 Italy | |
      5. 7.2.5 Spain | |
      6. 7.2.6 Nordic Countries | |
      7. 7.2.7 Russia | |
      8. 7.2.8 Rest of Europe |
    3. 7.3 Asia-Pacific | |
      1. 7.3.1 China | |
      2. 7.3.2 India | |
      3. 7.3.3 Japan | |
      4. 7.3.4 South Korea | |
      5. 7.3.5 ASEAN | |
      6. 7.3.6 Rest of Asia-Pacific |
    4. 7.4 South America | |
      1. 7.4.1 Brazil | |
      2. 7.4.2 Argentina | |
      3. 7.4.3 Rest of South America |
    5. 7.5 Middle East & Africa | |
      1. 7.5.1 Saudi Arabia | |
      2. 7.5.2 UAE | |
      3. 7.5.3 South Africa | |
      4. 7.5.4 Egypt | |
      5. 7.5.5 Rest of Middle East & Africa
  8. 8 Future Outlook & Strategic Recommendations (2026–2035) |
    1. 8.1 Precision Extraction Becomes Table Stakes |
    2. 8.2 Traceable Agronomy and Yield Improvement |
    3. 8.3 The Reformulation Supercycle Peaks and Normalises |
    4. 8.4 Sustainability Disclosure Reshapes Supplier Selection
  9. 9 Segmentation Analysis |
    1. 9.1 By Product Type | |
      1. 9.1.1 Oil-Soluble | |
      2. 9.1.2 Water-Soluble | |
      3. 9.1.3 Emulsified |
    2. 9.2 By Nature | |
      1. 9.2.1 Organic | |
      2. 9.2.2 Conventional |
    3. 9.3 By Application | |
      1. 9.3.1 Food and Beverage | |
      2. 9.3.2 Cosmetic and Personal Care | |
      3. 9.3.3 Animal Feed | |
      4. 9.3.4 Other Applications
  10. 10 Competitive Landscape |
    1. 10.1 Market Share Analysis (2026) |
    2. 10.2 Competitive Benchmarking Matrix |
    3. 10.3 Company Profiles | |
      1. 10.3.1 Oterra | |
      2. 10.3.2 Givaudan | |
      3. 10.3.3 Sensient Technologies | |
      4. 10.3.4 Kalsec | |
      5. 10.3.5 Symrise | |
      6. 10.3.6 Döhler | |
      7. 10.3.7 ROHA Group | |
      8. 10.3.8 GNT Group | |
      9. 10.3.9 Vinayak Ingredients | |
      10. 10.3.10 Kancor Ingredients | |
      11. 10.3.11 BioconColors | |
      12. 10.3.12 San-Ei Gen F.F.I.
  11. 11 Recent Developments & News
  12. 12 Report Scope & Methodology |
    1. 12.1 Study Period & Base Year |
    2. 12.2 Data Sources & Citations |
    3. 12.3 Abbreviations
  13. 13 Detailed Sources & Citations
  14. 14 Frequently Asked Questions
  15. 15 LIST OF TABLES |
  16. TABLE 1 Global Annatto Market Size & Forecast, by Revenue (USD Million), 2021–2035 |
  17. TABLE 2 Global Annatto Market – Year-over-Year Growth Analysis, 2021–2035 |
  18. TABLE 3 Driver Impact Analysis – Global Annatto Market, 2026–2035 |
  19. TABLE 4 Restraint Impact Analysis – Global Annatto Market, 2026–2035 |
  20. TABLE 5 Global Annatto Market Size, by Product Type, 2021–2035 (USD Million) |
  21. TABLE 6 Global Annatto Market Size, by Nature, 2021–2035 (USD Million) |
  22. TABLE 7 Global Annatto Market Size, by Application, 2021–2035 (USD Million) |
  23. TABLE 8 Global Annatto Market Size, by Region, 2021–2035 (USD Million) |
  24. TABLE 9 North America Annatto Market Size, by Country, 2021–2035 (USD Million) |
  25. TABLE 10 Europe Annatto Market Size, by Country, 2021–2035 (USD Million) |
  26. TABLE 11 Asia-Pacific Annatto Market Size, by Country, 2021–2035 (USD Million) |
  27. TABLE 12 South America Annatto Market Size, by Country, 2021–2035 (USD Million) |
  28. TABLE 13 Middle East & Africa Annatto Market Size, by Country, 2021–2035 (USD Million) |
  29. TABLE 14 North America Annatto Market Size, by Product Type, 2021–2035 (USD Million) |
  30. TABLE 15 North America Annatto Market Size, by Nature, 2021–2035 (USD Million) |
  31. TABLE 16 North America Annatto Market Size, by Application, 2021–2035 (USD Million) |
  32. TABLE 17 Europe Annatto Market Size, by Product Type, 2021–2035 (USD Million) |
  33. TABLE 18 Europe Annatto Market Size, by Nature, 2021–2035 (USD Million) |
  34. TABLE 19 Europe Annatto Market Size, by Application, 2021–2035 (USD Million) |
  35. TABLE 20 Asia-Pacific Annatto Market Size, by Product Type, 2021–2035 (USD Million) |
  36. TABLE 21 Asia-Pacific Annatto Market Size, by Nature, 2021–2035 (USD Million) |
  37. TABLE 22 Asia-Pacific Annatto Market Size, by Application, 2021–2035 (USD Million) |
  38. TABLE 23 South America Annatto Market Size, by Product Type, 2021–2035 (USD Million) |
  39. TABLE 24 South America Annatto Market Size, by Nature, 2021–2035 (USD Million) |
  40. TABLE 25 South America Annatto Market Size, by Application, 2021–2035 (USD Million) |
  41. TABLE 26 Middle East & Africa Annatto Market Size, by Product Type, 2021–2035 (USD Million) |
  42. TABLE 27 Middle East & Africa Annatto Market Size, by Nature, 2021–2035 (USD Million) |
  43. TABLE 28 Middle East & Africa Annatto Market Size, by Application, 2021–2035 (USD Million) |
  44. TABLE 29 US Annatto Market Size, by Application, 2021–2035 (USD Million) |
  45. TABLE 30 China Annatto Market Size, by Application, 2021–2035 (USD Million) |
  46. TABLE 31 India Annatto Market Size, by Application, 2021–2035 (USD Million) |
  47. TABLE 32 Brazil Annatto Market Size, by Application, 2021–2035 (USD Million) |
  48. TABLE 33 Competitive Benchmarking Matrix – Global Annatto Market, 2026 |
  49. TABLE 34 Company Profiles – Key Players, Global Annatto Market |
  50. TABLE 35 Recent Developments & Strategic Announcements, 2023–2025 |
  51. TABLE 36 Report Scope & Methodology Summary |
  52. TABLE 37 Detailed Sources & Citations Index
  53. 16 LIST OF FIGURES |
  54. FIGURE 1 Global Annatto Market – Market Dynamics Overview (Drivers, Restraints, Opportunities) |
  55. FIGURE 2 Global Annatto Market – Industry Value Chain Analysis |
  56. FIGURE 3 Global Annatto Market – Porter's Five Forces Analysis |
  57. FIGURE 4 Global Annatto Market Size Trend, 2021–2035 (USD Million) |
  58. FIGURE 5 Global Annatto Market – Year-over-Year Growth Trend, 2022–2035 |
  59. FIGURE 6 Global Annatto Market Share, by Product Type, 2025 vs 2035 (%) |
  60. FIGURE 7 Global Annatto Market Share, by Nature, 2025 vs 2035 (%) |
  61. FIGURE 8 Global Annatto Market Share, by Application, 2025 vs 2035 (%) |
  62. FIGURE 9 Global Annatto Market Share, by Region, 2025 (%) |
  63. FIGURE 10 Regional CAGR Comparison, 2026–2035 (%) |
  64. FIGURE 11 North America Annatto Market – Country Share Breakdown, 2025 (%) |
  65. FIGURE 12 Europe Annatto Market – Country Share Breakdown, 2025 (%) |
  66. FIGURE 13 Asia-Pacific Annatto Market – Country Share Breakdown, 2025 (%) |
  67. FIGURE 14 Competitive Landscape – Estimated Revenue Share Positioning, 2026 |
  68. FIGURE 15 Competitive Positioning Matrix – Capability vs Geographic Reach |
  69. FIGURE 16 Bixa orellana Seed Price Index and Extract Cost Pass-Through, 2021–2025 |
  70. FIGURE 17 Regulatory Timeline – Synthetic Colour Restrictions, 2023–2028
Share::
Request Free Sample

Segmentation Quick Reference

DimensionSub-SegmentsDominant SegmentFastest Growing Segment
By Product TypeOil-Soluble, Water-Soluble, EmulsifiedOil-SolubleEmulsified
By NatureOrganic, ConventionalConventionalOrganic
By ApplicationFood and Beverage, Cosmetic and Personal Care, Animal Feed, Other ApplicationsFood and BeverageCosmetic and Personal Care
By RegionNorth America, Europe, Asia-Pacific, South America, Middle East and AfricaNorth AmericaAsia-Pacific


Market Segmentation Overview

By Product Type

Sub-SegmentKey Trend
Oil-SolubleEntrenched in cheese, butter and margarine; benefits from standard-of-identity permissions
Water-SolubleNorbixin salts serve brines, coatings and surface applications; constrained by acid instability
EmulsifiedFastest expansion as low-fat, hybrid and plant-based matrices require carrier systems


Product-type demand is splitting between a stable volume core and a high-growth specialty tier. Oil-soluble grades will continue to supply the majority of tonnage through 2035, but incremental revenue increasingly accrues to emulsified dispersions engineered for matrices that neither pure oil nor pure water systems can serve.

By Nature

Sub-SegmentKey Trend
ConventionalCost-efficient and widely available; remains the volume backbone across all regions
OrganicSupply-constrained with 25–40% price premium; three-year seed transition limits near-term availability


Nature-based segmentation is effectively a supply-chain question. Conventional material meets present demand comfortably, while organic growth is capped by certified acreage rather than by buyer appetite, making forward contracting the decisive commercial variable through 2029.

By Application

Sub-SegmentKey Trend
Food and BeverageDairy reformulation and synthetic dye replacement drive the bulk of incremental volume
Cosmetic and Personal CareHighest unit pricing; bixin adoption in lip, bronzer, and cream formats accelerates
Animal FeedPoultry pigmentation competes directly with synthetic canthaxanthin on cost
Other ApplicationsPharmaceutical coatings and natural textile dyeing form a small but rising niche


Application mix shifts modestly rather than dramatically. Food and beverage retains roughly three-quarters of revenue throughout the forecast, but cosmetics contributes a disproportionate share of margin expansion as premium-grade specifications gain traction across Asia-Pacific and Europe.

By Region

Sub-SegmentKey Trend
North AmericaRegulatory-driven conversion following federal and state synthetic dye restrictions
EuropeMature penetration with settled E 160b specifications; organic certification differentiates
Asia-PacificSteepest growth on processed dairy expansion and cosmetic pigment adoption
South AmericaOrigin advantage shifting from raw seed export toward standardised extract processing
Middle East & AfricaHalal-compliant colour positioning plus upstream seed supply from East and West Africa


Regional performance correlates with regulatory posture more than with per-capita income. Regions that restricted synthetic colours early show high penetration and moderate growth, while permissive regimes retain substantial headroom that converts as multinational brand standards propagate.




Share::
Request Free Sample
Download PDF ×

We do not share your information with anyone. However, we may send you emails based on your report interest from time to time. You may contact us at any time to opt-out.