Aesthetic Lasers Market (2026 - 2035)

ID: MRFR/HC/10858-HCR 200 Pages Vikita Thakur Last Updated: September 23, 2026
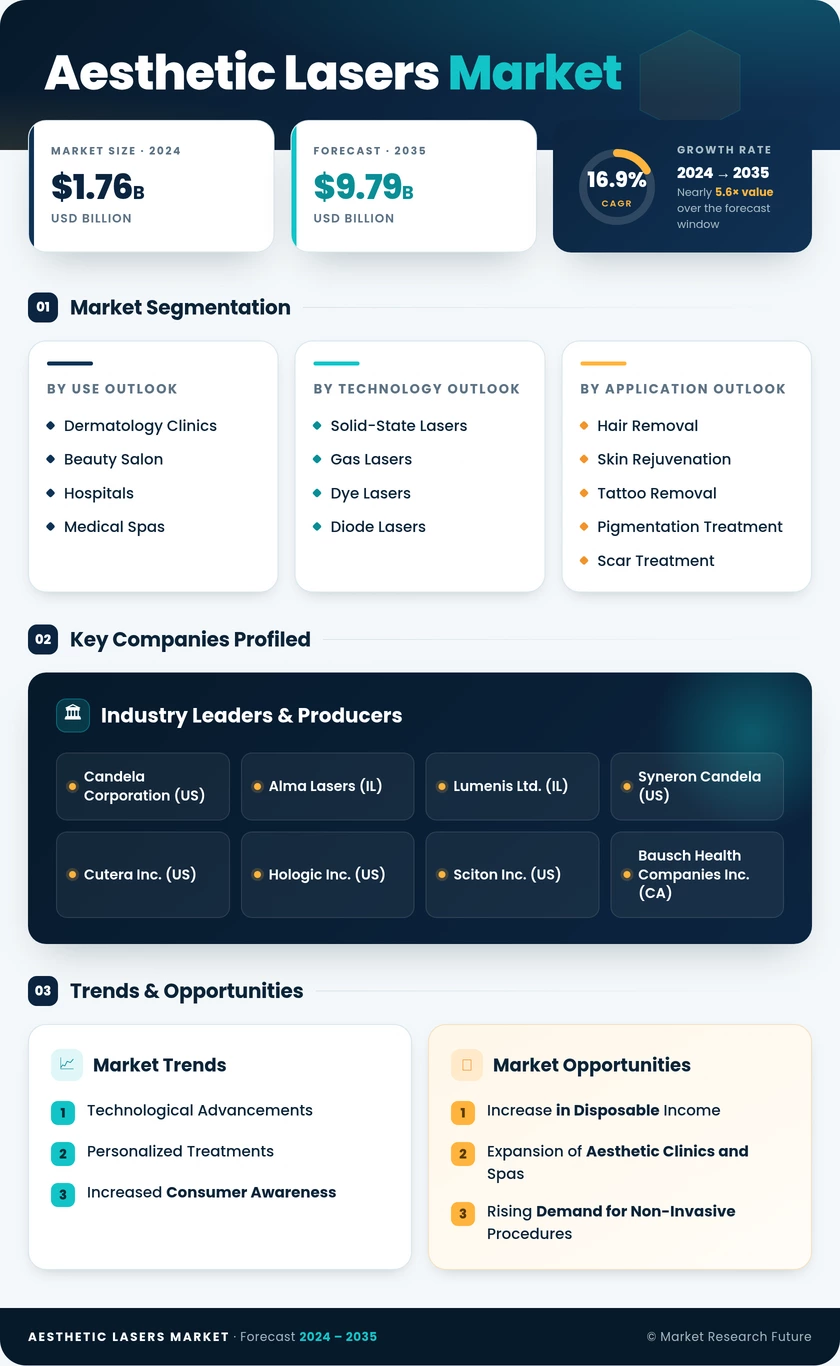
Aesthetic Lasers Market Research Report By Application (Hair Removal, Skin Rejuvenation, Tattoo Removal, Pigmentation Treatment, Scar Treatment), By Technology (Solid-State Lasers, Gas Lasers, Dye Lasers, Diode Lasers), By End Use (Dermatology Clinics, Beauty Salon, Hospitals, Medical Spas), By Product Type (Alexandrite Laser, Nd:YAG Laser, Diode Laser, CO2 Laser) and By Regional (North America, Europe, South America, Asia Pacific, Middle East and Africa) - Growth & Industry Forecast 2025 To 2035
Aesthetic Lasers Market
Market Size
Forecast Period2026-2035
CAGR (2026-2035)9.6%
2025 Market SizeUSD 3.40 Billion
2035 Market SizeUSD 8.51 Billion
Key Players
Candela Corporation
Lumenis Be Ltd.
Cutera, Inc.
Alma Lasers
Bausch Health / Solta Medical
Cynosure Lutronic
Opportunities
  • Emerging-Market Clinic Financing Programmes
  • Consumable and Applicator Recurring Revenue
  • Outcome Analytics and Data Monetisation
  1. 1 Market Summary | |
    1. 1.1 Study Assumptions & Market Definition | |
    2. 1.2 Scope of the Study | |
    3. 1.3 Research Methodology | |
  2. 2 Key Report Takeaways | |
    1. 2.1 By Type | |
    2. 2.2 By Modality | |
    3. 2.3 By Portability | |
    4. 2.4 By Application | |
    5. 2.5 By End User | |
    6. 2.6 By Region | |
  3. 3 Market Size and Forecast (2021–2035) | |
    1. 3.1 Historical Market Size (2021–2024) | |
    2. 3.2 Base Year Estimate (2025) | |
    3. 3.3 Forecast Market Size (2026–2035) | |
    4. 3.4 Year-over-Year Growth Analysis | |
  4. 4 Driver Impact Analysis | |
    1. 4.1 Rising Minimally Invasive Procedure Volumes | |
    2. 4.2 Medical Spa and Non-Traditional Channel Expansion | |
    3. 4.3 Multiplatform Console Consolidation | |
    4. 4.4 Asia-Pacific Medical Tourism and Clinic Buildout | |
    5. 4.5 Male Patient Adoption and Demographic Broadening | |
    6. 4.6 Equipment Leasing and Subscription Financing | |
    7. 4.7 Expanded On-Label Regulatory Clearances | |
  5. 5 Restraints Impact Analysis | |
    1. 5.1 Capital Intensity and Clinic Payback Pressure | |
    2. 5.2 Medical Device Regulation Recertification Burden | |
    3. 5.3 Substitution by Injectables and Alternative Modalities | |
    4. 5.4 Adverse-Event Risk and Operator Credentialing Gaps | |
    5. 5.5 Gray-Market and Uncertified Refurbished Circulation | |
  6. 6 Opportunities | |
    1. 6.1 Emerging-Market Clinic Financing Programmes | |
    2. 6.2 Consumable and Applicator Recurring Revenue | |
    3. 6.3 Outcome Analytics and Data Monetisation | |
    4. 6.4 Mobile and Satellite Treatment Channels | |
    5. 6.5 Skin-of-Colour Indication Expansion | |
  7. 7 Regional Market Share and Country-Level Analysis | |
    1. 7.1 North America | | |
      1. 7.1.1 United States | |
    2. 7.2 Europe | |
    3. 7.3 Asia-Pacific | |
    4. 7.4 South America | |
    5. 7.5 Middle East & Africa | |
  8. 8 Future Outlook (2026–2035) | |
    1. 8.1 Algorithmic Treatment Planning | |
    2. 8.2 Platform Economics and Device-as-a-Service | |
    3. 8.3 Energy Efficiency and Sustainability Reporting | |
    4. 8.4 Demographic Widening and Protocol Standardisation | |
  9. 9 Segmentation Analysis | |
    1. 9.1 By Type | | |
      1. 9.1.1 Ablative Lasers | | |
      2. 9.1.2 Non-Ablative Lasers | |
    2. 9.2 By Modality | | |
      1. 9.2.1 Standalone Laser Systems | | |
      2. 9.2.2 Multiplatform Laser Systems | |
    3. 9.3 By Portability | | |
      1. 9.3.1 Non-Portable | | |
      2. 9.3.2 Portable | |
    4. 9.4 By Application | | |
      1. 9.4.1 Skin Resurfacing & Rejuvenation | | |
      2. 9.4.2 Hair Removal | | |
      3. 9.4.3 Body Sculpting & Skin Tightening | |
    5. 9.5 By End User | | |
      1. 9.5.1 Hospitals | | |
      2. 9.5.2 Ambulatory Surgical Centers | | |
      3. 9.5.3 Dermatology and Aesthetic Clinics | | |
      4. 9.5.4 Medical Spas | |
  10. 10 Competitive Landscape | |
    1. 10.1 Market Concentration Analysis (2026) | |
    2. 10.2 Competitive Benchmarking Matrix | |
    3. 10.3 Company Profiles | |
  11. 11 Recent News & Developments | |
  12. 12 Report Scope and Methodology | |
  13. 13 Detailed Sources and Citations | |
  14. 14 Frequently Asked Questions (FAQs) | | LIST OF TABLES | |
  15. TABLE 1 Global Aesthetic Lasers Market Size & Forecast, by Revenue (USD billion), 2021–2035 | |
  16. TABLE 2 Global Aesthetic Lasers Market – Year-over-Year Growth Analysis, 2021–2035 | |
  17. TABLE 3 Driver Impact Analysis – Impact on CAGR, Geographic Relevance and Timeline | |
  18. TABLE 4 Restraint Impact Analysis – Impact on CAGR, Geographic Relevance and Timeline | |
  19. TABLE 5 Global Market Size, by Region, 2021–2035 (USD billion) | |
  20. TABLE 6 North America Market Size, by Country, 2021–2035 (USD billion) | |
  21. TABLE 7 Europe Market Size and Growth Analysis, 2021–2035 (USD billion) | |
  22. TABLE 8 Asia-Pacific Market Size and Growth Analysis, 2021–2035 (USD billion) | |
  23. TABLE 9 South America Market Size and Growth Analysis, 2021–2035 (USD billion) | |
  24. TABLE 10 Middle East & Africa Market Size and Growth Analysis, 2021–2035 (USD billion) | |
  25. TABLE 11 Global Market Size, by Type, 2021–2035 (USD billion) | |
  26. TABLE 12 Global Market Size, by Modality, 2021–2035 (USD billion) | |
  27. TABLE 13 Global Market Size, by Portability, 2021–2035 (USD billion) | |
  28. TABLE 14 Global Market Size, by Application, 2021–2035 (USD billion) | |
  29. TABLE 15 Global Market Size, by End User, 2021–2035 (USD billion) | |
  30. TABLE 16 Competitive Benchmarking Matrix – Global Aesthetic Lasers Market, 2026 | |
  31. TABLE 17 Company Profiles – Key Players, Global Aesthetic Lasers Market | |
  32. TABLE 18 Recent Developments & Strategic Announcements, 2023–2025 | |
  33. TABLE 19 Report Scope & Methodology Summary | |
  34. TABLE 20 Detailed Sources and Citations Index | | LIST OF FIGURES | |
  35. FIGURE 1 Market Dynamics – Drivers, Restraints and Opportunities Framework | |
  36. FIGURE 2 Industry Value Chain Analysis – Aesthetic Lasers | |
  37. FIGURE 3 Porter's Five Forces Analysis | |
  38. FIGURE 4 Global Market Size Trend and Forecast, 2021–2035 (USD billion) | |
  39. FIGURE 5 Year-over-Year Growth Trajectory, 2022–2035 (%) | |
  40. FIGURE 6 Market Share by Type, 2025 (%) | |
  41. FIGURE 7 Market Share by Modality, 2025 (%) | |
  42. FIGURE 8 Market Share by Portability, 2025 (%) | |
  43. FIGURE 9 Market Share by Application, 2025 (%) | |
  44. FIGURE 10 Market Share by End User, 2025 (%) | |
  45. FIGURE 11 Regional Market Share Distribution, 2025 (%) | |
  46. FIGURE 12 Regional CAGR Comparison, 2026–2035 (%) | |
  47. FIGURE 13 Competitive Landscape – Estimated Revenue Share Bands, 2026 | |
  48. FIGURE 14 Strategic Positioning Map – Key Manufacturers

Segmentation Quick Reference

DimensionSub-SegmentsDominant SegmentFastest Growing Segment
By TypeAblative Lasers; Non-Ablative LasersNon-Ablative Lasers (60.5% share, 2025)Ablative Lasers (10.4% CAGR, 2026–2035)
By ModalityStandalone Laser Systems; Multiplatform Laser SystemsStandalone Laser Systems (66.9% share, 2025)Multiplatform Laser Systems (12.2% CAGR, 2026–2035)
By PortabilityNon-Portable; PortableNon-Portable (74.5% share, 2025)Portable (10.7% CAGR, 2026–2035)
By ApplicationSkin Resurfacing & Rejuvenation; Hair Removal; Body Sculpting & Skin TighteningHair Removal (35.2% share, 2025)Body Sculpting & Skin Tightening (12.1% CAGR, 2026–2035)
By End UserHospitals; Ambulatory Surgical Centers; Dermatology and Aesthetic Clinics; Medical SpasDermatology and Aesthetic Clinics (41.7% share, 2025)Medical Spas (12.8% CAGR, 2026–2035)
By RegionNorth America; Europe; Asia-Pacific; South America; Middle East & AfricaNorth America (38.4% share, 2025)Asia-Pacific (12.4% CAGR, 2026–2035)


Market Segmentation Overview

By Type

Sub-SegmentKey Trend
Ablative LasersFractionated delivery restores resurfacing depth while compressing recovery to days
Non-Ablative LasersCumulative multi-session protocols marketed on zero social downtime


Non-Ablative Lasers lead the dimension at 60.5% of 2025 value because patients weigh recovery time as heavily as result magnitude, and clinics have built package pricing around repeat visits rather than single dramatic sessions. Ablative Lasers grow faster at 10.4% CAGR, driven by fractionated Carbon Dioxide (CO₂) Laser configurations that concentrate thermal injury in microcolumns and leave intervening tissue intact. Practices increasingly buy both and sequence them across a treatment course, which is why neither architecture is displacing the other.

By Modality

Sub-SegmentKey Trend
Standalone Laser SystemsUncompromised optical performance for high-volume single-indication practices
Multiplatform Laser SystemsHandpiece-level indication expansion without a second capital purchase


Standalone Laser Systems retain 66.9% share because a dedicated wavelength and beam path deliver performance a shared console cannot fully match, and validation for a single indication is simpler. Multiplatform Laser Systems nonetheless post the dimension's fastest growth at 12.2% CAGR, since adding an applicator costs a fraction of a new machine and extends the console's economic life. Lessors have begun treating these platforms as software-upgradable assets, which changes depreciation assumptions and supports leasing structures.

By Portability

Sub-SegmentKey Trend
Non-PortableCart-based chassis required for peak power and sustained active cooling
PortableDiode efficiency gains enabling mobile, satellite and concierge delivery


Non-Portable platforms hold 74.5% of installed value for a physical reason: high average power output demands cooling hardware and power supplies that do not fit a handheld form factor. Portable systems grow at 10.7% CAGR as diode efficiency and thermal management improve, but they expand the market laterally rather than substituting for cart systems. Corporate wellness programmes and rural satellite sites that could never justify a fixed installation are the incremental buyers here.

By Application

Sub-SegmentKey Trend
Skin Resurfacing & RejuvenationPhotoaging and texture correction supported by widening clinical evidence
Hair RemovalPredictable multi-session packages with straightforward operator training
Body Sculpting & Skin TighteningHigher revenue per patient reshaping clinic floor-space allocation


Hair Removal anchors the dimension at 35.2% share because six-session packages generate reliable cash flow and the protocol is the easiest to delegate to trained non-physician operators. Body Sculpting & Skin Tightening grows fastest at 12.1% CAGR, and its larger applicators plus longer session times are pushing clinics to reallocate treatment rooms. Skin Resurfacing & Rejuvenation, at USD 0.78 billion in 2025, sits between the two on both volume and margin.

By End User

Sub-SegmentKey Trend
HospitalsReconstructive and post-oncology indications with distinct procurement cycles
Ambulatory Surgical CentersDay-case throughput efficiency favouring faster, higher-power platforms
Dermatology and Aesthetic ClinicsPhysician-led authority retaining higher-energy and higher-risk protocols
Medical SpasNon-clinical setting lowering first-visit hesitancy among new consumers


Dermatology and Aesthetic Clinics command 41.7% share because patients seeking ablative resurfacing or treatment of pigmented lesions want a physician on site, and referral networks reinforce that preference. Medical Spas grow fastest at 12.8% CAGR by removing the clinical atmosphere that deters first-time consumers, which enlarges total demand rather than simply reallocating it. That shift raises the stakes on operator credentialing, since inconsistent training across franchised networks carries brand and liability consequences.




Download PDF ×

We do not share your information with anyone. However, we may send you emails based on your report interest from time to time. You may contact us at any time to opt-out.