3D Printing Metal Market

ID: MRFR/CnM/1302-CR
111 Pages
Chitranshi Jaiswal
Last Updated: June 26, 2026
3D Printing Metals Market Research Report Information By Material (Titanium, Aluminum, Stainless Steel, Nickel, Inconel, and others), By Technology (Vat Photopolymerization, Material Extrusion, Sheet Lamination, Binder Jetting, Material Jetting, and others), By Application (Aerospace & Defense, Automotive, Healthcare, Building & Construction, Consumer Electronics, and others), And By Region (North America, Europe, Asia-Pacific, And Rest Of The World) – Market Forecast Till 2035
Download PDF ×

We do not share your information with anyone. However, we may send you emails based on your report interest from time to time. You may contact us at any time to opt-out.

3D Printing Metal Market

Market Size

Forecast Period2025-2035
CAGR (2025-2035)20.8%
2025 Market SizeUSD 0.83 billion
2035 Market SizeUSD 5.53 billion

Key Players

EOS GmbH
GE Additive
Sandvik AB
SLM Solutions
Carpenter Technology
Höganäs AB
Opportunities
  • Copper Alloy Printing for EV Thermal Management
  • Distributed Manufacturing in Emerging Markets
  • AI-Driven In-Situ Quality Monitoring
  1. 1 Market Overview |
    1. 1.1 Study Assumptions & Market Definition |
    2. 1.2 Scope of the Study |
    3. 1.3 Research Methodology
  2. 2 Market Summary & Key Takeaways
  3. 3 Market Dynamics |
    1. 3.1 Market Drivers Analysis | |
      1. 3.1.1 Defense On-Demand Spare-Part Mandates | |
      2. 3.1.2 FDA / CE Medical Device Clearances | |
      3. 3.1.3 Automotive Lightweighting Regulations | |
      4. 3.1.4 Multi-Laser Productivity Gains | |
      5. 3.1.5 Domestic Powder Atomization Capacity in Asia | |
      6. 3.1.6 Powder Recycling and Sustainability Mandates | |
      7. 3.1.7 Digital-Thread Integration (MES/ERP Connectivity) |
    2. 3.2 Market Restraints Analysis | |
      1. 3.2.1 High Powder Feedstock Cost | |
      2. 3.2.2 Lengthy Qualification and Certification Cycles | |
      3. 3.2.3 Limited Build-Volume Dimensions | |
      4. 3.2.4 Skilled-Operator Workforce Gap | |
      5. 3.2.5 Post-Processing Complexity |
    3. 3.3 Market Opportunity Analysis | |
      1. 3.3.1 Copper Alloy Printing for EV Thermal Management | |
      2. 3.3.2 Distributed Manufacturing in Emerging Markets | |
      3. 3.3.3 AI-Driven In-Situ Quality Monitoring | |
      4. 3.3.4 Powder-as-a-Service Business Models | |
      5. 3.3.5 Space-Launch and Satellite Hardware |
    4. 3.4 Industry Value Chain Analysis |
    5. 3.5 Porter's Five Forces Analysis
  4. 4 3D Printing Metals Market Size & Forecast (2021–2035) |
    1. 4.1 Historical Market Size (2021–2025) |
    2. 4.2 Current & Forecast Market Size (2026–2035) |
    3. 4.3 Market Size by Revenue (USD billion) |
    4. 4.4 Year-over-Year Growth Analysis
  5. 5 Segmentation Analysis |
    1. 5.1 By Metal Type | |
      1. 5.1.1 Titanium Alloys | |
      2. 5.1.2 Stainless Steel | |
      3. 5.1.3 Aluminum Alloys | |
      4. 5.1.4 Nickel Alloys | |
      5. 5.1.5 Cobalt-Chrome | |
      6. 5.1.6 Other Metals |
    2. 5.2 By Form | |
      1. 5.2.1 Powder | |
      2. 5.2.2 Wire | |
      3. 5.2.3 Other Forms |
    3. 5.3 By End-User Industry | |
      1. 5.3.1 Aerospace & Defense | |
      2. 5.3.2 Automotive | |
      3. 5.3.3 Healthcare | |
      4. 5.3.4 Energy & Power | |
      5. 5.3.5 Industrial Manufacturing | |
      6. 5.3.6 Other End Users
  6. 6 Regional Analysis |
    1. 6.1 North America | |
      1. 6.1.1 United States | |
      2. 6.1.2 Canada | |
      3. 6.1.3 Mexico |
    2. 6.2 Europe | |
      1. 6.2.1 Germany | |
      2. 6.2.2 United Kingdom | |
      3. 6.2.3 France | |
      4. 6.2.4 Italy | |
      5. 6.2.5 Spain | |
      6. 6.2.6 Nordic Countries | |
      7. 6.2.7 Russia | |
      8. 6.2.8 Rest of Europe |
    3. 6.3 Asia-Pacific | |
      1. 6.3.1 China | |
      2. 6.3.2 India | |
      3. 6.3.3 Japan | |
      4. 6.3.4 South Korea | |
      5. 6.3.5 ASEAN | |
      6. 6.3.6 Rest of Asia-Pacific |
    4. 6.4 South America | |
      1. 6.4.1 Brazil | |
      2. 6.4.2 Argentina | |
      3. 6.4.3 Rest of South America |
    5. 6.5 Middle East & Africa | |
      1. 6.5.1 Saudi Arabia | |
      2. 6.5.2 UAE | |
      3. 6.5.3 South Africa | |
      4. 6.5.4 Egypt | |
      5. 6.5.5 Rest of MEA
  7. 7 Competitive Landscape |
    1. 7.1 Market Share Analysis (2025) |
    2. 7.2 Competitive Benchmarking Matrix |
    3. 7.3 Company Profiles | |
      1. 7.3.1 EOS GmbH | |
      2. 7.3.2 GE Additive | |
      3. 7.3.3 Sandvik AB | |
      4. 7.3.4 SLM Solutions (Nikon) | |
      5. 7.3.5 Carpenter Technology | |
      6. 7.3.6 Höganäs AB | |
      7. 7.3.7 Renishaw plc | |
      8. 7.3.8 Velo3D | |
      9. 7.3.9 GKN Powder Metallurgy | |
      10. 7.3.10 3D Systems
  8. 8 Future Outlook & Strategic Recommendations (2026–2035) |
    1. 8.1 AI-Optimized Design and Process Control |
    2. 8.2 Sustainability and Circular-Economy Integration |
    3. 8.3 Platform Economics and Qualified-Ecosystem Lock-In |
    4. 8.4 Large-Format and Multi-Material Builds
  9. 9 Recent Developments & News
  10. 10 Frequently Asked Questions (FAQs)
  11. 11 Report Scope & Methodology |
    1. 11.1 Study Period & Base Year |
    2. 11.2 Data Sources & Citations |
    3. 11.3 Abbreviations
  12. 12 LIST OF TABLES |
  13. TABLE 1 3D Printing Metals Market Size & Forecast, by Revenue (USD billion), 2021–2035 |
  14. TABLE 2 3D Printing Metals Market — Year-over-Year Growth Analysis, 2021–2035 |
  15. TABLE 3 Driver Impact Analysis — 3D Printing Metals Market, 2026–2035 |
  16. TABLE 4 Restraints Impact Analysis — 3D Printing Metals Market, 2026–2035 |
  17. TABLE 5 Regional Market Summary — 3D Printing Metals Market, 2025 |
  18. TABLE 6 North America 3D Printing Metals Market Size, by Country, 2021–2035 (USD billion) |
  19. TABLE 7 Europe 3D Printing Metals Market Size, by Country, 2021–2035 (USD billion) |
  20. TABLE 8 Asia-Pacific 3D Printing Metals Market Size, by Country, 2021–2035 (USD billion) |
  21. TABLE 9 South America 3D Printing Metals Market Size, by Country, 2021–2035 (USD billion) |
  22. TABLE 10 Middle East & Africa 3D Printing Metals Market Size, by Country, 2021–2035 (USD billion) |
  23. TABLE 11 3D Printing Metals Market Size, by Metal Type, 2021–2035 (USD billion) |
  24. TABLE 12 3D Printing Metals Market Size, by Form, 2021–2035 (USD billion) |
  25. TABLE 13 3D Printing Metals Market Size, by End-User Industry, 2021–2035 (USD billion) |
  26. TABLE 14 Competitive Benchmarking Matrix — 3D Printing Metals Market, 2025 |
  27. TABLE 15 Company Profiles — Key Players, 3D Printing Metals Market |
  28. TABLE 16 Recent Developments & Strategic Announcements, 2023–2025 |
  29. TABLE 17 Report Scope & Methodology Summary |
  30. TABLE 18 Detailed Sources and Citations |
  31. TABLE 19 North America 3D Printing Metals Market Size, by Metal Type, 2021–2035 (USD billion) |
  32. TABLE 20 North America 3D Printing Metals Market Size, by Form, 2021–2035 (USD billion) |
  33. TABLE 21 North America 3D Printing Metals Market Size, by End-User Industry, 2021–2035 (USD billion) |
  34. TABLE 22 Europe 3D Printing Metals Market Size, by Metal Type, 2021–2035 (USD billion) |
  35. TABLE 23 Europe 3D Printing Metals Market Size, by Form, 2021–2035 (USD billion) |
  36. TABLE 24 Europe 3D Printing Metals Market Size, by End-User Industry, 2021–2035 (USD billion) |
  37. TABLE 25 Asia-Pacific 3D Printing Metals Market Size, by Metal Type, 2021–2035 (USD billion) |
  38. TABLE 26 Asia-Pacific 3D Printing Metals Market Size, by Form, 2021–2035 (USD billion) |
  39. TABLE 27 Asia-Pacific 3D Printing Metals Market Size, by End-User Industry, 2021–2035 (USD billion) |
  40. TABLE 28 South America 3D Printing Metals Market Size, by Metal Type, 2021–2035 (USD billion) |
  41. TABLE 29 South America 3D Printing Metals Market Size, by Form, 2021–2035 (USD billion) |
  42. TABLE 30 South America 3D Printing Metals Market Size, by End-User Industry, 2021–2035 (USD billion) |
  43. TABLE 31 Middle East & Africa 3D Printing Metals Market Size, by Metal Type, 2021–2035 (USD billion) |
  44. TABLE 32 Middle East & Africa 3D Printing Metals Market Size, by Form, 2021–2035 (USD billion) |
  45. TABLE 33 Middle East & Africa 3D Printing Metals Market Size, by End-User Industry, 2021–2035 (USD billion) |
  46. TABLE 34 United States 3D Printing Metals Market Size, by Metal Type, 2021–2035 (USD billion) |
  47. TABLE 35 United States 3D Printing Metals Market Size, by Form, 2021–2035 (USD billion) |
  48. TABLE 36 United States 3D Printing Metals Market Size, by End-User Industry, 2021–2035 (USD billion) |
  49. TABLE 37 Canada 3D Printing Metals Market Size, by Metal Type, 2021–2035 (USD billion) |
  50. TABLE 38 Canada 3D Printing Metals Market Size, by Form, 2021–2035 (USD billion) |
  51. TABLE 39 Canada 3D Printing Metals Market Size, by End-User Industry, 2021–2035 (USD billion) |
  52. TABLE 40 Mexico 3D Printing Metals Market Size, by Metal Type, 2021–2035 (USD billion) |
  53. TABLE 41 Mexico 3D Printing Metals Market Size, by Form, 2021–2035 (USD billion) |
  54. TABLE 42 Mexico 3D Printing Metals Market Size, by End-User Industry, 2021–2035 (USD billion) |
  55. TABLE 43 Germany 3D Printing Metals Market Size, by Metal Type, 2021–2035 (USD billion) |
  56. TABLE 44 Germany 3D Printing Metals Market Size, by Form, 2021–2035 (USD billion) |
  57. TABLE 45 Germany 3D Printing Metals Market Size, by End-User Industry, 2021–2035 (USD billion) |
  58. TABLE 46 United Kingdom 3D Printing Metals Market Size, by Metal Type, 2021–2035 (USD billion) |
  59. TABLE 47 United Kingdom 3D Printing Metals Market Size, by Form, 2021–2035 (USD billion) |
  60. TABLE 48 United Kingdom 3D Printing Metals Market Size, by End-User Industry, 2021–2035 (USD billion) |
  61. TABLE 49 France 3D Printing Metals Market Size, by Metal Type, 2021–2035 (USD billion) |
  62. TABLE 50 France 3D Printing Metals Market Size, by Form, 2021–2035 (USD billion) |
  63. TABLE 51 France 3D Printing Metals Market Size, by End-User Industry, 2021–2035 (USD billion) |
  64. TABLE 52 China 3D Printing Metals Market Size, by Metal Type, 2021–2035 (USD billion) |
  65. TABLE 53 China 3D Printing Metals Market Size, by Form, 2021–2035 (USD billion) |
  66. TABLE 54 China 3D Printing Metals Market Size, by End-User Industry, 2021–2035 (USD billion) |
  67. TABLE 55 India 3D Printing Metals Market Size, by Metal Type, 2021–2035 (USD billion) |
  68. TABLE 56 India 3D Printing Metals Market Size, by Form, 2021–2035 (USD billion) |
  69. TABLE 57 India 3D Printing Metals Market Size, by End-User Industry, 2021–2035 (USD billion) |
  70. TABLE 58 Japan 3D Printing Metals Market Size, by Metal Type, 2021–2035 (USD billion) |
  71. TABLE 59 Japan 3D Printing Metals Market Size, by Form, 2021–2035 (USD billion) |
  72. TABLE 60 Japan 3D Printing Metals Market Size, by End-User Industry, 2021–2035 (USD billion) |
  73. TABLE 61 South Korea 3D Printing Metals Market Size, by Metal Type, 2021–2035 (USD billion) |
  74. TABLE 62 South Korea 3D Printing Metals Market Size, by Form, 2021–2035 (USD billion) |
  75. TABLE 63 South Korea 3D Printing Metals Market Size, by End-User Industry, 2021–2035 (USD billion) |
  76. TABLE 64 Brazil 3D Printing Metals Market Size, by Metal Type, 2021–2035 (USD billion) |
  77. TABLE 65 Brazil 3D Printing Metals Market Size, by Form, 2021–2035 (USD billion) |
  78. TABLE 66 Brazil 3D Printing Metals Market Size, by End-User Industry, 2021–2035 (USD billion) |
  79. TABLE 67 Saudi Arabia 3D Printing Metals Market Size, by Metal Type, 2021–2035 (USD billion) |
  80. TABLE 68 Saudi Arabia 3D Printing Metals Market Size, by Form, 2021–2035 (USD billion) |
  81. TABLE 69 Saudi Arabia 3D Printing Metals Market Size, by End-User Industry, 2021–2035 (USD billion) |
  82. TABLE 70 UAE 3D Printing Metals Market Size, by Metal Type, 2021–2035 (USD billion) |
  83. TABLE 71 UAE 3D Printing Metals Market Size, by Form, 2021–2035 (USD billion) |
  84. TABLE 72 UAE 3D Printing Metals Market Size, by End-User Industry, 2021–2035 (USD billion)
  85. 13 LIST OF FIGURES |
  86. FIGURE 1 3D Printing Metals Market Dynamics — Drivers, Restraints, and Opportunities |
  87. FIGURE 2 3D Printing Metals Market Value Chain Analysis |
  88. FIGURE 3 Porter's Five Forces Analysis — 3D Printing Metals Market |
  89. FIGURE 4 3D Printing Metals Market Size Trend (USD billion), 2021–2035 |
  90. FIGURE 5 3D Printing Metals Market Share, by Metal Type (%), 2025 |
  91. FIGURE 6 3D Printing Metals Market Share, by Form (%), 2025 |
  92. FIGURE 7 3D Printing Metals Market Share, by End-User Industry (%), 2025 |
  93. FIGURE 8 3D Printing Metals Market Share, by Region (%), 2025 |
  94. FIGURE 9 North America 3D Printing Metals Market Size Trend, 2021–2035 |
  95. FIGURE 10 Europe 3D Printing Metals Market Size Trend, 2021–2035 |
  96. FIGURE 11 Asia-Pacific 3D Printing Metals Market Size Trend, 2021–2035 |
  97. FIGURE 12 South America 3D Printing Metals Market Size Trend, 2021–2035 |
  98. FIGURE 13 Middle East & Africa 3D Printing Metals Market Size Trend, 2021–2035 |
  99. FIGURE 14 Competitive Landscape — 3D Printing Metals Market Revenue Share (%), 2025 |
  100. FIGURE 15 3D Printing Metals Market CAGR Comparison, by Metal Type, 2026–2035 |
  101. FIGURE 16 3D Printing Metals Market CAGR Comparison, by End-User Industry, 2026–2035

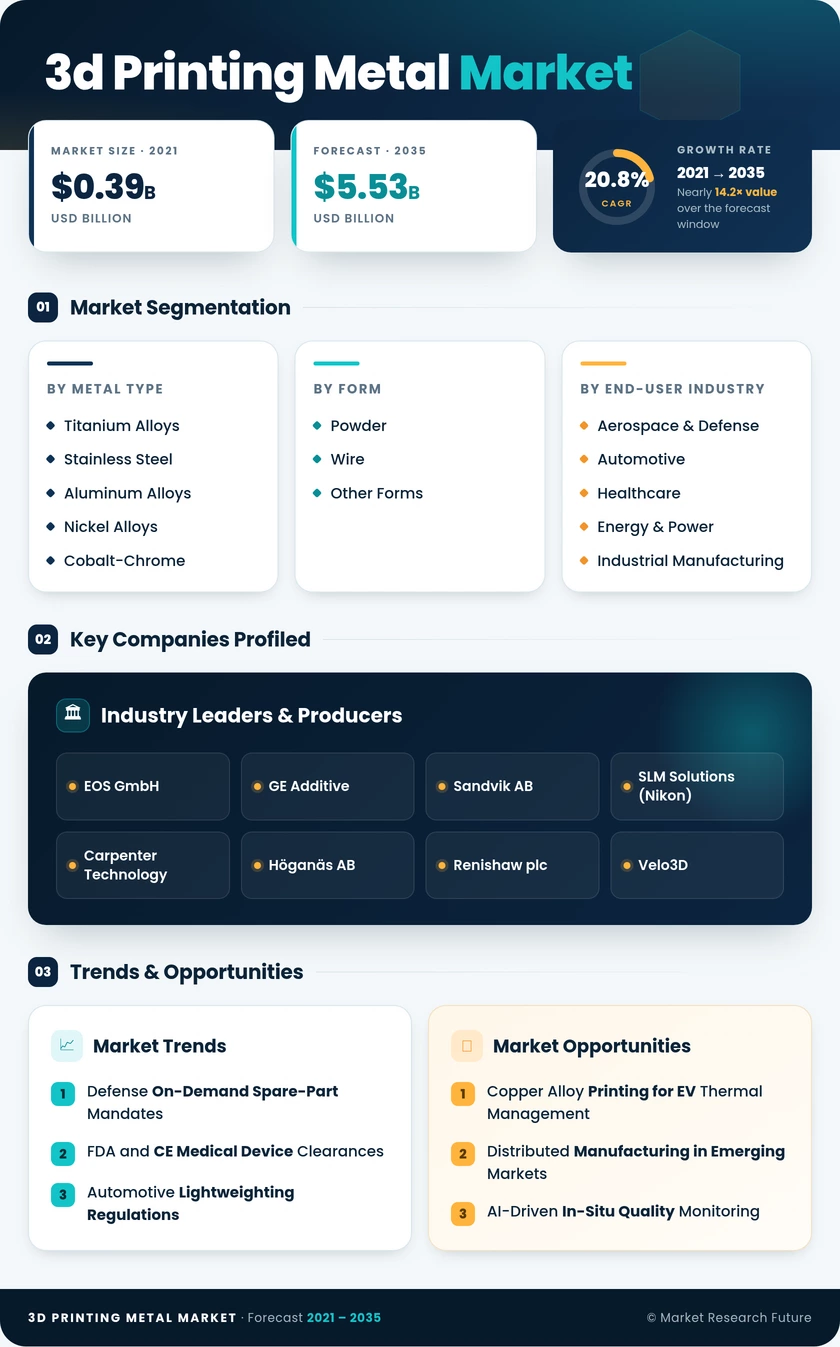
Segmentation Quick Reference

DimensionSub-SegmentsDominant SegmentFastest Growing Segment
By Metal TypeTitanium Alloys, Stainless Steel, Aluminum Alloys, Nickel Alloys, Cobalt-Chrome, Other MetalsTitanium AlloysStainless Steel
By FormPowder, Wire, Other FormsPowderWire
By End-User IndustryAerospace & Defense, Automotive, Healthcare, Energy & Power, Industrial Manufacturing, Other End UsersAerospace & DefenseAutomotive


Market Segmentation Overview

By Metal Type

Sub-SegmentKey Trend
Titanium AlloysExpanding from Ti-6Al-4V into near-beta alloys for landing-gear fatigue resistance
Stainless SteelCost-accessible entry point driving SME and healthcare adoption
Aluminum AlloysEV thermal-management and lightweighting applications are gaining traction.
Nickel AlloysHot-section turbine-blade repair and new-make growth in energy
Cobalt-ChromeDental and orthopedic implant demand remains a core use case.
Other MetalsCopper for EV busbars, tool steels for mold inserts


Titanium alloys remain the highest-value segment in the 3D Printing Metals Market, though stainless steel is closing the gap as machine platforms optimized for 316L and 17-4PH bring entry costs below USD 300,000. Nickel superalloys maintain a specialized but high-margin niche tied directly to gas-turbine overhaul and new-build cycles in the energy sector.

By Form

Sub-SegmentKey Trend
PowderGas-atomized spherical powder dominates PBF and binder jetting feedstock
WireGrowing in large-format DED and wire-arc applications for shipbuilding
Other FormsSheet lamination and paste-based extrusion remain nascent.


Powder is the foundational feedstock form for the 3D Printing Metals Market, with particle-size-distribution specifications tightening as quality requirements escalate in regulated industries. Wire-fed processes are expanding addressable part sizes beyond the build-envelope constraints of powder bed systems.

By End-User Industry

Sub-SegmentKey Trend
Aerospace & DefenseSerial production of flight-critical components is now at scale
AutomotiveTransition from prototyping to volume-production applications
HealthcarePatient-specific implants and surgical instruments are driving growth.
Energy & PowerTurbine-blade repair and nuclear-component printing are emerging.
Industrial ManufacturingConformal-cooling inserts and custom tooling are expanding.
Other End UsersJewelry, consumer goods, and academic research applications


Aerospace and defense anchors the 3D Printing Metals Market as the premier high-value vertical, while automotive is emerging as the volume-growth engine. Healthcare sits at the intersection of regulatory complexity and personalization value, making it a durable mid-sized segment through 2035.