Request Free Sample ×

Kindly complete the form below to receive a free sample of this Report

* Please use a valid business email

Leading companies partner with us for data-driven Insights

clients tt-cursor
Hero Background

Marché des interfaces câblées

ID: MRFR/SEM/32750-HCR
100 Pages
Aarti Dhapte
Last Updated: April 24, 2026

Rapport d'étude de marché sur les interfaces filaires par application (automobile, électronique grand public, automatisation industrielle, télécommunications), par type d'interface (Ethernet, USB, HDMI, communication série), par utilisation finale (résidentielle, commerciale, industrielle), par norme de connectivité (Ethernet filaire, câble coaxial, paire torsadée, fibre optique) et par région (Amérique du Nord, Europe, Amérique du Sud, Asie-Pacifique, Moyen-Orient et Afrique) - Prévisions jusqu'en 2035.

Partager
Download PDF ×

We do not share your information with anyone. However, we may send you emails based on your report interest from time to time. You may contact us at any time to opt-out.

Wired Interface Market Infographic
Purchase Options
  1. 1 SECTION I : RÉSUMÉ EXÉCUTIF ET POINTS CLÉS
    1. 1.1 RÉSUMÉ EXÉCUTIF
      1. 1.1.1 Vue d'ensemble du marché
      2. 1.1.2 Conclusions clés
      3. 1.1.3 Segmentation du marché
      4. 1.1.4 Paysage concurrentiel
      5. 1.1.5 Défis et opportunités
      6. 1.1.6 Perspectives futures
  2. 2 SECTION II : DÉLIMITATION, MÉTHODOLOGIE ET STRUCTURE DU MARCHÉ
    1. 2.1 INTRODUCTION AU MARCHÉ
      1. 2.1.1 Définition
      2. 2.1.2 Portée de l'étude
        1. 2.1.2.1 Objectif de recherche
        2. 2.1.2.2 Hypothèse
        3. 2.1.2.3 Limitations
    2. 2.2 MÉTHODOLOGIE DE RECHERCHE
      1. 2.2.1 Vue d'ensemble
      2. 2.2.2 Extraction de données
      3. 2.2.3 Recherche secondaire
      4. 2.2.4 Recherche primaire
        1. 2.2.4.1 Interviews primaires et processus de collecte d'informations
        2. 2.2.4.2 Répartition des répondants principaux
      5. 2.2.5 Modèle de prévision
      6. 2.2.6 Estimation de la taille du marché
        1. 2.2.6.1 Approche ascendante
        2. 2.2.6.2 Approche descendante
      7. 2.2.7 Triangulation des données
      8. 2.2.8 Validation
  3. 3 SECTION III : ANALYSE QUALITATIVE
    1. 3.1 DYNAMIQUE DU MARCHÉ
      1. 3.1.1 Vue d'ensemble
      2. 3.1.2 Facteurs moteurs
      3. 3.1.3 Contraintes
      4. 3.1.4 Opportunités
    2. 3.2 ANALYSE DES FACTEURS DU MARCHÉ
      1. 3.2.1 Analyse de la chaîne de valeur
      2. 3.2.2 Analyse des cinq forces de Porter
        1. 3.2.2.1 Pouvoir de négociation des fournisseurs
        2. 3.2.2.2 Pouvoir de négociation des acheteurs
        3. 3.2.2.3 Menace des nouveaux entrants
        4. 3.2.2.4 Menace des substituts
        5. 3.2.2.5 Intensité de la rivalité
      3. 3.2.3 Analyse de l'impact du COVID-19
        1. 3.2.3.1 Analyse de l'impact sur le marché
        2. 3.2.3.2 Impact régional
        3. 3.2.3.3 Analyse des opportunités et des menaces
  4. 4 SECTION IV : ANALYSE QUANTITATIVE
    1. 4.1 Semi-conducteurs et électronique, PAR application (milliards USD)
      1. 4.1.1 Automobile
      2. 4.1.2 Électronique grand public
      3. 4.1.3 Automatisation industrielle
      4. 4.1.4 Télécommunications
    2. 4.2 Semi-conducteurs et électronique, PAR type d'interface (milliards USD)
      1. 4.2.1 Ethernet
      2. 4.2.2 USB
      3. 4.2.3 HDMI
      4. 4.2.4 Communication série
    3. 4.3 Semi-conducteurs et électronique, PAR utilisation finale (milliards USD)
      1. 4.3.1 Résidentiel
      2. 4.3.2 Commercial
      3. 4.3.3 Industriel
    4. 4.4 Semi-conducteurs et électronique, PAR norme de connectivité (milliards USD)
      1. 4.4.1 Ethernet câblé
      2. 4.4.2 Câble coaxial
      3. 4.4.3 Paire torsadée
      4. 4.4.4 Fibre optique
    5. 4.5 Semi-conducteurs et électronique, PAR région (milliards USD)
      1. 4.5.1 Amérique du Nord
        1. 4.5.1.1 États-Unis
        2. 4.5.1.2 Canada
      2. 4.5.2 Europe
        1. 4.5.2.1 Allemagne
        2. 4.5.2.2 Royaume-Uni
        3. 4.5.2.3 France
        4. 4.5.2.4 Russie
        5. 4.5.2.5 Italie
        6. 4.5.2.6 Espagne
        7. 4.5.2.7 Reste de l'Europe
      3. 4.5.3 APAC
        1. 4.5.3.1 Chine
        2. 4.5.3.2 Inde
        3. 4.5.3.3 Japon
        4. 4.5.3.4 Corée du Sud
        5. 4.5.3.5 Malaisie
        6. 4.5.3.6 Thaïlande
        7. 4.5.3.7 Indonésie
        8. 4.5.3.8 Reste de l'APAC
      4. 4.5.4 Amérique du Sud
        1. 4.5.4.1 Brésil
        2. 4.5.4.2 Mexique
        3. 4.5.4.3 Argentine
        4. 4.5.4.4 Reste de l'Amérique du Sud
      5. 4.5.5 MEA
        1. 4.5.5.1 Pays du CCG
        2. 4.5.5.2 Afrique du Sud
        3. 4.5.5.3 Reste de la MEA
  5. 5 SECTION V : ANALYSE CONCURRENTIELLE
    1. 5.1 Paysage concurrentiel
      1. 5.1.1 Vue d'ensemble
      2. 5.1.2 Analyse concurrentielle
      3. 5.1.3 Analyse de la part de marché
      4. 5.1.4 Principale stratégie de croissance dans les semi-conducteurs et l'électronique
      5. 5.1.5 Évaluation comparative
      6. 5.1.6 Acteurs majeurs en termes de nombre de développements dans les semi-conducteurs et l'électronique
      7. 5.1.7 Développements clés et stratégies de croissance
        1. 5.1.7.1 Lancement de nouveaux produits / Déploiement de services
        2. 5.1.7.2 Fusions et acquisitions
        3. 5.1.7.3 Coentreprises
      8. 5.1.8 Matrice financière des principaux acteurs
        1. 5.1.8.1 Ventes et revenu d'exploitation
        2. 5.1.8.2 Dépenses de R&D des principaux acteurs. 2023
    2. 5.2 Profils d'entreprise
      1. 5.2.1 Apple Inc. (États-Unis)
        1. 5.2.1.1 Vue d'ensemble financière
        2. 5.2.1.2 Produits offerts
        3. 5.2.1.3 Développements clés
        4. 5.2.1.4 Analyse SWOT
        5. 5.2.1.5 Stratégies clés
      2. 5.2.2 Microsoft Corporation (États-Unis)
        1. 5.2.2.1 Vue d'ensemble financière
        2. 5.2.2.2 Produits offerts
        3. 5.2.2.3 Développements clés
        4. 5.2.2.4 Analyse SWOT
        5. 5.2.2.5 Stratégies clés
      3. 5.2.3 Intel Corporation (États-Unis)
        1. 5.2.3.1 Vue d'ensemble financière
        2. 5.2.3.2 Produits offerts
        3. 5.2.3.3 Développements clés
        4. 5.2.3.4 Analyse SWOT
        5. 5.2.3.5 Stratégies clés
      4. 5.2.4 Cisco Systems Inc. (États-Unis)
        1. 5.2.4.1 Vue d'ensemble financière
        2. 5.2.4.2 Produits offerts
        3. 5.2.4.3 Développements clés
        4. 5.2.4.4 Analyse SWOT
        5. 5.2.4.5 Stratégies clés
      5. 5.2.5 Samsung Electronics Co. Ltd. (Corée du Sud)
        1. 5.2.5.1 Vue d'ensemble financière
        2. 5.2.5.2 Produits offerts
        3. 5.2.5.3 Développements clés
        4. 5.2.5.4 Analyse SWOT
        5. 5.2.5.5 Stratégies clés
      6. 5.2.6 Sony Corporation (Japon)
        1. 5.2.6.1 Vue d'ensemble financière
        2. 5.2.6.2 Produits offerts
        3. 5.2.6.3 Développements clés
        4. 5.2.6.4 Analyse SWOT
        5. 5.2.6.5 Stratégies clés
      7. 5.2.7 NVIDIA Corporation (États-Unis)
        1. 5.2.7.1 Vue d'ensemble financière
        2. 5.2.7.2 Produits offerts
        3. 5.2.7.3 Développements clés
        4. 5.2.7.4 Analyse SWOT
        5. 5.2.7.5 Stratégies clés
      8. 5.2.8 Broadcom Inc. (États-Unis)
        1. 5.2.8.1 Vue d'ensemble financière
        2. 5.2.8.2 Produits offerts
        3. 5.2.8.3 Développements clés
        4. 5.2.8.4 Analyse SWOT
        5. 5.2.8.5 Stratégies clés
      9. 5.2.9 Qualcomm Incorporated (États-Unis)
        1. 5.2.9.1 Vue d'ensemble financière
        2. 5.2.9.2 Produits offerts
        3. 5.2.9.3 Développements clés
        4. 5.2.9.4 Analyse SWOT
        5. 5.2.9.5 Stratégies clés
    3. 5.3 Annexe
      1. 5.3.1 Références
      2. 5.3.2 Rapports connexes
  6. 6 LISTE DES FIGURES
    1. 6.1 SYNOPSIS DU MARCHÉ
    2. 6.2 ANALYSE DU MARCHÉ EN AMÉRIQUE DU NORD
    3. 6.3 ANALYSE DU MARCHÉ AUX ÉTATS-UNIS PAR APPLICATION
    4. 6.4 ANALYSE DU MARCHÉ AUX ÉTATS-UNIS PAR TYPE D'INTERFACE
    5. 6.5 ANALYSE DU MARCHÉ AUX ÉTATS-UNIS PAR UTILISATION FINALE
    6. 6.6 ANALYSE DU MARCHÉ AUX ÉTATS-UNIS PAR NORME DE CONNECTIVITÉ
    7. 6.7 ANALYSE DU MARCHÉ AU CANADA PAR APPLICATION
    8. 6.8 ANALYSE DU MARCHÉ AU CANADA PAR TYPE D'INTERFACE
    9. 6.9 ANALYSE DU MARCHÉ AU CANADA PAR UTILISATION FINALE
    10. 6.10 ANALYSE DU MARCHÉ AU CANADA PAR NORME DE CONNECTIVITÉ
    11. 6.11 ANALYSE DU MARCHÉ EN EUROPE
    12. 6.12 ANALYSE DU MARCHÉ EN ALLEMAGNE PAR APPLICATION
    13. 6.13 ANALYSE DU MARCHÉ EN ALLEMAGNE PAR TYPE D'INTERFACE
    14. 6.14 ANALYSE DU MARCHÉ EN ALLEMAGNE PAR UTILISATION FINALE
    15. 6.15 ANALYSE DU MARCHÉ EN ALLEMAGNE PAR NORME DE CONNECTIVITÉ
    16. 6.16 ANALYSE DU MARCHÉ AU ROYAUME-UNI PAR APPLICATION
    17. 6.17 ANALYSE DU MARCHÉ AU ROYAUME-UNI PAR TYPE D'INTERFACE
    18. 6.18 ANALYSE DU MARCHÉ AU ROYAUME-UNI PAR UTILISATION FINALE
    19. 6.19 ANALYSE DU MARCHÉ AU ROYAUME-UNI PAR NORME DE CONNECTIVITÉ
    20. 6.20 ANALYSE DU MARCHÉ EN FRANCE PAR APPLICATION
    21. 6.21 ANALYSE DU MARCHÉ EN FRANCE PAR TYPE D'INTERFACE
    22. 6.22 ANALYSE DU MARCHÉ EN FRANCE PAR UTILISATION FINALE
    23. 6.23 ANALYSE DU MARCHÉ EN FRANCE PAR NORME DE CONNECTIVITÉ
    24. 6.24 ANALYSE DU MARCHÉ EN RUSSIE PAR APPLICATION
    25. 6.25 ANALYSE DU MARCHÉ EN RUSSIE PAR TYPE D'INTERFACE
    26. 6.26 ANALYSE DU MARCHÉ EN RUSSIE PAR UTILISATION FINALE
    27. 6.27 ANALYSE DU MARCHÉ EN RUSSIE PAR NORME DE CONNECTIVITÉ
    28. 6.28 ANALYSE DU MARCHÉ EN ITALIE PAR APPLICATION
    29. 6.29 ANALYSE DU MARCHÉ EN ITALIE PAR TYPE D'INTERFACE
    30. 6.30 ANALYSE DU MARCHÉ EN ITALIE PAR UTILISATION FINALE
    31. 6.31 ANALYSE DU MARCHÉ EN ITALIE PAR NORME DE CONNECTIVITÉ
    32. 6.32 ANALYSE DU MARCHÉ EN ESPAGNE PAR APPLICATION
    33. 6.33 ANALYSE DU MARCHÉ EN ESPAGNE PAR TYPE D'INTERFACE
    34. 6.34 ANALYSE DU MARCHÉ EN ESPAGNE PAR UTILISATION FINALE
    35. 6.35 ANALYSE DU MARCHÉ EN ESPAGNE PAR NORME DE CONNECTIVITÉ
    36. 6.36 ANALYSE DU MARCHÉ DANS LE RESTE DE L'EUROPE PAR APPLICATION
    37. 6.37 ANALYSE DU MARCHÉ DANS LE RESTE DE L'EUROPE PAR TYPE D'INTERFACE
    38. 6.38 ANALYSE DU MARCHÉ DANS LE RESTE DE L'EUROPE PAR UTILISATION FINALE
    39. 6.39 ANALYSE DU MARCHÉ DANS LE RESTE DE L'EUROPE PAR NORME DE CONNECTIVITÉ
    40. 6.40 ANALYSE DU MARCHÉ EN APAC
    41. 6.41 ANALYSE DU MARCHÉ EN CHINE PAR APPLICATION
    42. 6.42 ANALYSE DU MARCHÉ EN CHINE PAR TYPE D'INTERFACE
    43. 6.43 ANALYSE DU MARCHÉ EN CHINE PAR UTILISATION FINALE
    44. 6.44 ANALYSE DU MARCHÉ EN CHINE PAR NORME DE CONNECTIVITÉ
    45. 6.45 ANALYSE DU MARCHÉ EN INDE PAR APPLICATION
    46. 6.46 ANALYSE DU MARCHÉ EN INDE PAR TYPE D'INTERFACE
    47. 6.47 ANALYSE DU MARCHÉ EN INDE PAR UTILISATION FINALE
    48. 6.48 ANALYSE DU MARCHÉ EN INDE PAR NORME DE CONNECTIVITÉ
    49. 6.49 ANALYSE DU MARCHÉ AU JAPON PAR APPLICATION
    50. 6.50 ANALYSE DU MARCHÉ AU JAPON PAR TYPE D'INTERFACE
    51. 6.51 ANALYSE DU MARCHÉ AU JAPON PAR UTILISATION FINALE
    52. 6.52 ANALYSE DU MARCHÉ AU JAPON PAR NORME DE CONNECTIVITÉ
    53. 6.53 ANALYSE DU MARCHÉ EN CORÉE DU SUD PAR APPLICATION
    54. 6.54 ANALYSE DU MARCHÉ EN CORÉE DU SUD PAR TYPE D'INTERFACE
    55. 6.55 ANALYSE DU MARCHÉ EN CORÉE DU SUD PAR UTILISATION FINALE
    56. 6.56 ANALYSE DU MARCHÉ EN CORÉE DU SUD PAR NORME DE CONNECTIVITÉ
    57. 6.57 ANALYSE DU MARCHÉ EN MALAYSIE PAR APPLICATION
    58. 6.58 ANALYSE DU MARCHÉ EN MALAYSIE PAR TYPE D'INTERFACE
    59. 6.59 ANALYSE DU MARCHÉ EN MALAYSIE PAR UTILISATION FINALE
    60. 6.60 ANALYSE DU MARCHÉ EN MALAYSIE PAR NORME DE CONNECTIVITÉ
    61. 6.61 ANALYSE DU MARCHÉ EN THAÏLANDE PAR APPLICATION
    62. 6.62 ANALYSE DU MARCHÉ EN THAÏLANDE PAR TYPE D'INTERFACE
    63. 6.63 ANALYSE DU MARCHÉ EN THAÏLANDE PAR UTILISATION FINALE
    64. 6.64 ANALYSE DU MARCHÉ EN THAÏLANDE PAR NORME DE CONNECTIVITÉ
    65. 6.65 ANALYSE DU MARCHÉ EN INDONÉSIE PAR APPLICATION
    66. 6.66 ANALYSE DU MARCHÉ EN INDONÉSIE PAR TYPE D'INTERFACE
    67. 6.67 ANALYSE DU MARCHÉ EN INDONÉSIE PAR UTILISATION FINALE
    68. 6.68 ANALYSE DU MARCHÉ EN INDONÉSIE PAR NORME DE CONNECTIVITÉ
    69. 6.69 ANALYSE DU MARCHÉ DANS LE RESTE DE L'APAC PAR APPLICATION
    70. 6.70 ANALYSE DU MARCHÉ DANS LE RESTE DE L'APAC PAR TYPE D'INTERFACE
    71. 6.71 ANALYSE DU MARCHÉ DANS LE RESTE DE L'APAC PAR UTILISATION FINALE
    72. 6.72 ANALYSE DU MARCHÉ DANS LE RESTE DE L'APAC PAR NORME DE CONNECTIVITÉ
    73. 6.73 ANALYSE DU MARCHÉ EN AMÉRIQUE DU SUD
    74. 6.74 ANALYSE DU MARCHÉ AU BRÉSIL PAR APPLICATION
    75. 6.75 ANALYSE DU MARCHÉ AU BRÉSIL PAR TYPE D'INTERFACE
    76. 6.76 ANALYSE DU MARCHÉ AU BRÉSIL PAR UTILISATION FINALE
    77. 6.77 ANALYSE DU MARCHÉ AU BRÉSIL PAR NORME DE CONNECTIVITÉ
    78. 6.78 ANALYSE DU MARCHÉ AU MEXIQUE PAR APPLICATION
    79. 6.79 ANALYSE DU MARCHÉ AU MEXIQUE PAR TYPE D'INTERFACE
    80. 6.80 ANALYSE DU MARCHÉ AU MEXIQUE PAR UTILISATION FINALE
    81. 6.81 ANALYSE DU MARCHÉ AU MEXIQUE PAR NORME DE CONNECTIVITÉ
    82. 6.82 ANALYSE DU MARCHÉ EN ARGENTINE PAR APPLICATION
    83. 6.83 ANALYSE DU MARCHÉ EN ARGENTINE PAR TYPE D'INTERFACE
    84. 6.84 ANALYSE DU MARCHÉ EN ARGENTINE PAR UTILISATION FINALE
    85. 6.85 ANALYSE DU MARCHÉ EN ARGENTINE PAR NORME DE CONNECTIVITÉ
    86. 6.86 ANALYSE DU MARCHÉ DANS LE RESTE DE L'AMÉRIQUE DU SUD PAR APPLICATION
    87. 6.87 ANALYSE DU MARCHÉ DANS LE RESTE DE L'AMÉRIQUE DU SUD PAR TYPE D'INTERFACE
    88. 6.88 ANALYSE DU MARCHÉ DANS LE RESTE DE L'AMÉRIQUE DU SUD PAR UTILISATION FINALE
    89. 6.89 ANALYSE DU MARCHÉ DANS LE RESTE DE L'AMÉRIQUE DU SUD PAR NORME DE CONNECTIVITÉ
    90. 6.90 ANALYSE DU MARCHÉ EN MEA
    91. 6.91 ANALYSE DU MARCHÉ DANS LES PAYS DU CCG PAR APPLICATION
    92. 6.92 ANALYSE DU MARCHÉ DANS LES PAYS DU CCG PAR TYPE D'INTERFACE
    93. 6.93 ANALYSE DU MARCHÉ DANS LES PAYS DU CCG PAR UTILISATION FINALE
    94. 6.94 ANALYSE DU MARCHÉ DANS LES PAYS DU CCG PAR NORME DE CONNECTIVITÉ
    95. 6.95 ANALYSE DU MARCHÉ EN AFRIQUE DU SUD PAR APPLICATION
    96. 6.96 ANALYSE DU MARCHÉ EN AFRIQUE DU SUD PAR TYPE D'INTERFACE
    97. 6.97 ANALYSE DU MARCHÉ EN AFRIQUE DU SUD PAR UTILISATION FINALE
    98. 6.98 ANALYSE DU MARCHÉ EN AFRIQUE DU SUD PAR NORME DE CONNECTIVITÉ
    99. 6.99 ANALYSE DU MARCHÉ DANS LE RESTE DE LA MEA PAR APPLICATION
    100. 6.100 ANALYSE DU MARCHÉ DANS LE RESTE DE LA MEA PAR TYPE D'INTERFACE
    101. 6.101 ANALYSE DU MARCHÉ DANS LE RESTE DE LA MEA PAR UTILISATION FINALE
    102. 6.102 ANALYSE DU MARCHÉ DANS LE RESTE DE LA MEA PAR NORME DE CONNECTIVITÉ
    103. 6.103 CRITÈRES D'ACHAT CLÉS DES SEMI-CONDUCTEURS ET DE L'ÉLECTRONIQUE
    104. 6.104 PROCESSUS DE RECHERCHE DE MRFR
    105. 6.105 ANALYSE DRO DES SEMI-CONDUCTEURS ET DE L'ÉLECTRONIQUE
    106. 6.106 ANALYSE D'IMPACT DES FACTEURS MOTRICES : SEMI-CONDUCTEURS ET ÉLECTRONIQUE
    107. 6.107 ANALYSE D'IMPACT DES CONTRAINTES : SEMI-CONDUCTEURS ET ÉLECTRONIQUE
    108. 6.108 CHAÎNE D'APPROVISIONNEMENT / VALEUR : SEMI-CONDUCTEURS ET ÉLECTRONIQUE
    109. 6.109 SEMI-CONDUCTEURS ET ÉLECTRONIQUE, PAR APPLICATION, 2024 (% PART)
    110. 6.110 SEMI-CONDUCTEURS ET ÉLECTRONIQUE, PAR APPLICATION, 2024 À 2035 (milliards USD)
    111. 6.111 SEMI-CONDUCTEURS ET ÉLECTRONIQUE, PAR TYPE D'INTERFACE, 2024 (% PART)
    112. 6.112 SEMI-CONDUCTEURS ET ÉLECTRONIQUE, PAR TYPE D'INTERFACE, 2024 À 2035 (milliards USD)
    113. 6.113 SEMI-CONDUCTEURS ET ÉLECTRONIQUE, PAR UTILISATION FINALE, 2024 (% PART)
    114. 6.114 SEMI-CONDUCTEURS ET ÉLECTRONIQUE, PAR UTILISATION FINALE, 2024 À 2035 (milliards USD)
    115. 6.115 SEMI-CONDUCTEURS ET ÉLECTRONIQUE, PAR NORME DE CONNECTIVITÉ, 2024 (% PART)
    116. 6.116 SEMI-CONDUCTEURS ET ÉLECTRONIQUE, PAR NORME DE CONNECTIVITÉ, 2024 À 2035 (milliards USD)
    117. 6.117 ÉVALUATION DES PRINCIPAUX CONCURRENTS
  7. 7 LISTE DES TABLEAUX
    1. 7.1 LISTE DES HYPOTHÈSES
    2. 7.2 ESTIMATIONS DE TAILLE DU MARCHÉ EN AMÉRIQUE DU NORD ; PRÉVISIONS
      1. 7.2.1 PAR APPLICATION, 2025-2035 (milliards USD)
      2. 7.2.2 PAR TYPE D'INTERFACE, 2025-2035 (milliards USD)
      3. 7.2.3 PAR UTILISATION FINALE, 2025-2035 (milliards USD)
      4. 7.2.4 PAR NORME DE CONNECTIVITÉ, 2025-2035 (milliards USD)
    3. 7.3 ESTIMATIONS DE TAILLE DU MARCHÉ AUX ÉTATS-UNIS ; PRÉVISIONS
      1. 7.3.1 PAR APPLICATION, 2025-2035 (milliards USD)
      2. 7.3.2 PAR TYPE D'INTERFACE, 2025-2035 (milliards USD)
      3. 7.3.3 PAR UTILISATION FINALE, 2025-2035 (milliards USD)
      4. 7.3.4 PAR NORME DE CONNECTIVITÉ, 2025-2035 (milliards USD)
    4. 7.4 ESTIMATIONS DE TAILLE DU MARCHÉ AU CANADA ; PRÉVISIONS
      1. 7.4.1 PAR APPLICATION, 2025-2035 (milliards USD)
      2. 7.4.2 PAR TYPE D'INTERFACE, 2025-2035 (milliards USD)
      3. 7.4.3 PAR UTILISATION FINALE, 2025-2035 (milliards USD)
      4. 7.4.4 PAR NORME DE CONNECTIVITÉ, 2025-2035 (milliards USD)
    5. 7.5 ESTIMATIONS DE TAILLE DU MARCHÉ EN EUROPE ; PRÉVISIONS
      1. 7.5.1 PAR APPLICATION, 2025-2035 (milliards USD)
      2. 7.5.2 PAR TYPE D'INTERFACE, 2025-2035 (milliards USD)
      3. 7.5.3 PAR UTILISATION FINALE, 2025-2035 (milliards USD)
      4. 7.5.4 PAR NORME DE CONNECTIVITÉ, 2025-2035 (milliards USD)
    6. 7.6 ESTIMATIONS DE TAILLE DU MARCHÉ EN ALLEMAGNE ; PRÉVISIONS
      1. 7.6.1 PAR APPLICATION, 2025-2035 (milliards USD)
      2. 7.6.2 PAR TYPE D'INTERFACE, 2025-2035 (milliards USD)
      3. 7.6.3 PAR UTILISATION FINALE, 2025-2035 (milliards USD)
      4. 7.6.4 PAR NORME DE CONNECTIVITÉ, 2025-2035 (milliards USD)
    7. 7.7 ESTIMATIONS DE TAILLE DU MARCHÉ AU ROYAUME-UNI ; PRÉVISIONS
      1. 7.7.1 PAR APPLICATION, 2025-2035 (milliards USD)
      2. 7.7.2 PAR TYPE D'INTERFACE, 2025-2035 (milliards USD)
      3. 7.7.3 PAR UTILISATION FINALE, 2025-2035 (milliards USD)
      4. 7.7.4 PAR NORME DE CONNECTIVITÉ, 2025-2035 (milliards USD)
    8. 7.8 ESTIMATIONS DE TAILLE DU MARCHÉ EN FRANCE ; PRÉVISIONS
      1. 7.8.1 PAR APPLICATION, 2025-2035 (milliards USD)
      2. 7.8.2 PAR TYPE D'INTERFACE, 2025-2035 (milliards USD)
      3. 7.8.3 PAR UTILISATION FINALE, 2025-2035 (milliards USD)
      4. 7.8.4 PAR NORME DE CONNECTIVITÉ, 2025-2035 (milliards USD)
    9. 7.9 ESTIMATIONS DE TAILLE DU MARCHÉ EN RUSSIE ; PRÉVISIONS
      1. 7.9.1 PAR APPLICATION, 2025-2035 (milliards USD)
      2. 7.9.2 PAR TYPE D'INTERFACE, 2025-2035 (milliards USD)
      3. 7.9.3 PAR UTILISATION FINALE, 2025-2035 (milliards USD)
      4. 7.9.4 PAR NORME DE CONNECTIVITÉ, 2025-2035 (milliards USD)
    10. 7.10 ESTIMATIONS DE TAILLE DU MARCHÉ EN ITALIE ; PRÉVISIONS
      1. 7.10.1 PAR APPLICATION, 2025-2035 (milliards USD)
      2. 7.10.2 PAR TYPE D'INTERFACE, 2025-2035 (milliards USD)
      3. 7.10.3 PAR UTILISATION FINALE, 2025-2035 (milliards USD)
      4. 7.10.4 PAR NORME DE CONNECTIVITÉ, 2025-2035 (milliards USD)
    11. 7.11 ESTIMATIONS DE TAILLE DU MARCHÉ EN ESPAGNE ; PRÉVISIONS
      1. 7.11.1 PAR APPLICATION, 2025-2035 (milliards USD)
      2. 7.11.2 PAR TYPE D'INTERFACE, 2025-2035 (milliards USD)
      3. 7.11.3 PAR UTILISATION FINALE, 2025-2035 (milliards USD)
      4. 7.11.4 PAR NORME DE CONNECTIVITÉ, 2025-2035 (milliards USD)
    12. 7.12 ESTIMATIONS DE TAILLE DU MARCHÉ DANS LE RESTE DE L'EUROPE ; PRÉVISIONS
      1. 7.12.1 PAR APPLICATION, 2025-2035 (milliards USD)
      2. 7.12.2 PAR TYPE D'INTERFACE, 2025-2035 (milliards USD)
      3. 7.12.3 PAR UTILISATION FINALE, 2025-2035 (milliards USD)
      4. 7.12.4 PAR NORME DE CONNECTIVITÉ, 2025-2035 (milliards USD)
    13. 7.13 ESTIMATIONS DE TAILLE DU MARCHÉ EN APAC ; PRÉVISIONS
      1. 7.13.1 PAR APPLICATION, 2025-2035 (milliards USD)
      2. 7.13.2 PAR TYPE D'INTERFACE, 2025-2035 (milliards USD)
      3. 7.13.3 PAR UTILISATION FINALE, 2025-2035 (milliards USD)
      4. 7.13.4 PAR NORME DE CONNECTIVITÉ, 2025-2035 (milliards USD)
    14. 7.14 ESTIMATIONS DE TAILLE DU MARCHÉ EN CHINE ; PRÉVISIONS
      1. 7.14.1 PAR APPLICATION, 2025-2035 (milliards USD)
      2. 7.14.2 PAR TYPE D'INTERFACE, 2025-2035 (milliards USD)
      3. 7.14.3 PAR UTILISATION FINALE, 2025-2035 (milliards USD)
      4. 7.14.4 PAR NORME DE CONNECTIVITÉ, 2025-2035 (milliards USD)
    15. 7.15 ESTIMATIONS DE TAILLE DU MARCHÉ EN INDE ; PRÉVISIONS
      1. 7.15.1 PAR APPLICATION, 2025-2035 (milliards USD)
      2. 7.15.2 PAR TYPE D'INTERFACE, 2025-2035 (milliards USD)
      3. 7.15.3 PAR UTILISATION FINALE, 2025-2035 (milliards USD)
      4. 7.15.4 PAR NORME DE CONNECTIVITÉ, 2025-2035 (milliards USD)
    16. 7.16 ESTIMATIONS DE TAILLE DU MARCHÉ AU JAPON ; PRÉVISIONS
      1. 7.16.1 PAR APPLICATION, 2025-2035 (milliards USD)
      2. 7.16.2 PAR TYPE D'INTERFACE, 2025-2035 (milliards USD)
      3. 7.16.3 PAR UTILISATION FINALE, 2025-2035 (milliards USD)
      4. 7.16.4 PAR NORME DE CONNECTIVITÉ, 2025-2035 (milliards USD)
    17. 7.17 ESTIMATIONS DE TAILLE DU MARCHÉ EN CORÉE DU SUD ; PRÉVISIONS
      1. 7.17.1 PAR APPLICATION, 2025-2035 (milliards USD)
      2. 7.17.2 PAR TYPE D'INTERFACE, 2025-2035 (milliards USD)
      3. 7.17.3 PAR UTILISATION FINALE, 2025-2035 (milliards USD)
      4. 7.17.4 PAR NORME DE CONNECTIVITÉ, 2025-2035 (milliards USD)
    18. 7.18 ESTIMATIONS DE TAILLE DU MARCHÉ EN MALAYSIE ; PRÉVISIONS
      1. 7.18.1 PAR APPLICATION, 2025-2035 (milliards USD)
      2. 7.18.2 PAR TYPE D'INTERFACE, 2025-2035 (milliards USD)
      3. 7.18.3 PAR UTILISATION FINALE, 2025-2035 (milliards USD)
      4. 7.18.4 PAR NORME DE CONNECTIVITÉ, 2025-2035 (milliards USD)
    19. 7.19 ESTIMATIONS DE TAILLE DU MARCHÉ EN THAÏLANDE ; PRÉVISIONS
      1. 7.19.1 PAR APPLICATION, 2025-2035 (milliards USD)
      2. 7.19.2 PAR TYPE D'INTERFACE, 2025-2035 (milliards USD)
      3. 7.19.3 PAR UTILISATION FINALE, 2025-2035 (milliards USD)
      4. 7.19.4 PAR NORME DE CONNECTIVITÉ, 2025-2035 (milliards USD)
    20. 7.20 ESTIMATIONS DE TAILLE DU MARCHÉ EN INDONÉSIE ; PRÉVISIONS
      1. 7.20.1 PAR APPLICATION, 2025-2035 (milliards USD)
      2. 7.20.2 PAR TYPE D'INTERFACE, 2025-2035 (milliards USD)
      3. 7.20.3 PAR UTILISATION FINALE, 2025-2035 (milliards USD)
      4. 7.20.4 PAR NORME DE CONNECTIVITÉ, 2025-2035 (milliards USD)
    21. 7.21 ESTIMATIONS DE TAILLE DU MARCHÉ DANS LE RESTE DE L'APAC ; PRÉVISIONS
      1. 7.21.1 PAR APPLICATION, 2025-2035 (milliards USD)
      2. 7.21.2 PAR TYPE D'INTERFACE, 2025-2035 (milliards USD)
      3. 7.21.3 PAR UTILISATION FINALE, 2025-2035 (milliards USD)
      4. 7.21.4 PAR NORME DE CONNECTIVITÉ, 2025-2035 (milliards USD)
    22. 7.22 ESTIMATIONS DE TAILLE DU MARCHÉ EN AMÉRIQUE DU SUD ; PRÉVISIONS
      1. 7.22.1 PAR APPLICATION, 2025-2035 (milliards USD)
      2. 7.22.2 PAR TYPE D'INTERFACE, 2025-2035 (milliards USD)
      3. 7.22.3 PAR UTILISATION FINALE, 2025-2035 (milliards USD)
      4. 7.22.4 PAR NORME DE CONNECTIVITÉ, 2025-2035 (milliards USD)
    23. 7.23 ESTIMATIONS DE TAILLE DU MARCHÉ AU BRÉSIL ; PRÉVISIONS
      1. 7.23.1 PAR APPLICATION, 2025-2035 (milliards USD)
      2. 7.23.2 PAR TYPE D'INTERFACE, 2025-2035 (milliards USD)
      3. 7.23.3 PAR UTILISATION FINALE, 2025-2035 (milliards USD)
      4. 7.23.4 PAR NORME DE CONNECTIVITÉ, 2025-2035 (milliards USD)
    24. 7.24 ESTIMATIONS DE TAILLE DU MARCHÉ AU MEXIQUE ; PRÉVISIONS
      1. 7.24.1 PAR APPLICATION, 2025-2035 (milliards USD)
      2. 7.24.2 PAR TYPE D'INTERFACE, 2025-2035 (milliards USD)
      3. 7.24.3 PAR UTILISATION FINALE, 2025-2035 (milliards USD)
      4. 7.24.4 PAR NORME DE CONNECTIVITÉ, 2025-2035 (milliards USD)
    25. 7.25 ESTIMATIONS DE TAILLE DU MARCHÉ EN ARGENTINE ; PRÉVISIONS
      1. 7.25.1 PAR APPLICATION, 2025-2035 (milliards USD)
      2. 7.25.2 PAR TYPE D'INTERFACE, 2025-2035 (milliards USD)
      3. 7.25.3 PAR UTILISATION FINALE, 2025-2035 (milliards USD)
      4. 7.25.4 PAR NORME DE CONNECTIVITÉ, 2025-2035 (milliards USD)
    26. 7.26 ESTIMATIONS DE TAILLE DU MARCHÉ DANS LE RESTE DE L'AMÉRIQUE DU SUD ; PRÉVISIONS
      1. 7.26.1 PAR APPLICATION, 2025-2035 (milliards USD)
      2. 7.26.2 PAR TYPE D'INTERFACE, 2025-2035 (milliards USD)
      3. 7.26.3 PAR UTILISATION FINALE, 2025-2035 (milliards USD)
      4. 7.26.4 PAR NORME DE CONNECTIVITÉ, 2025-2035 (milliards USD)
    27. 7.27 ESTIMATIONS DE TAILLE DU MARCHÉ EN MEA ; PRÉVISIONS
      1. 7.27.1 PAR APPLICATION, 2025-2035 (milliards USD)
      2. 7.27.2 PAR TYPE D'INTERFACE, 2025-2035 (milliards USD)
      3. 7.27.3 PAR UTILISATION FINALE, 2025-2035 (milliards USD)
      4. 7.27.4 PAR NORME DE CONNECTIVITÉ, 2025-2035 (milliards USD)
    28. 7.28 ESTIMATIONS DE TAILLE DU MARCHÉ DANS LES PAYS DU CCG ; PRÉVISIONS
      1. 7.28.1 PAR APPLICATION, 2025-2035 (milliards USD)
      2. 7.28.2 PAR TYPE D'INTERFACE, 2025-2035 (milliards USD)
      3. 7.28.3 PAR UTILISATION FINALE, 2025-2035 (milliards USD)
      4. 7.28.4 PAR NORME DE CONNECTIVITÉ, 2025-2035 (milliards USD)
    29. 7.29 ESTIMATIONS DE TAILLE DU MARCHÉ EN AFRIQUE DU SUD ; PRÉVISIONS
      1. 7.29.1 PAR APPLICATION, 2025-2035 (milliards USD)
      2. 7.29.2 PAR TYPE D'INTERFACE, 2025-2035 (milliards USD)
      3. 7.29.3 PAR UTILISATION FINALE, 2025-2035 (milliards USD)
      4. 7.29.4 PAR NORME DE CONNECTIVITÉ, 2025-2035 (milliards USD)
    30. 7.30 ESTIMATIONS DE TAILLE DU MARCHÉ DANS LE RESTE DE LA MEA ; PRÉVISIONS
      1. 7.30.1 PAR APPLICATION, 2025-2035 (milliards USD)
      2. 7.30.2 PAR TYPE D'INTERFACE, 2025-2035 (milliards USD)
      3. 7.30.3 PAR UTILISATION FINALE, 2025-2035 (milliards USD)
      4. 7.30.4 PAR NORME DE CONNECTIVITÉ, 2025-2035 (milliards USD)
    31. 7.31 LANCEMENT DE PRODUIT / DÉVELOPPEMENT DE PRODUIT / APPROBATION
    32. 7.32 ACQUISITION / PARTENARIAT

Segmentation du marché des interfaces filaires

  • Marché des interfaces filaires par application (milliards USD, 2020-2034)
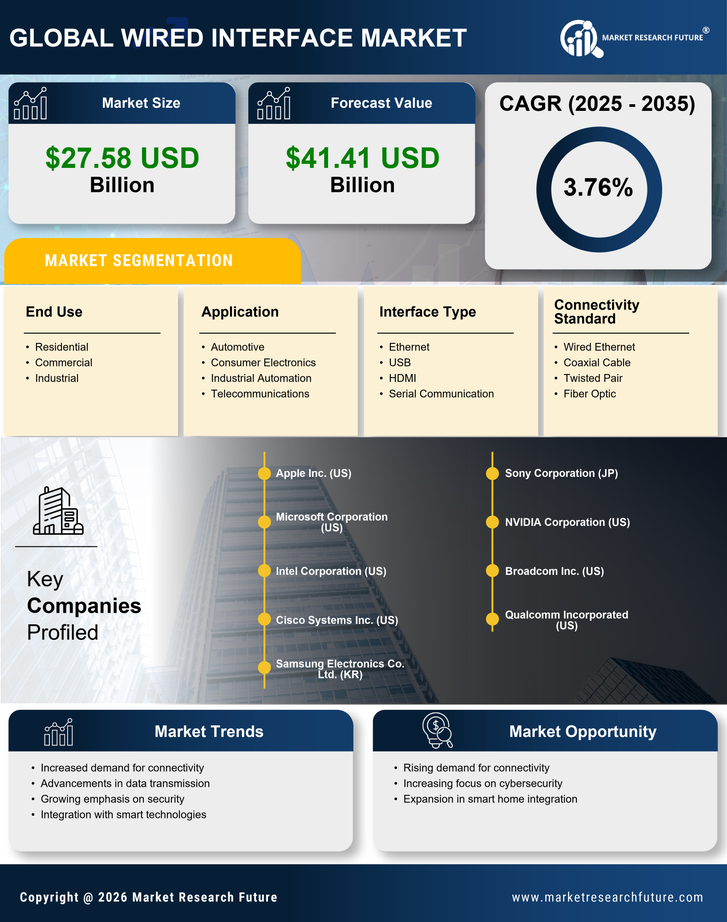
    • Automobile
    • Électronique grand public
    • Automatisation industrielle
    • Télécommunications
  • Marché des interfaces filaires par type d'interface (milliards USD, 2020-2034)
    • Ethernet
    • USB
    • HDMI
    • Communication série
  • Marché des interfaces filaires par utilisation finale (milliards USD, 2020-2034)
    • Résidentiel
    • Commercial
    • Industriel
  • Marché des interfaces filaires par norme de connectivité (milliards USD, 2020-2034)
    • Ethernet filaire
    • Câble coaxial
    • Paire torsadée
    • Fibre optique
  • Marché des interfaces filaires par région (milliards USD, 2020-2034)
    • Amérique du Nord
    • Europe
    • Amérique du Sud
    • Asie-Pacifique
    • Moyen-Orient et Afrique

Perspectives régionales du marché des interfaces filaires (milliards USD, 2020-2034)

  • Perspectives de l'Amérique du Nord (milliards USD, 2020-2034)
    • Marché des interfaces filaires en Amérique du Nord par type d'application
      • Automobile
      • Électronique grand public
      • Automatisation industrielle
      • Télécommunications
    • Marché des interfaces filaires en Amérique du Nord par type d'interface
      • Ethernet
      • USB
      • HDMI
      • Communication série
    • Marché des interfaces filaires en Amérique du Nord par type d'utilisation finale
      • Résidentiel
      • Commercial
      • Industriel
    • Marché des interfaces filaires en Amérique du Nord par type de norme de connectivité
      • Ethernet filaire
      • Câble coaxial
      • Paire torsadée
      • Fibre optique
    • Marché des interfaces filaires en Amérique du Nord par type régional
      • États-Unis
      • Canada
    • Perspectives des États-Unis (milliards USD, 2020-2034)
    • Marché des interfaces filaires aux États-Unis par type d'application
      • Automobile
      • Électronique grand public
      • Automatisation industrielle
      • Télécommunications
    • Marché des interfaces filaires aux États-Unis par type d'interface
      • Ethernet
      • USB
      • HDMI
      • Communication série
    • Marché des interfaces filaires aux États-Unis par type d'utilisation finale
      • Résidentiel
      • Commercial
      • Industriel
    • Marché des interfaces filaires aux États-Unis par type de norme de connectivité
      • Ethernet filaire
      • Câble coaxial
      • Paire torsadée
      • Fibre optique
    • Perspectives du CANADA (milliards USD, 2020-2034)
    • Marché des interfaces filaires au CANADA par type d'application
      • Automobile
      • Électronique grand public
      • Automatisation industrielle
      • Télécommunications
    • Marché des interfaces filaires au CANADA par type d'interface
      • Ethernet
      • USB
      • HDMI
      • Communication série
    • Marché des interfaces filaires au CANADA par type d'utilisation finale
      • Résidentiel
      • Commercial
      • Industriel
    • Marché des interfaces filaires au CANADA par type de norme de connectivité
      • Ethernet filaire
      • Câble coaxial
      • Paire torsadée
      • Fibre optique
    • Perspectives de l'Europe (milliards USD, 2020-2034)
      • Marché des interfaces filaires en Europe par type d'application
        • Automobile
        • Électronique grand public
        • Automatisation industrielle
        • Télécommunications
      • Marché des interfaces filaires en Europe par type d'interface
        • Ethernet
        • USB
        • HDMI
        • Communication série
      • Marché des interfaces filaires en Europe par type d'utilisation finale
        • Résidentiel
        • Commercial
        • Industriel
      • Marché des interfaces filaires en Europe par type de norme de connectivité
        • Ethernet filaire
        • Câble coaxial
        • Paire torsadée
        • Fibre optique
      • Marché des interfaces filaires en Europe par type régional
        • Allemagne
        • Royaume-Uni
        • France
        • Russie
        • Italie
        • Espagne
        • Reste de l'Europe
      • Perspectives de l'ALLEMAGNE (milliards USD, 2020-2034)
      • Marché des interfaces filaires en ALLEMAGNE par type d'application
        • Automobile
        • Électronique grand public
        • Automatisation industrielle
        • Télécommunications
      • Marché des interfaces filaires en ALLEMAGNE par type d'interface
        • Ethernet
        • USB
        • HDMI
        • Communication série
      • Marché des interfaces filaires en ALLEMAGNE par type d'utilisation finale
        • Résidentiel
        • Commercial
        • Industriel
      • Marché des interfaces filaires en ALLEMAGNE par type de norme de connectivité
        • Ethernet filaire
        • Câble coaxial
        • Paire torsadée
        • Fibre optique
      • Perspectives du ROYAUME-UNI (milliards USD, 2020-2034)
      • Marché des interfaces filaires au ROYAUME-UNI par type d'application
        • Automobile
        • Électronique grand public
        • Automatisation industrielle
        • Télécommunications
      • Marché des interfaces filaires au ROYAUME-UNI par type d'interface
        • Ethernet
        • USB
        • HDMI
        • Communication série
      • Marché des interfaces filaires au ROYAUME-UNI par type d'utilisation finale
        • Résidentiel
        • Commercial
        • Industriel
      • Marché des interfaces filaires au ROYAUME-UNI par type de norme de connectivité
        • Ethernet filaire
        • Câble coaxial
        • Paire torsadée
        • Fibre optique
      • Perspectives de la FRANCE (milliards USD, 2020-2034)
      • Marché des interfaces filaires en FRANCE par type d'application
        • Automobile
        • Électronique grand public
        • Automatisation industrielle
        • Télécommunications
      • Marché des interfaces filaires en FRANCE par type d'interface
        • Ethernet
        • USB
        • HDMI
        • Communication série
      • Marché des interfaces filaires en FRANCE par type d'utilisation finale
        • Résidentiel
        • Commercial
        • Industriel
      • Marché des interfaces filaires en FRANCE par type de norme de connectivité
        • Ethernet filaire
        • Câble coaxial
        • Paire torsadée
        • Fibre optique
      • Perspectives de la RUSSIE (milliards USD, 2020-2034)
      • Marché des interfaces filaires en RUSSIE par type d'application
        • Automobile
        • Électronique grand public
        • Automatisation industrielle
        • Télécommunications
      • Marché des interfaces filaires en RUSSIE par type d'interface
        • Ethernet
        • USB
        • HDMI
        • Communication série
      • Marché des interfaces filaires en RUSSIE par type d'utilisation finale
        • Résidentiel
        • Commercial
        • Industriel
      • Marché des interfaces filaires en RUSSIE par type de norme de connectivité
        • Ethernet filaire
        • Câble coaxial
        • Paire torsadée
        • Fibre optique
      • Perspectives de l'ITALIE (milliards USD, 2020-2034)
      • Marché des interfaces filaires en ITALIE par type d'application
        • Automobile
        • Électronique grand public
        • Automatisation industrielle
        • Télécommunications
      • Marché des interfaces filaires en ITALIE par type d'interface
        • Ethernet
        • USB
        • HDMI
        • Communication série
      • Marché des interfaces filaires en ITALIE par type d'utilisation finale
        • Résidentiel
        • Commercial
        • Industriel
      • Marché des interfaces filaires en ITALIE par type de norme de connectivité
        • Ethernet filaire
        • Câble coaxial
        • Paire torsadée
        • Fibre optique
      • Perspectives de l'ESPAGNE (milliards USD, 2020-2034)
      • Marché des interfaces filaires en ESPAGNE par type d'application
        • Automobile
        • Électronique grand public
        • Automatisation industrielle
        • Télécommunications
      • Marché des interfaces filaires en ESPAGNE par type d'interface
        • Ethernet
        • USB
        • HDMI
        • Communication série
      • Marché des interfaces filaires en ESPAGNE par type d'utilisation finale
        • Résidentiel
        • Commercial
        • Industriel
      • Marché des interfaces filaires en ESPAGNE par type de norme de connectivité
        • Ethernet filaire
        • Câble coaxial
        • Paire torsadée
        • Fibre optique
      • Perspectives du RESTE DE L'EUROPE (milliards USD, 2020-2034)
      • Marché des interfaces filaires dans le RESTE DE L'EUROPE par type d'application
        • Automobile
        • Électronique grand public
        • Automatisation industrielle
        • Télécommunications
      • Marché des interfaces filaires dans le RESTE DE L'EUROPE par type d'interface
        • Ethernet
        • USB
        • HDMI
        • Communication série
      • Marché des interfaces filaires dans le RESTE DE L'EUROPE par type d'utilisation finale
        • Résidentiel
        • Commercial
        • Industriel
      • Marché des interfaces filaires dans le RESTE DE L'EUROPE par type de norme de connectivité
        • Ethernet filaire
        • Câble coaxial
        • Paire torsadée
        • Fibre optique
      • Perspectives de l'APAC (milliards USD, 2020-2034)
        • Marché des interfaces filaires en APAC par type d'application
          • Automobile
          • Électronique grand public
          • Automatisation industrielle
          • Télécommunications
        • Marché des interfaces filaires en APAC par type d'interface
          • Ethernet
          • USB
          • HDMI
          • Communication série
        • Marché des interfaces filaires en APAC par type d'utilisation finale
          • Résidentiel
          • Commercial
          • Industriel
        • Marché des interfaces filaires en APAC par type de norme de connectivité
          • Ethernet filaire
          • Câble coaxial
          • Paire torsadée
          • Fibre optique
        • Marché des interfaces filaires en APAC par type régional
          • Chine
          • Inde
          • Japon
          • Corée du Sud
          • Malaisie
          • Thaïlande
          • Indonésie
          • Reste de l'APAC
        • Perspectives de la CHINE (milliards USD, 2020-2034)
        • Marché des interfaces filaires en CHINE par type d'application
          • Automobile
          • Électronique grand public
          • Automatisation industrielle
          • Télécommunications
        • Marché des interfaces filaires en CHINE par type d'interface
          • Ethernet
          • USB
          • HDMI
          • Communication série
        • Marché des interfaces filaires en CHINE par type d'utilisation finale
          • Résidentiel
          • Commercial
          • Industriel
        • Marché des interfaces filaires en CHINE par type de norme de connectivité
          • Ethernet filaire
          • Câble coaxial
          • Paire torsadée
          • Fibre optique
        • Perspectives de l'INDIE (milliards USD, 2020-2034)
        • Marché des interfaces filaires en INDIE par type d'application
          • Automobile
          • Électronique grand public
          • Automatisation industrielle
          • Télécommunications
        • Marché des interfaces filaires en INDIE par type d'interface
          • Ethernet
          • USB
          • HDMI
          • Communication série
        • Marché des interfaces filaires en INDIE par type d'utilisation finale
          • Résidentiel
          • Commercial
          • Industriel
        • Marché des interfaces filaires en INDIE par type de norme de connectivité
          • Ethernet filaire
          • Câble coaxial
          • Paire torsadée
          • Fibre optique
        • Perspectives du JAPON (milliards USD, 2020-2034)
        • Marché des interfaces filaires au JAPON par type d'application
          • Automobile
          • Électronique grand public
          • Automatisation industrielle
          • Télécommunications
        • Marché des interfaces filaires au JAPON par type d'interface
          • Ethernet
          • USB
          • HDMI
          • Communication série
        • Marché des interfaces filaires au JAPON par type d'utilisation finale
          • Résidentiel
          • Commercial
          • Industriel
        • Marché des interfaces filaires au JAPON par type de norme de connectivité
          • Ethernet filaire
          • Câble coaxial
          • Paire torsadée
          • Fibre optique
        • Perspectives de la CORÉE DU SUD (milliards USD, 2020-2034)
        • Marché des interfaces filaires en CORÉE DU SUD par type d'application
          • Automobile
          • Électronique grand public
          • Automatisation industrielle
          • Télécommunications
        • Marché des interfaces filaires en CORÉE DU SUD par type d'interface
          • Ethernet
          • USB
          • HDMI
          • Communication série
        • Marché des interfaces filaires en CORÉE DU SUD par type d'utilisation finale
          • Résidentiel
          • Commercial
          • Industriel
        • Marché des interfaces filaires en CORÉE DU SUD par type de norme de connectivité
          • Ethernet filaire
          • Câble coaxial
          • Paire torsadée
          • Fibre optique
        • Perspectives de la MALAYSIE (milliards USD, 2020-2034)
        • Marché des interfaces filaires en MALAYSIE par type d'application
          • Automobile
          • Électronique grand public
          • Automatisation industrielle
          • Télécommunications
        • Marché des interfaces filaires en MALAYSIE par type d'interface
          • Ethernet
          • USB
          • HDMI
          • Communication série
        • Marché des interfaces filaires en MALAYSIE par type d'utilisation finale
          • Résidentiel
          • Commercial
          • Industriel
        • Marché des interfaces filaires en MALAYSIE par type de norme de connectivité
          • Ethernet filaire
          • Câble coaxial
          • Paire torsadée
          • Fibre optique
        • Perspectives de la THAÏLANDE (milliards USD, 2020-2034)
        • Marché des interfaces filaires en THAÏLANDE par type d'application
          • Automobile
          • Électronique grand public
          • Automatisation industrielle
          • Télécommunications
        • Marché des interfaces filaires en THAÏLANDE par type d'interface
          • Ethernet
          • USB
          • HDMI
          • Communication série
        • Marché des interfaces filaires en THAÏLANDE par type d'utilisation finale
          • Résidentiel
          • Commercial
          • Industriel
        • Marché des interfaces filaires en THAÏLANDE par type de norme de connectivité
          • Ethernet filaire
          • Câble coaxial
          • Paire torsadée
          • Fibre optique
        • Perspectives de l'INDONÉSIE (milliards USD, 2020-2034)
        • Marché des interfaces filaires en INDONÉSIE par type d'application
          • Automobile
          • Électronique grand public
          • Automatisation industrielle
          • Télécommunications
        • Marché des interfaces filaires en INDONÉSIE par type d'interface
          • Ethernet
          • USB
          • HDMI
          • Communication série
        • Marché des interfaces filaires en INDONÉSIE par type d'utilisation finale
          • Résidentiel
          • Commercial
          • Industriel
        • Marché des interfaces filaires en INDONÉSIE par type de norme de connectivité
          • Ethernet filaire
          • Câble coaxial
          • Paire torsadée
          • Fibre optique
        • Perspectives du RESTE DE L'APAC (milliards USD, 2020-2034)
        • Marché des interfaces filaires dans le RESTE DE L'APAC par type d'application
          • Automobile
          • Électronique grand public
          • Automatisation industrielle
          • Télécommunications
        • Marché des interfaces filaires dans le RESTE DE L'APAC par type d'interface
          • Ethernet
          • USB
          • HDMI
          • Communication série
        • Marché des interfaces filaires dans le RESTE DE L'APAC par type d'utilisation finale
          • Résidentiel
          • Commercial
          • Industriel
        • Marché des interfaces filaires dans le RESTE DE L'APAC par type de norme de connectivité
          • Ethernet filaire
          • Câble coaxial
          • Paire torsadée
          • Fibre optique
        • Perspectives de l'Amérique du Sud (milliards USD, 2020-2034)
          • Marché des interfaces filaires en Amérique du Sud par type d'application
            • Automobile
            • Électronique grand public
            • Automatisation industrielle
            • Télécommunications
          • Marché des interfaces filaires en Amérique du Sud par type d'interface
            • Ethernet
            • USB
            • HDMI
            • Communication série
          • Marché des interfaces filaires en Amérique du Sud par type d'utilisation finale
            • Résidentiel
            • Commercial
            • Industriel
          • Marché des interfaces filaires en Amérique du Sud par type de norme de connectivité
            • Ethernet filaire
            • Câble coaxial
            • Paire torsadée
            • Fibre optique
          • Marché des interfaces filaires en Amérique du Sud par type régional
            • Brésil
            • Mexique
            • Argentine
            • Reste de l'Amérique du Sud
          • Perspectives du BRÉSIL (milliards USD, 2020-2034)
          • Marché des interfaces filaires au BRÉSIL par type d'application
            • Automobile
            • Électronique grand public
            • Automatisation industrielle
            • Télécommunications
          • Marché des interfaces filaires au BRÉSIL par type d'interface
            • Ethernet
            • USB
            • HDMI
            • Communication série
          • Marché des interfaces filaires au BRÉSIL par type d'utilisation finale
            • Résidentiel
            • Commercial
            • Industriel
          • Marché des interfaces filaires au BRÉSIL par type de norme de connectivité
            • Ethernet filaire
            • Câble coaxial
            • Paire torsadée
            • Fibre optique
          • Perspectives du MEXIQUE (milliards USD, 2020-2034)
          • Marché des interfaces filaires au MEXIQUE par type d'application
            • Automobile
            • Électronique grand public
            • Automatisation industrielle
            • Télécommunications
          • Marché des interfaces filaires au MEXIQUE par type d'interface
            • Ethernet
            • USB
            • HDMI
            • Communication série
          • Marché des interfaces filaires au MEXIQUE par type d'utilisation finale
            • Résidentiel
            • Commercial
            • Industriel
          • Marché des interfaces filaires au MEXIQUE par type de norme de connectivité
            • Ethernet filaire
            • Câble coaxial
            • Paire torsadée
            • Fibre optique
          • Perspectives de l'ARGENTINE (milliards USD, 2020-2034)
          • Marché des interfaces filaires en ARGENTINE par type d'application
            • Automobile
            • Électronique grand public
            • Automatisation industrielle
            • Télécommunications
          • Marché des interfaces filaires en ARGENTINE par type d'interface
            • Ethernet
            • USB
            • HDMI
            • Communication série
          • Marché des interfaces filaires en ARGENTINE par type d'utilisation finale
            • Résidentiel
            • Commercial
            • Industriel
          • Marché des interfaces filaires en ARGENTINE par type de norme de connectivité
            • Ethernet filaire
            • Câble coaxial
            • Paire torsadée
            • Fibre optique
          • Perspectives du RESTE DE L'AMÉRIQUE DU SUD (milliards USD, 2020-2034)
          • Marché des interfaces filaires dans le RESTE DE L'AMÉRIQUE DU SUD par type d'application
            • Automobile
            • Électronique grand public
            • Automatisation industrielle
            • Télécommunications
          • Marché des interfaces filaires dans le RESTE DE L'AMÉRIQUE DU SUD par type d'interface
            • Ethernet
            • USB
            • HDMI
            • Communication série
          • Marché des interfaces filaires dans le RESTE DE L'AMÉRIQUE DU SUD par type d'utilisation finale
            • Résidentiel
            • Commercial
            • Industriel
          • Marché des interfaces filaires dans le RESTE DE L'AMÉRIQUE DU SUD par type de norme de connectivité
            • Ethernet filaire
            • Câble coaxial
            • Paire torsadée
            • Fibre optique
          • Perspectives de la MEA (milliards USD, 2020-2034)
            • Marché des interfaces filaires en MEA par type d'application
              • Automobile
              • Électronique grand public
              • Automatisation industrielle
              • Télécommunications
            • Marché des interfaces filaires en MEA par type d'interface
              • Ethernet
              • USB
              • HDMI
              • Communication série
            • Marché des interfaces filaires en MEA par type d'utilisation finale
              • Résidentiel
              • Commercial
              • Industriel
            • Marché des interfaces filaires en MEA par type de norme de connectivité
              • Ethernet filaire
              • Câble coaxial
              • Paire torsadée
              • Fibre optique
            • Marché des interfaces filaires en MEA par type régional
              • Pays du CCG
              • Afrique du Sud
              • Reste de la MEA
            • Perspectives des PAYS DU CCG (milliards USD, 2020-2034)
            • Marché des interfaces filaires dans les PAYS DU CCG par type d'application
              • Automobile
              • Électronique grand public
              • Automatisation industrielle
              • Télécommunications
            • Marché des interfaces filaires dans les PAYS DU CCG par type d'interface
              • Ethernet
              • USB
              • HDMI
              • Communication série
            • Marché des interfaces filaires dans les PAYS DU CCG par type d'utilisation finale
              • Résidentiel
              • Commercial
              • Industriel
            • Marché des interfaces filaires dans les PAYS DU CCG par type de norme de connectivité
              • Ethernet filaire
              • Câble coaxial
              • Paire torsadée
              • Fibre optique
            • Perspectives de l'AFRIQUE DU SUD (milliards USD, 2020-2034)
            • Marché des interfaces filaires en AFRIQUE DU SUD par type d'application
              • Automobile
              • Électronique grand public
              • Automatisation industrielle
              • Télécommunications
            • Marché des interfaces filaires en AFRIQUE DU SUD par type d'interface
              • Ethernet
              • USB
              • HDMI
              • Communication série
            • Marché des interfaces filaires en AFRIQUE DU SUD par type d'utilisation finale
              • Résidentiel
              • Commercial
              • Industriel
            • Marché des interfaces filaires en AFRIQUE DU SUD par type de norme de connectivité
              • Ethernet filaire
              • Câble coaxial
              • Paire torsadée
              • Fibre optique
            • Perspectives du RESTE DE LA MEA (milliards USD, 2020-2034)
            • Marché des interfaces filaires dans le RESTE DE LA MEA par type d'application
              • Automobile
              • Électronique grand public
              • Automatisation industrielle
              • Télécommunications
            • Marché des interfaces filaires dans le RESTE DE LA MEA par type d'interface
              • Ethernet
              • USB
              • HDMI
              • Communication série
            • Marché des interfaces filaires dans le RESTE DE LA MEA par type d'utilisation finale
              • Résidentiel
              • Commercial
              • Industriel
            • Marché des interfaces filaires dans le RESTE DE LA MEA par type de norme de connectivité
              • Ethernet filaire
              • Câble coaxial
              • Paire torsadée
              • Fibre optique

Compare Licence

×
Features License Type
Single User Multiuser License Enterprise User
Price $4,950 $5,950 $7,250
Maximum User Access Limit 1 User Upto 10 Users Unrestricted Access Throughout the Organization
Free Customization
Direct Access to Analyst
Deliverable Format
Platform Access
Discount on Next Purchase 10% 15% 15%
Printable Versions