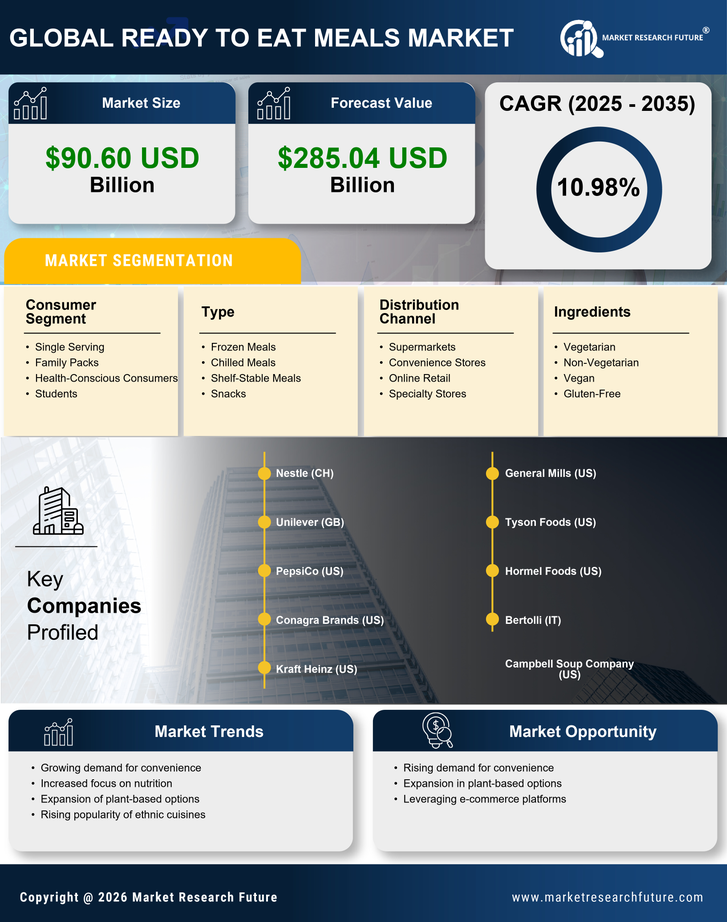
Request Free Sample ×

Kindly complete the form below to receive a free sample of this Report

* Please use a valid business email

Leading companies partner with us for data-driven Insights

clients tt-cursor
Hero Background

MarchĂ© des repas prĂȘts Ă  consommer

ID: MRFR/FnB/1447-HCR
110 Pages
Snehal Singh
Last Updated: April 06, 2026

Rapport d'Ă©tude de marchĂ© sur les repas prĂȘts Ă  consommer : Par type de produit (Repas congelĂ©s, Repas rĂ©frigĂ©rĂ©s, Repas Ă  longue conservation, Snacks), Par canal de distribution (SupermarchĂ©s, Magasins de proximitĂ©, Vente en ligne, Magasins spĂ©cialisĂ©s), Par segment de consommateurs (Portion unique, Packs familiaux, Consommateurs soucieux de leur santĂ©, Étudiants), Par ingrĂ©dients (VĂ©gĂ©tarien, Non-vĂ©gĂ©tarien, VĂ©gan, Sans gluten) et par rĂ©gion (AmĂ©rique du Nord, Europe, AmĂ©rique du Sud, Asie-Pacifique, Moyen-Orient et Afrique) - PrĂ©visions jusqu'en 2035.

Partager
Download PDF ×

We do not share your information with anyone. However, we may send you emails based on your report interest from time to time. You may contact us at any time to opt-out.

Ready to Eat Meals Market Infographic
Purchase Options
  1. 1 SECTION I : RÉSUMÉ EXÉCUTIF ET POINTS CLÉS
    1. 1.1 RÉSUMÉ EXÉCUTIF
      1. 1.1.1 Vue d'ensemble du marché
      2. 1.1.2 Conclusions clés
      3. 1.1.3 Segmentation du marché
      4. 1.1.4 Paysage concurrentiel
      5. 1.1.5 Défis et opportunités
      6. 1.1.6 Perspectives futures
  2. 2 SECTION II : DÉLIMITATION, MÉTHODOLOGIE ET STRUCTURE DU MARCHÉ
    1. 2.1 INTRODUCTION AU MARCHÉ
      1. 2.1.1 Définition
      2. 2.1.2 Portée de l'étude
        1. 2.1.2.1 Objectif de recherche
        2. 2.1.2.2 HypothĂšse
        3. 2.1.2.3 Limitations
    2. 2.2 MÉTHODOLOGIE DE RECHERCHE
      1. 2.2.1 Vue d'ensemble
      2. 2.2.2 Exploration de données
      3. 2.2.3 Recherche secondaire
      4. 2.2.4 Recherche primaire
        1. 2.2.4.1 Interviews primaires et processus de collecte d'informations
        2. 2.2.4.2 Répartition des répondants principaux
      5. 2.2.5 ModÚle de prévision
      6. 2.2.6 Estimation de la taille du marché
        1. 2.2.6.1 Approche ascendante
        2. 2.2.6.2 Approche descendante
      7. 2.2.7 Triangulation des données
      8. 2.2.8 Validation
  3. 3 SECTION III : ANALYSE QUALITATIVE
    1. 3.1 DYNAMIQUE DU MARCHÉ
      1. 3.1.1 Vue d'ensemble
      2. 3.1.2 Facteurs moteurs
      3. 3.1.3 Contraintes
      4. 3.1.4 Opportunités
    2. 3.2 ANALYSE DES FACTEURS DU MARCHÉ
      1. 3.2.1 Analyse de la chaĂźne de valeur
      2. 3.2.2 Analyse des cinq forces de Porter
        1. 3.2.2.1 Pouvoir de négociation des fournisseurs
        2. 3.2.2.2 Pouvoir de négociation des acheteurs
        3. 3.2.2.3 Menace des nouveaux entrants
        4. 3.2.2.4 Menace des substituts
        5. 3.2.2.5 Intensité de la rivalité
      3. 3.2.3 Analyse de l'impact du COVID-19
        1. 3.2.3.1 Analyse de l'impact sur le marché
        2. 3.2.3.2 Impact régional
        3. 3.2.3.3 Analyse des opportunités et des menaces
  4. 4 SECTION IV : ANALYSE QUANTITATIVE
    1. 4.1 Alimentation, Boissons et Nutrition, PAR Type (milliards USD)
      1. 4.1.1 Repas congelés
      2. 4.1.2 Repas réfrigérés
      3. 4.1.3 Repas Ă  longue conservation
      4. 4.1.4 Snacks
    2. 4.2 Alimentation, Boissons et Nutrition, PAR Canal de distribution (milliards USD)
      1. 4.2.1 Supermarchés
      2. 4.2.2 Magasins de proximité
      3. 4.2.3 Vente en ligne
      4. 4.2.4 Magasins spécialisés
    3. 4.3 Alimentation, Boissons et Nutrition, PAR Segment de consommateurs (milliards USD)
      1. 4.3.1 Portions individuelles
      2. 4.3.2 Packs familiaux
      3. 4.3.3 Consommateurs soucieux de leur santé
      4. 4.3.4 Étudiants
    4. 4.4 Alimentation, Boissons et Nutrition, PAR Ingrédients (milliards USD)
      1. 4.4.1 Végétarien
      2. 4.4.2 Non-végétarien
      3. 4.4.3 Végan
      4. 4.4.4 Sans gluten
    5. 4.5 Alimentation, Boissons et Nutrition, PAR Région (milliards USD)
      1. 4.5.1 Amérique du Nord
        1. 4.5.1.1 États-Unis
        2. 4.5.1.2 Canada
      2. 4.5.2 Europe
        1. 4.5.2.1 Allemagne
        2. 4.5.2.2 Royaume-Uni
        3. 4.5.2.3 France
        4. 4.5.2.4 Russie
        5. 4.5.2.5 Italie
        6. 4.5.2.6 Espagne
        7. 4.5.2.7 Reste de l'Europe
      3. 4.5.3 APAC
        1. 4.5.3.1 Chine
        2. 4.5.3.2 Inde
        3. 4.5.3.3 Japon
        4. 4.5.3.4 Corée du Sud
        5. 4.5.3.5 Malaisie
        6. 4.5.3.6 ThaĂŻlande
        7. 4.5.3.7 Indonésie
        8. 4.5.3.8 Reste de l'APAC
      4. 4.5.4 Amérique du Sud
        1. 4.5.4.1 Brésil
        2. 4.5.4.2 Mexique
        3. 4.5.4.3 Argentine
        4. 4.5.4.4 Reste de l'Amérique du Sud
      5. 4.5.5 MEA
        1. 4.5.5.1 Pays du CCG
        2. 4.5.5.2 Afrique du Sud
        3. 4.5.5.3 Reste de la MEA
  5. 5 SECTION V : ANALYSE CONCURRENTIELLE
    1. 5.1 Paysage concurrentiel
      1. 5.1.1 Vue d'ensemble
      2. 5.1.2 Analyse concurrentielle
      3. 5.1.3 Analyse de la part de marché
      4. 5.1.4 Stratégie de croissance majeure dans l'Alimentation, Boissons et Nutrition
      5. 5.1.5 Évaluation comparative concurrentielle
      6. 5.1.6 Acteurs principaux en termes de nombre de développements dans l'Alimentation, Boissons et Nutrition
      7. 5.1.7 Développements clés et stratégies de croissance
        1. 5.1.7.1 Lancement de nouveaux produits/Déploiement de services
        2. 5.1.7.2 Fusions & Acquisitions
        3. 5.1.7.3 Coentreprises
      8. 5.1.8 Matrice financiĂšre des principaux acteurs
        1. 5.1.8.1 Ventes et résultat d'exploitation
        2. 5.1.8.2 Dépenses de R&D des principaux acteurs. 2023
    2. 5.2 Profils d'entreprise
      1. 5.2.1 Nestlé (CH)
        1. 5.2.1.1 Vue d'ensemble financiĂšre
        2. 5.2.1.2 Produits offerts
        3. 5.2.1.3 Développements clés
        4. 5.2.1.4 Analyse SWOT
        5. 5.2.1.5 Stratégies clés
      2. 5.2.2 Unilever (GB)
        1. 5.2.2.1 Vue d'ensemble financiĂšre
        2. 5.2.2.2 Produits offerts
        3. 5.2.2.3 Développements clés
        4. 5.2.2.4 Analyse SWOT
        5. 5.2.2.5 Stratégies clés
      3. 5.2.3 PepsiCo (US)
        1. 5.2.3.1 Vue d'ensemble financiĂšre
        2. 5.2.3.2 Produits offerts
        3. 5.2.3.3 Développements clés
        4. 5.2.3.4 Analyse SWOT
        5. 5.2.3.5 Stratégies clés
      4. 5.2.4 Conagra Brands (US)
        1. 5.2.4.1 Vue d'ensemble financiĂšre
        2. 5.2.4.2 Produits offerts
        3. 5.2.4.3 Développements clés
        4. 5.2.4.4 Analyse SWOT
        5. 5.2.4.5 Stratégies clés
      5. 5.2.5 Kraft Heinz (US)
        1. 5.2.5.1 Vue d'ensemble financiĂšre
        2. 5.2.5.2 Produits offerts
        3. 5.2.5.3 Développements clés
        4. 5.2.5.4 Analyse SWOT
        5. 5.2.5.5 Stratégies clés
      6. 5.2.6 General Mills (US)
        1. 5.2.6.1 Vue d'ensemble financiĂšre
        2. 5.2.6.2 Produits offerts
        3. 5.2.6.3 Développements clés
        4. 5.2.6.4 Analyse SWOT
        5. 5.2.6.5 Stratégies clés
      7. 5.2.7 Tyson Foods (US)
        1. 5.2.7.1 Vue d'ensemble financiĂšre
        2. 5.2.7.2 Produits offerts
        3. 5.2.7.3 Développements clés
        4. 5.2.7.4 Analyse SWOT
        5. 5.2.7.5 Stratégies clés
      8. 5.2.8 Hormel Foods (US)
        1. 5.2.8.1 Vue d'ensemble financiĂšre
        2. 5.2.8.2 Produits offerts
        3. 5.2.8.3 Développements clés
        4. 5.2.8.4 Analyse SWOT
        5. 5.2.8.5 Stratégies clés
      9. 5.2.9 Bertolli (IT)
        1. 5.2.9.1 Vue d'ensemble financiĂšre
        2. 5.2.9.2 Produits offerts
        3. 5.2.9.3 Développements clés
        4. 5.2.9.4 Analyse SWOT
        5. 5.2.9.5 Stratégies clés
      10. 5.2.10 Campbell Soup Company (US)
        1. 5.2.10.1 Vue d'ensemble financiĂšre
        2. 5.2.10.2 Produits offerts
        3. 5.2.10.3 Développements clés
        4. 5.2.10.4 Analyse SWOT
        5. 5.2.10.5 Stratégies clés
    3. 5.3 Annexe
      1. 5.3.1 Références
      2. 5.3.2 Rapports connexes
  6. 6 LISTE DES FIGURES
    1. 6.1 SYNOPSIS DU MARCHÉ
    2. 6.2 ANALYSE DU MARCHÉ EN AMÉRIQUE DU NORD
    3. 6.3 ANALYSE DU MARCHÉ AUX ÉTATS-UNIS PAR TYPE
    4. 6.4 ANALYSE DU MARCHÉ AUX ÉTATS-UNIS PAR CANAL DE DISTRIBUTION
    5. 6.5 ANALYSE DU MARCHÉ AUX ÉTATS-UNIS PAR SEGMENT DE CONSOMMATEURS
    6. 6.6 ANALYSE DU MARCHÉ AUX ÉTATS-UNIS PAR INGRÉDIENTS
    7. 6.7 ANALYSE DU MARCHÉ AU CANADA PAR TYPE
    8. 6.8 ANALYSE DU MARCHÉ AU CANADA PAR CANAL DE DISTRIBUTION
    9. 6.9 ANALYSE DU MARCHÉ AU CANADA PAR SEGMENT DE CONSOMMATEURS
    10. 6.10 ANALYSE DU MARCHÉ AU CANADA PAR INGRÉDIENTS
    11. 6.11 ANALYSE DU MARCHÉ EN EUROPE
    12. 6.12 ANALYSE DU MARCHÉ EN ALLEMAGNE PAR TYPE
    13. 6.13 ANALYSE DU MARCHÉ EN ALLEMAGNE PAR CANAL DE DISTRIBUTION
    14. 6.14 ANALYSE DU MARCHÉ EN ALLEMAGNE PAR SEGMENT DE CONSOMMATEURS
    15. 6.15 ANALYSE DU MARCHÉ EN ALLEMAGNE PAR INGRÉDIENTS
    16. 6.16 ANALYSE DU MARCHÉ AU ROYAUME-UNI PAR TYPE
    17. 6.17 ANALYSE DU MARCHÉ AU ROYAUME-UNI PAR CANAL DE DISTRIBUTION
    18. 6.18 ANALYSE DU MARCHÉ AU ROYAUME-UNI PAR SEGMENT DE CONSOMMATEURS
    19. 6.19 ANALYSE DU MARCHÉ AU ROYAUME-UNI PAR INGRÉDIENTS
    20. 6.20 ANALYSE DU MARCHÉ EN FRANCE PAR TYPE
    21. 6.21 ANALYSE DU MARCHÉ EN FRANCE PAR CANAL DE DISTRIBUTION
    22. 6.22 ANALYSE DU MARCHÉ EN FRANCE PAR SEGMENT DE CONSOMMATEURS
    23. 6.23 ANALYSE DU MARCHÉ EN FRANCE PAR INGRÉDIENTS
    24. 6.24 ANALYSE DU MARCHÉ EN RUSSIE PAR TYPE
    25. 6.25 ANALYSE DU MARCHÉ EN RUSSIE PAR CANAL DE DISTRIBUTION
    26. 6.26 ANALYSE DU MARCHÉ EN RUSSIE PAR SEGMENT DE CONSOMMATEURS
    27. 6.27 ANALYSE DU MARCHÉ EN RUSSIE PAR INGRÉDIENTS
    28. 6.28 ANALYSE DU MARCHÉ EN ITALIE PAR TYPE
    29. 6.29 ANALYSE DU MARCHÉ EN ITALIE PAR CANAL DE DISTRIBUTION
    30. 6.30 ANALYSE DU MARCHÉ EN ITALIE PAR SEGMENT DE CONSOMMATEURS
    31. 6.31 ANALYSE DU MARCHÉ EN ITALIE PAR INGRÉDIENTS
    32. 6.32 ANALYSE DU MARCHÉ EN ESPAGNE PAR TYPE
    33. 6.33 ANALYSE DU MARCHÉ EN ESPAGNE PAR CANAL DE DISTRIBUTION
    34. 6.34 ANALYSE DU MARCHÉ EN ESPAGNE PAR SEGMENT DE CONSOMMATEURS
    35. 6.35 ANALYSE DU MARCHÉ EN ESPAGNE PAR INGRÉDIENTS
    36. 6.36 ANALYSE DU MARCHÉ DANS LE RESTE DE L'EUROPE PAR TYPE
    37. 6.37 ANALYSE DU MARCHÉ DANS LE RESTE DE L'EUROPE PAR CANAL DE DISTRIBUTION
    38. 6.38 ANALYSE DU MARCHÉ DANS LE RESTE DE L'EUROPE PAR SEGMENT DE CONSOMMATEURS
    39. 6.39 ANALYSE DU MARCHÉ DANS LE RESTE DE L'EUROPE PAR INGRÉDIENTS
    40. 6.40 ANALYSE DU MARCHÉ EN APAC
    41. 6.41 ANALYSE DU MARCHÉ EN CHINE PAR TYPE
    42. 6.42 ANALYSE DU MARCHÉ EN CHINE PAR CANAL DE DISTRIBUTION
    43. 6.43 ANALYSE DU MARCHÉ EN CHINE PAR SEGMENT DE CONSOMMATEURS
    44. 6.44 ANALYSE DU MARCHÉ EN CHINE PAR INGRÉDIENTS
    45. 6.45 ANALYSE DU MARCHÉ EN INDE PAR TYPE
    46. 6.46 ANALYSE DU MARCHÉ EN INDE PAR CANAL DE DISTRIBUTION
    47. 6.47 ANALYSE DU MARCHÉ EN INDE PAR SEGMENT DE CONSOMMATEURS
    48. 6.48 ANALYSE DU MARCHÉ EN INDE PAR INGRÉDIENTS
    49. 6.49 ANALYSE DU MARCHÉ AU JAPON PAR TYPE
    50. 6.50 ANALYSE DU MARCHÉ AU JAPON PAR CANAL DE DISTRIBUTION
    51. 6.51 ANALYSE DU MARCHÉ AU JAPON PAR SEGMENT DE CONSOMMATEURS
    52. 6.52 ANALYSE DU MARCHÉ AU JAPON PAR INGRÉDIENTS
    53. 6.53 ANALYSE DU MARCHÉ EN CORÉE DU SUD PAR TYPE
    54. 6.54 ANALYSE DU MARCHÉ EN CORÉE DU SUD PAR CANAL DE DISTRIBUTION
    55. 6.55 ANALYSE DU MARCHÉ EN CORÉE DU SUD PAR SEGMENT DE CONSOMMATEURS
    56. 6.56 ANALYSE DU MARCHÉ EN CORÉE DU SUD PAR INGRÉDIENTS
    57. 6.57 ANALYSE DU MARCHÉ EN MALAYSIE PAR TYPE
    58. 6.58 ANALYSE DU MARCHÉ EN MALAYSIE PAR CANAL DE DISTRIBUTION
    59. 6.59 ANALYSE DU MARCHÉ EN MALAYSIE PAR SEGMENT DE CONSOMMATEURS
    60. 6.60 ANALYSE DU MARCHÉ EN MALAYSIE PAR INGRÉDIENTS
    61. 6.61 ANALYSE DU MARCHÉ EN THAÏLANDE PAR TYPE
    62. 6.62 ANALYSE DU MARCHÉ EN THAÏLANDE PAR CANAL DE DISTRIBUTION
    63. 6.63 ANALYSE DU MARCHÉ EN THAÏLANDE PAR SEGMENT DE CONSOMMATEURS
    64. 6.64 ANALYSE DU MARCHÉ EN THAÏLANDE PAR INGRÉDIENTS
    65. 6.65 ANALYSE DU MARCHÉ EN INDONÉSIE PAR TYPE
    66. 6.66 ANALYSE DU MARCHÉ EN INDONÉSIE PAR CANAL DE DISTRIBUTION
    67. 6.67 ANALYSE DU MARCHÉ EN INDONÉSIE PAR SEGMENT DE CONSOMMATEURS
    68. 6.68 ANALYSE DU MARCHÉ EN INDONÉSIE PAR INGRÉDIENTS
    69. 6.69 ANALYSE DU MARCHÉ DANS LE RESTE DE L'APAC PAR TYPE
    70. 6.70 ANALYSE DU MARCHÉ DANS LE RESTE DE L'APAC PAR CANAL DE DISTRIBUTION
    71. 6.71 ANALYSE DU MARCHÉ DANS LE RESTE DE L'APAC PAR SEGMENT DE CONSOMMATEURS
    72. 6.72 ANALYSE DU MARCHÉ DANS LE RESTE DE L'APAC PAR INGRÉDIENTS
    73. 6.73 ANALYSE DU MARCHÉ EN AMÉRIQUE DU SUD
    74. 6.74 ANALYSE DU MARCHÉ AU BRÉSIL PAR TYPE
    75. 6.75 ANALYSE DU MARCHÉ AU BRÉSIL PAR CANAL DE DISTRIBUTION
    76. 6.76 ANALYSE DU MARCHÉ AU BRÉSIL PAR SEGMENT DE CONSOMMATEURS
    77. 6.77 ANALYSE DU MARCHÉ AU BRÉSIL PAR INGRÉDIENTS
    78. 6.78 ANALYSE DU MARCHÉ AU MEXIQUE PAR TYPE
    79. 6.79 ANALYSE DU MARCHÉ AU MEXIQUE PAR CANAL DE DISTRIBUTION
    80. 6.80 ANALYSE DU MARCHÉ AU MEXIQUE PAR SEGMENT DE CONSOMMATEURS
    81. 6.81 ANALYSE DU MARCHÉ AU MEXIQUE PAR INGRÉDIENTS
    82. 6.82 ANALYSE DU MARCHÉ EN ARGENTINE PAR TYPE
    83. 6.83 ANALYSE DU MARCHÉ EN ARGENTINE PAR CANAL DE DISTRIBUTION
    84. 6.84 ANALYSE DU MARCHÉ EN ARGENTINE PAR SEGMENT DE CONSOMMATEURS
    85. 6.85 ANALYSE DU MARCHÉ EN ARGENTINE PAR INGRÉDIENTS
    86. 6.86 ANALYSE DU MARCHÉ DANS LE RESTE DE L'AMÉRIQUE DU SUD PAR TYPE
    87. 6.87 ANALYSE DU MARCHÉ DANS LE RESTE DE L'AMÉRIQUE DU SUD PAR CANAL DE DISTRIBUTION
    88. 6.88 ANALYSE DU MARCHÉ DANS LE RESTE DE L'AMÉRIQUE DU SUD PAR SEGMENT DE CONSOMMATEURS
    89. 6.89 ANALYSE DU MARCHÉ DANS LE RESTE DE L'AMÉRIQUE DU SUD PAR INGRÉDIENTS
    90. 6.90 ANALYSE DU MARCHÉ EN MEA
    91. 6.91 ANALYSE DU MARCHÉ DANS LES PAYS DU CCG PAR TYPE
    92. 6.92 ANALYSE DU MARCHÉ DANS LES PAYS DU CCG PAR CANAL DE DISTRIBUTION
    93. 6.93 ANALYSE DU MARCHÉ DANS LES PAYS DU CCG PAR SEGMENT DE CONSOMMATEURS
    94. 6.94 ANALYSE DU MARCHÉ DANS LES PAYS DU CCG PAR INGRÉDIENTS
    95. 6.95 ANALYSE DU MARCHÉ EN AFRIQUE DU SUD PAR TYPE
    96. 6.96 ANALYSE DU MARCHÉ EN AFRIQUE DU SUD PAR CANAL DE DISTRIBUTION
    97. 6.97 ANALYSE DU MARCHÉ EN AFRIQUE DU SUD PAR SEGMENT DE CONSOMMATEURS
    98. 6.98 ANALYSE DU MARCHÉ EN AFRIQUE DU SUD PAR INGRÉDIENTS
    99. 6.99 ANALYSE DU MARCHÉ DANS LE RESTE DE LA MEA PAR TYPE
    100. 6.100 ANALYSE DU MARCHÉ DANS LE RESTE DE LA MEA PAR CANAL DE DISTRIBUTION
    101. 6.101 ANALYSE DU MARCHÉ DANS LE RESTE DE LA MEA PAR SEGMENT DE CONSOMMATEURS
    102. 6.102 ANALYSE DU MARCHÉ DANS LE RESTE DE LA MEA PAR INGRÉDIENTS
    103. 6.103 CRITÈRES D'ACHAT CLÉS DES ALIMENTS, BOISSONS ET NUTRITION
    104. 6.104 PROCESSUS DE RECHERCHE DE MRFR
    105. 6.105 ANALYSE DRO DES ALIMENTS, BOISSONS ET NUTRITION
    106. 6.106 ANALYSE D'IMPACT DES FACTEURS : ALIMENTS, BOISSONS ET NUTRITION
    107. 6.107 ANALYSE D'IMPACT DES CONTRAINTES : ALIMENTS, BOISSONS ET NUTRITION
    108. 6.108 CHAÎNE D'APPROVISIONNEMENT / DE VALEUR : ALIMENTS, BOISSONS ET NUTRITION
    109. 6.109 ALIMENTS, BOISSONS ET NUTRITION, PAR TYPE, 2024 (% PART)
    110. 6.110 ALIMENTS, BOISSONS ET NUTRITION, PAR TYPE, 2024 À 2035 (milliards USD)
    111. 6.111 ALIMENTS, BOISSONS ET NUTRITION, PAR CANAL DE DISTRIBUTION, 2024 (% PART)
    112. 6.112 ALIMENTS, BOISSONS ET NUTRITION, PAR CANAL DE DISTRIBUTION, 2024 À 2035 (milliards USD)
    113. 6.113 ALIMENTS, BOISSONS ET NUTRITION, PAR SEGMENT DE CONSOMMATEURS, 2024 (% PART)
    114. 6.114 ALIMENTS, BOISSONS ET NUTRITION, PAR SEGMENT DE CONSOMMATEURS, 2024 À 2035 (milliards USD)
    115. 6.115 ALIMENTS, BOISSONS ET NUTRITION, PAR INGRÉDIENTS, 2024 (% PART)
    116. 6.116 ALIMENTS, BOISSONS ET NUTRITION, PAR INGRÉDIENTS, 2024 À 2035 (milliards USD)
    117. 6.117 ÉVALUATION DES PRINCIPAUX CONCURRENTS
  7. 7 LISTE DES TABLEAUX
    1. 7.1 LISTE DES HYPOTHÈSES
  8. 7.1.1
    1. 7.2 ESTIMATIONS DE TAILLE DU MARCHÉ EN AMÉRIQUE DU NORD ; PRÉVISIONS
      1. 7.2.1 PAR TYPE, 2025-2035 (milliards USD)
      2. 7.2.2 PAR CANAL DE DISTRIBUTION, 2025-2035 (milliards USD)
      3. 7.2.3 PAR SEGMENT DE CONSOMMATEURS, 2025-2035 (milliards USD)
      4. 7.2.4 PAR INGRÉDIENTS, 2025-2035 (milliards USD)
    2. 7.3 ESTIMATIONS DE TAILLE DU MARCHÉ AUX ÉTATS-UNIS ; PRÉVISIONS
      1. 7.3.1 PAR TYPE, 2025-2035 (milliards USD)
      2. 7.3.2 PAR CANAL DE DISTRIBUTION, 2025-2035 (milliards USD)
      3. 7.3.3 PAR SEGMENT DE CONSOMMATEURS, 2025-2035 (milliards USD)
      4. 7.3.4 PAR INGRÉDIENTS, 2025-2035 (milliards USD)
    3. 7.4 ESTIMATIONS DE TAILLE DU MARCHÉ AU CANADA ; PRÉVISIONS
      1. 7.4.1 PAR TYPE, 2025-2035 (milliards USD)
      2. 7.4.2 PAR CANAL DE DISTRIBUTION, 2025-2035 (milliards USD)
      3. 7.4.3 PAR SEGMENT DE CONSOMMATEURS, 2025-2035 (milliards USD)
      4. 7.4.4 PAR INGRÉDIENTS, 2025-2035 (milliards USD)
    4. 7.5 ESTIMATIONS DE TAILLE DU MARCHÉ EN EUROPE ; PRÉVISIONS
      1. 7.5.1 PAR TYPE, 2025-2035 (milliards USD)
      2. 7.5.2 PAR CANAL DE DISTRIBUTION, 2025-2035 (milliards USD)
      3. 7.5.3 PAR SEGMENT DE CONSOMMATEURS, 2025-2035 (milliards USD)
      4. 7.5.4 PAR INGRÉDIENTS, 2025-2035 (milliards USD)
    5. 7.6 ESTIMATIONS DE TAILLE DU MARCHÉ EN ALLEMAGNE ; PRÉVISIONS
      1. 7.6.1 PAR TYPE, 2025-2035 (milliards USD)
      2. 7.6.2 PAR CANAL DE DISTRIBUTION, 2025-2035 (milliards USD)
      3. 7.6.3 PAR SEGMENT DE CONSOMMATEURS, 2025-2035 (milliards USD)
      4. 7.6.4 PAR INGRÉDIENTS, 2025-2035 (milliards USD)
    6. 7.7 ESTIMATIONS DE TAILLE DU MARCHÉ AU ROYAUME-UNI ; PRÉVISIONS
      1. 7.7.1 PAR TYPE, 2025-2035 (milliards USD)
      2. 7.7.2 PAR CANAL DE DISTRIBUTION, 2025-2035 (milliards USD)
      3. 7.7.3 PAR SEGMENT DE CONSOMMATEURS, 2025-2035 (milliards USD)
      4. 7.7.4 PAR INGRÉDIENTS, 2025-2035 (milliards USD)
    7. 7.8 ESTIMATIONS DE TAILLE DU MARCHÉ EN FRANCE ; PRÉVISIONS
      1. 7.8.1 PAR TYPE, 2025-2035 (milliards USD)
      2. 7.8.2 PAR CANAL DE DISTRIBUTION, 2025-2035 (milliards USD)
      3. 7.8.3 PAR SEGMENT DE CONSOMMATEURS, 2025-2035 (milliards USD)
      4. 7.8.4 PAR INGRÉDIENTS, 2025-2035 (milliards USD)
    8. 7.9 ESTIMATIONS DE TAILLE DU MARCHÉ EN RUSSIE ; PRÉVISIONS
      1. 7.9.1 PAR TYPE, 2025-2035 (milliards USD)
      2. 7.9.2 PAR CANAL DE DISTRIBUTION, 2025-2035 (milliards USD)
      3. 7.9.3 PAR SEGMENT DE CONSOMMATEURS, 2025-2035 (milliards USD)
      4. 7.9.4 PAR INGRÉDIENTS, 2025-2035 (milliards USD)
    9. 7.10 ESTIMATIONS DE TAILLE DU MARCHÉ EN ITALIE ; PRÉVISIONS
      1. 7.10.1 PAR TYPE, 2025-2035 (milliards USD)
      2. 7.10.2 PAR CANAL DE DISTRIBUTION, 2025-2035 (milliards USD)
      3. 7.10.3 PAR SEGMENT DE CONSOMMATEURS, 2025-2035 (milliards USD)
      4. 7.10.4 PAR INGRÉDIENTS, 2025-2035 (milliards USD)
    10. 7.11 ESTIMATIONS DE TAILLE DU MARCHÉ EN ESPAGNE ; PRÉVISIONS
      1. 7.11.1 PAR TYPE, 2025-2035 (milliards USD)
      2. 7.11.2 PAR CANAL DE DISTRIBUTION, 2025-2035 (milliards USD)
      3. 7.11.3 PAR SEGMENT DE CONSOMMATEURS, 2025-2035 (milliards USD)
      4. 7.11.4 PAR INGRÉDIENTS, 2025-2035 (milliards USD)
    11. 7.12 ESTIMATIONS DE TAILLE DU MARCHÉ DANS LE RESTE DE L'EUROPE ; PRÉVISIONS
      1. 7.12.1 PAR TYPE, 2025-2035 (milliards USD)
      2. 7.12.2 PAR CANAL DE DISTRIBUTION, 2025-2035 (milliards USD)
      3. 7.12.3 PAR SEGMENT DE CONSOMMATEURS, 2025-2035 (milliards USD)
      4. 7.12.4 PAR INGRÉDIENTS, 2025-2035 (milliards USD)
    12. 7.13 ESTIMATIONS DE TAILLE DU MARCHÉ EN APAC ; PRÉVISIONS
      1. 7.13.1 PAR TYPE, 2025-2035 (milliards USD)
      2. 7.13.2 PAR CANAL DE DISTRIBUTION, 2025-2035 (milliards USD)
      3. 7.13.3 PAR SEGMENT DE CONSOMMATEURS, 2025-2035 (milliards USD)
      4. 7.13.4 PAR INGRÉDIENTS, 2025-2035 (milliards USD)
    13. 7.14 ESTIMATIONS DE TAILLE DU MARCHÉ EN CHINE ; PRÉVISIONS
      1. 7.14.1 PAR TYPE, 2025-2035 (milliards USD)
      2. 7.14.2 PAR CANAL DE DISTRIBUTION, 2025-2035 (milliards USD)
      3. 7.14.3 PAR SEGMENT DE CONSOMMATEURS, 2025-2035 (milliards USD)
      4. 7.14.4 PAR INGRÉDIENTS, 2025-2035 (milliards USD)
    14. 7.15 ESTIMATIONS DE TAILLE DU MARCHÉ EN INDE ; PRÉVISIONS
      1. 7.15.1 PAR TYPE, 2025-2035 (milliards USD)
      2. 7.15.2 PAR CANAL DE DISTRIBUTION, 2025-2035 (milliards USD)
      3. 7.15.3 PAR SEGMENT DE CONSOMMATEURS, 2025-2035 (milliards USD)
      4. 7.15.4 PAR INGRÉDIENTS, 2025-2035 (milliards USD)
    15. 7.16 ESTIMATIONS DE TAILLE DU MARCHÉ AU JAPON ; PRÉVISIONS
      1. 7.16.1 PAR TYPE, 2025-2035 (milliards USD)
      2. 7.16.2 PAR CANAL DE DISTRIBUTION, 2025-2035 (milliards USD)
      3. 7.16.3 PAR SEGMENT DE CONSOMMATEURS, 2025-2035 (milliards USD)
      4. 7.16.4 PAR INGRÉDIENTS, 2025-2035 (milliards USD)
    16. 7.17 ESTIMATIONS DE TAILLE DU MARCHÉ EN CORÉE DU SUD ; PRÉVISIONS
      1. 7.17.1 PAR TYPE, 2025-2035 (milliards USD)
      2. 7.17.2 PAR CANAL DE DISTRIBUTION, 2025-2035 (milliards USD)
      3. 7.17.3 PAR SEGMENT DE CONSOMMATEURS, 2025-2035 (milliards USD)
      4. 7.17.4 PAR INGRÉDIENTS, 2025-2035 (milliards USD)
    17. 7.18 ESTIMATIONS DE TAILLE DU MARCHÉ EN MALAYSIE ; PRÉVISIONS
      1. 7.18.1 PAR TYPE, 2025-2035 (milliards USD)
      2. 7.18.2 PAR CANAL DE DISTRIBUTION, 2025-2035 (milliards USD)
      3. 7.18.3 PAR SEGMENT DE CONSOMMATEURS, 2025-2035 (milliards USD)
      4. 7.18.4 PAR INGRÉDIENTS, 2025-2035 (milliards USD)
    18. 7.19 ESTIMATIONS DE TAILLE DU MARCHÉ EN THAÏLANDE ; PRÉVISIONS
      1. 7.19.1 PAR TYPE, 2025-2035 (milliards USD)
      2. 7.19.2 PAR CANAL DE DISTRIBUTION, 2025-2035 (milliards USD)
      3. 7.19.3 PAR SEGMENT DE CONSOMMATEURS, 2025-2035 (milliards USD)
      4. 7.19.4 PAR INGRÉDIENTS, 2025-2035 (milliards USD)
    19. 7.20 ESTIMATIONS DE TAILLE DU MARCHÉ EN INDONÉSIE ; PRÉVISIONS
      1. 7.20.1 PAR TYPE, 2025-2035 (milliards USD)
      2. 7.20.2 PAR CANAL DE DISTRIBUTION, 2025-2035 (milliards USD)
      3. 7.20.3 PAR SEGMENT DE CONSOMMATEURS, 2025-2035 (milliards USD)
      4. 7.20.4 PAR INGRÉDIENTS, 2025-2035 (milliards USD)
    20. 7.21 ESTIMATIONS DE TAILLE DU MARCHÉ DANS LE RESTE DE L'APAC ; PRÉVISIONS
      1. 7.21.1 PAR TYPE, 2025-2035 (milliards USD)
      2. 7.21.2 PAR CANAL DE DISTRIBUTION, 2025-2035 (milliards USD)
      3. 7.21.3 PAR SEGMENT DE CONSOMMATEURS, 2025-2035 (milliards USD)
      4. 7.21.4 PAR INGRÉDIENTS, 2025-2035 (milliards USD)
    21. 7.22 ESTIMATIONS DE TAILLE DU MARCHÉ EN AMÉRIQUE DU SUD ; PRÉVISIONS
      1. 7.22.1 PAR TYPE, 2025-2035 (milliards USD)
      2. 7.22.2 PAR CANAL DE DISTRIBUTION, 2025-2035 (milliards USD)
      3. 7.22.3 PAR SEGMENT DE CONSOMMATEURS, 2025-2035 (milliards USD)
      4. 7.22.4 PAR INGRÉDIENTS, 2025-2035 (milliards USD)
    22. 7.23 ESTIMATIONS DE TAILLE DU MARCHÉ AU BRÉSIL ; PRÉVISIONS
      1. 7.23.1 PAR TYPE, 2025-2035 (milliards USD)
      2. 7.23.2 PAR CANAL DE DISTRIBUTION, 2025-2035 (milliards USD)
      3. 7.23.3 PAR SEGMENT DE CONSOMMATEURS, 2025-2035 (milliards USD)
      4. 7.23.4 PAR INGRÉDIENTS, 2025-2035 (milliards USD)
    23. 7.24 ESTIMATIONS DE TAILLE DU MARCHÉ AU MEXIQUE ; PRÉVISIONS
      1. 7.24.1 PAR TYPE, 2025-2035 (milliards USD)
      2. 7.24.2 PAR CANAL DE DISTRIBUTION, 2025-2035 (milliards USD)
      3. 7.24.3 PAR SEGMENT DE CONSOMMATEURS, 2025-2035 (milliards USD)
      4. 7.24.4 PAR INGRÉDIENTS, 2025-2035 (milliards USD)
    24. 7.25 ESTIMATIONS DE TAILLE DU MARCHÉ EN ARGENTINE ; PRÉVISIONS
      1. 7.25.1 PAR TYPE, 2025-2035 (milliards USD)
      2. 7.25.2 PAR CANAL DE DISTRIBUTION, 2025-2035 (milliards USD)
      3. 7.25.3 PAR SEGMENT DE CONSOMMATEURS, 2025-2035 (milliards USD)
      4. 7.25.4 PAR INGRÉDIENTS, 2025-2035 (milliards USD)
    25. 7.26 ESTIMATIONS DE TAILLE DU MARCHÉ DANS LE RESTE DE L'AMÉRIQUE DU SUD ; PRÉVISIONS
      1. 7.26.1 PAR TYPE, 2025-2035 (milliards USD)
      2. 7.26.2 PAR CANAL DE DISTRIBUTION, 2025-2035 (milliards USD)
      3. 7.26.3 PAR SEGMENT DE CONSOMMATEURS, 2025-2035 (milliards USD)
      4. 7.26.4 PAR INGRÉDIENTS, 2025-2035 (milliards USD)
    26. 7.27 ESTIMATIONS DE TAILLE DU MARCHÉ EN MEA ; PRÉVISIONS
      1. 7.27.1 PAR TYPE, 2025-2035 (milliards USD)
      2. 7.27.2 PAR CANAL DE DISTRIBUTION, 2025-2035 (milliards USD)
      3. 7.27.3 PAR SEGMENT DE CONSOMMATEURS, 2025-2035 (milliards USD)
      4. 7.27.4 PAR INGRÉDIENTS, 2025-2035 (milliards USD)
    27. 7.28 ESTIMATIONS DE TAILLE DU MARCHÉ DANS LES PAYS DU CCG ; PRÉVISIONS
      1. 7.28.1 PAR TYPE, 2025-2035 (milliards USD)
      2. 7.28.2 PAR CANAL DE DISTRIBUTION, 2025-2035 (milliards USD)
      3. 7.28.3 PAR SEGMENT DE CONSOMMATEURS, 2025-2035 (milliards USD)
      4. 7.28.4 PAR INGRÉDIENTS, 2025-2035 (milliards USD)
    28. 7.29 ESTIMATIONS DE TAILLE DU MARCHÉ EN AFRIQUE DU SUD ; PRÉVISIONS
      1. 7.29.1 PAR TYPE, 2025-2035 (milliards USD)
      2. 7.29.2 PAR CANAL DE DISTRIBUTION, 2025-2035 (milliards USD)
      3. 7.29.3 PAR SEGMENT DE CONSOMMATEURS, 2025-2035 (milliards USD)
      4. 7.29.4 PAR INGRÉDIENTS, 2025-2035 (milliards USD)
    29. 7.30 ESTIMATIONS DE TAILLE DU MARCHÉ DANS LE RESTE DE LA MEA ; PRÉVISIONS
      1. 7.30.1 PAR TYPE, 2025-2035 (milliards USD)
      2. 7.30.2 PAR CANAL DE DISTRIBUTION, 2025-2035 (milliards USD)
      3. 7.30.3 PAR SEGMENT DE CONSOMMATEURS, 2025-2035 (milliards USD)
      4. 7.30.4 PAR INGRÉDIENTS, 2025-2035 (milliards USD)
    30. 7.31 LANCEMENT DE PRODUIT/DÉVELOPPEMENT/APPROBATION
  9. 7.31.1
    1. 7.32 ACQUISITION/PARTENARIAT
  10. 7.32.1

Segmentation du marchĂ© des repas prĂȘts Ă  consommer


MarchĂ© des repas prĂȘts Ă  consommer par type de produit (milliards USD, 2019-2035)

Repas congelés

Repas réfrigérés

Repas Ă  longue conservation

Collations


MarchĂ© des repas prĂȘts Ă  consommer par canal de distribution (milliards USD, 2019-2035)

Supermarchés

Magasins de proximité

Vente en ligne

Magasins spécialisés


MarchĂ© des repas prĂȘts Ă  consommer par segment de consommateurs (milliards USD, 2019-2035)

Portions individuelles

Packs familiaux

Consommateurs soucieux de leur santé

Étudiants


MarchĂ© des repas prĂȘts Ă  consommer par ingrĂ©dients (milliards USD, 2019-2035)

Végétarien

Non-végétarien

Vegan

Sans gluten


MarchĂ© des repas prĂȘts Ă  consommer par rĂ©gion (milliards USD, 2019-2035)

Amérique du Nord

Europe

Amérique du Sud

Asie-Pacifique

Moyen-Orient et Afrique


Perspectives rĂ©gionales du marchĂ© des repas prĂȘts Ă  consommer (milliards USD, 2019-2035)


Perspectives de l'Amérique du Nord (milliards USD, 2019-2035)

MarchĂ© des repas prĂȘts Ă  consommer en AmĂ©rique du Nord par type de produit

Repas congelés

Repas réfrigérés

Repas Ă  longue conservation

Collations

MarchĂ© des repas prĂȘts Ă  consommer en AmĂ©rique du Nord par type de canal de distribution

Supermarchés

Magasins de proximité

Vente en ligne

Magasins spécialisés

MarchĂ© des repas prĂȘts Ă  consommer en AmĂ©rique du Nord par type de segment de consommateurs

Portions individuelles

Packs familiaux

Consommateurs soucieux de leur santé

Étudiants

MarchĂ© des repas prĂȘts Ă  consommer en AmĂ©rique du Nord par type d'ingrĂ©dients

Végétarien

Non-végétarien

Vegan

Sans gluten

MarchĂ© des repas prĂȘts Ă  consommer en AmĂ©rique du Nord par type rĂ©gional

États-Unis

Canada

Perspectives des États-Unis (milliards USD, 2019-2035)

MarchĂ© des repas prĂȘts Ă  consommer aux États-Unis par type de produit

Repas congelés

Repas réfrigérés

Repas Ă  longue conservation

Collations

MarchĂ© des repas prĂȘts Ă  consommer aux États-Unis par type de canal de distribution

Supermarchés

Magasins de proximité

Vente en ligne

Magasins spécialisés

MarchĂ© des repas prĂȘts Ă  consommer aux États-Unis par type de segment de consommateurs

Portions individuelles

Packs familiaux

Consommateurs soucieux de leur santé

Étudiants

MarchĂ© des repas prĂȘts Ă  consommer aux États-Unis par type d'ingrĂ©dients

Végétarien

Non-végétarien

Vegan

Sans gluten

Perspectives du CANADA (milliards USD, 2019-2035)

MarchĂ© des repas prĂȘts Ă  consommer au CANADA par type de produit

Repas congelés

Repas réfrigérés

Repas Ă  longue conservation

Collations

MarchĂ© des repas prĂȘts Ă  consommer au CANADA par type de canal de distribution

Supermarchés

Magasins de proximité

Vente en ligne

Magasins spécialisés

MarchĂ© des repas prĂȘts Ă  consommer au CANADA par type de segment de consommateurs

Portions individuelles

Packs familiaux

Consommateurs soucieux de leur santé

Étudiants

MarchĂ© des repas prĂȘts Ă  consommer au CANADA par type d'ingrĂ©dients

Végétarien

Non-végétarien

Vegan

Sans gluten

Perspectives de l'Europe (milliards USD, 2019-2035)

MarchĂ© des repas prĂȘts Ă  consommer en Europe par type de produit

Repas congelés

Repas réfrigérés

Repas Ă  longue conservation

Collations

MarchĂ© des repas prĂȘts Ă  consommer en Europe par type de canal de distribution

Supermarchés

Magasins de proximité

Vente en ligne

Magasins spécialisés

MarchĂ© des repas prĂȘts Ă  consommer en Europe par type de segment de consommateurs

Portions individuelles

Packs familiaux

Consommateurs soucieux de leur santé

Étudiants

MarchĂ© des repas prĂȘts Ă  consommer en Europe par type d'ingrĂ©dients

Végétarien

Non-végétarien

Vegan

Sans gluten

MarchĂ© des repas prĂȘts Ă  consommer en Europe par type rĂ©gional

Allemagne

Royaume-Uni

France

Russie

Italie

Espagne

Reste de l'Europe

Perspectives de l'ALLEMAGNE (milliards USD, 2019-2035)

MarchĂ© des repas prĂȘts Ă  consommer en ALLEMAGNE par type de produit

Repas congelés

Repas réfrigérés

Repas Ă  longue conservation

Collations

MarchĂ© des repas prĂȘts Ă  consommer en ALLEMAGNE par type de canal de distribution

Supermarchés

Magasins de proximité

Vente en ligne

Magasins spécialisés

MarchĂ© des repas prĂȘts Ă  consommer en ALLEMAGNE par type de segment de consommateurs

Portions individuelles

Packs familiaux

Consommateurs soucieux de leur santé

Étudiants

MarchĂ© des repas prĂȘts Ă  consommer en ALLEMAGNE par type d'ingrĂ©dients

Végétarien

Non-végétarien

Vegan

Sans gluten

Perspectives du ROYAUME-UNI (milliards USD, 2019-2035)

MarchĂ© des repas prĂȘts Ă  consommer au ROYAUME-UNI par type de produit

Repas congelés

Repas réfrigérés

Repas Ă  longue conservation

Collations

MarchĂ© des repas prĂȘts Ă  consommer au ROYAUME-UNI par type de canal de distribution

Supermarchés

Magasins de proximité

Vente en ligne

Magasins spécialisés

MarchĂ© des repas prĂȘts Ă  consommer au ROYAUME-UNI par type de segment de consommateurs

Portions individuelles

Packs familiaux

Consommateurs soucieux de leur santé

Étudiants

MarchĂ© des repas prĂȘts Ă  consommer au ROYAUME-UNI par type d'ingrĂ©dients

Végétarien

Non-végétarien

Vegan

Sans gluten

Perspectives de la FRANCE (milliards USD, 2019-2035)

MarchĂ© des repas prĂȘts Ă  consommer en FRANCE par type de produit

Repas congelés

Repas réfrigérés

Repas Ă  longue conservation

Collations

MarchĂ© des repas prĂȘts Ă  consommer en FRANCE par type de canal de distribution

Supermarchés

Magasins de proximité

Vente en ligne

Magasins spécialisés

MarchĂ© des repas prĂȘts Ă  consommer en FRANCE par type de segment de consommateurs

Portions individuelles

Packs familiaux

Consommateurs soucieux de leur santé

Étudiants

MarchĂ© des repas prĂȘts Ă  consommer en FRANCE par type d'ingrĂ©dients

Végétarien

Non-végétarien

Vegan

Sans gluten

Perspectives de la RUSSIE (milliards USD, 2019-2035)

MarchĂ© des repas prĂȘts Ă  consommer en RUSSIE par type de produit

Repas congelés

Repas réfrigérés

Repas Ă  longue conservation

Collations

MarchĂ© des repas prĂȘts Ă  consommer en RUSSIE par type de canal de distribution

Supermarchés

Magasins de proximité

Vente en ligne

Magasins spécialisés

MarchĂ© des repas prĂȘts Ă  consommer en RUSSIE par type de segment de consommateurs

Portions individuelles

Packs familiaux

Consommateurs soucieux de leur santé

Étudiants

MarchĂ© des repas prĂȘts Ă  consommer en RUSSIE par type d'ingrĂ©dients

Végétarien

Non-végétarien

Vegan

Sans gluten

Perspectives de l'ITALIE (milliards USD, 2019-2035)

MarchĂ© des repas prĂȘts Ă  consommer en ITALIE par type de produit

Repas congelés

Repas réfrigérés

Repas Ă  longue conservation

Collations

MarchĂ© des repas prĂȘts Ă  consommer en ITALIE par type de canal de distribution

Supermarchés

Magasins de proximité

Vente en ligne

Magasins spécialisés

MarchĂ© des repas prĂȘts Ă  consommer en ITALIE par type de segment de consommateurs

Portions individuelles

Packs familiaux

Consommateurs soucieux de leur santé

Étudiants

MarchĂ© des repas prĂȘts Ă  consommer en ITALIE par type d'ingrĂ©dients

Végétarien

Non-végétarien

Vegan

Sans gluten

Perspectives de l'ESPAGNE (milliards USD, 2019-2035)

MarchĂ© des repas prĂȘts Ă  consommer en ESPAGNE par type de produit

Repas congelés

Repas réfrigérés

Repas Ă  longue conservation

Collations

MarchĂ© des repas prĂȘts Ă  consommer en ESPAGNE par type de canal de distribution

Supermarchés

Magasins de proximité

Vente en ligne

Magasins spécialisés

MarchĂ© des repas prĂȘts Ă  consommer en ESPAGNE par type de segment de consommateurs

Portions individuelles

Packs familiaux

Consommateurs soucieux de leur santé

Étudiants

MarchĂ© des repas prĂȘts Ă  consommer en ESPAGNE par type d'ingrĂ©dients

Végétarien

Non-végétarien

Vegan

Sans gluten

Perspectives du RESTE DE L'EUROPE (milliards USD, 2019-2035)

MarchĂ© des repas prĂȘts Ă  consommer dans le RESTE DE L'EUROPE par type de produit

Repas congelés

Repas réfrigérés

Repas Ă  longue conservation

Collations

MarchĂ© des repas prĂȘts Ă  consommer dans le RESTE DE L'EUROPE par type de canal de distribution

Supermarchés

Magasins de proximité

Vente en ligne

Magasins spécialisés

MarchĂ© des repas prĂȘts Ă  consommer dans le RESTE DE L'EUROPE par type de segment de consommateurs

Portions individuelles

Packs familiaux

Consommateurs soucieux de leur santé

Étudiants

MarchĂ© des repas prĂȘts Ă  consommer dans le RESTE DE L'EUROPE par type d'ingrĂ©dients

Végétarien

Non-végétarien

Vegan

Sans gluten

Perspectives de l'APAC (milliards USD, 2019-2035)

MarchĂ© des repas prĂȘts Ă  consommer en APAC par type de produit

Repas congelés

Repas réfrigérés

Repas Ă  longue conservation

Collations

MarchĂ© des repas prĂȘts Ă  consommer en APAC par type de canal de distribution

Supermarchés

Magasins de proximité

Vente en ligne

Magasins spécialisés

MarchĂ© des repas prĂȘts Ă  consommer en APAC par type de segment de consommateurs

Portions individuelles

Packs familiaux

Consommateurs soucieux de leur santé

Étudiants

MarchĂ© des repas prĂȘts Ă  consommer en APAC par type d'ingrĂ©dients

Végétarien

Non-végétarien

Vegan

Sans gluten

MarchĂ© des repas prĂȘts Ă  consommer en APAC par type rĂ©gional

Chine

Inde

Japon

Corée du Sud

Malaisie

ThaĂŻlande

Indonésie

Reste de l'APAC

Perspectives de la CHINE (milliards USD, 2019-2035)

MarchĂ© des repas prĂȘts Ă  consommer en CHINE par type de produit

Repas congelés

Repas réfrigérés

Repas Ă  longue conservation

Collations

MarchĂ© des repas prĂȘts Ă  consommer en CHINE par type de canal de distribution

Supermarchés

Magasins de proximité

Vente en ligne

Magasins spécialisés

MarchĂ© des repas prĂȘts Ă  consommer en CHINE par type de segment de consommateurs

Portions individuelles

Packs familiaux

Consommateurs soucieux de leur santé

Étudiants

MarchĂ© des repas prĂȘts Ă  consommer en CHINE par type d'ingrĂ©dients

Végétarien

Non-végétarien

Vegan

Sans gluten

Perspectives de l'INDIE (milliards USD, 2019-2035)

MarchĂ© des repas prĂȘts Ă  consommer en INDIE par type de produit

Repas congelés

Repas réfrigérés

Repas Ă  longue conservation

Collations

MarchĂ© des repas prĂȘts Ă  consommer en INDIE par type de canal de distribution

Supermarchés

Magasins de proximité

Vente en ligne

Magasins spécialisés

MarchĂ© des repas prĂȘts Ă  consommer en INDIE par type de segment de consommateurs

Portions individuelles

Packs familiaux

Consommateurs soucieux de leur santé

Étudiants

MarchĂ© des repas prĂȘts Ă  consommer en INDIE par type d'ingrĂ©dients

Végétarien

Non-végétarien

Vegan

Sans gluten

Perspectives du JAPON (milliards USD, 2019-2035)

MarchĂ© des repas prĂȘts Ă  consommer au JAPON par type de produit

Repas congelés

Repas réfrigérés

Repas Ă  longue conservation

Collations

MarchĂ© des repas prĂȘts Ă  consommer au JAPON par type de canal de distribution

Supermarchés

Magasins de proximité

Vente en ligne

Magasins spécialisés

MarchĂ© des repas prĂȘts Ă  consommer au JAPON par type de segment de consommateurs

Portions individuelles

Packs familiaux

Consommateurs soucieux de leur santé

Étudiants

MarchĂ© des repas prĂȘts Ă  consommer au JAPON par type d'ingrĂ©dients

Végétarien

Non-végétarien

Vegan

Sans gluten

Perspectives de la CORÉE DU SUD (milliards USD, 2019-2035)

MarchĂ© des repas prĂȘts Ă  consommer en CORÉE DU SUD par type de produit

Repas congelés

Repas réfrigérés

Repas Ă  longue conservation

Collations

MarchĂ© des repas prĂȘts Ă  consommer en CORÉE DU SUD par type de canal de distribution

Supermarchés

Magasins de proximité

Vente en ligne

Magasins spécialisés

MarchĂ© des repas prĂȘts Ă  consommer en CORÉE DU SUD par type de segment de consommateurs

Portions individuelles

Packs familiaux

Consommateurs soucieux de leur santé

Étudiants

MarchĂ© des repas prĂȘts Ă  consommer en CORÉE DU SUD par type d'ingrĂ©dients

Végétarien

Non-végétarien

Vegan

Sans gluten

Perspectives de la MALAYSIE (milliards USD, 2019-2035)

MarchĂ© des repas prĂȘts Ă  consommer en MALAYSIE par type de produit

Repas congelés

Repas réfrigérés

Repas Ă  longue conservation

Collations

MarchĂ© des repas prĂȘts Ă  consommer en MALAYSIE par type de canal de distribution

Supermarchés

Magasins de proximité

Vente en ligne

Magasins spécialisés

MarchĂ© des repas prĂȘts Ă  consommer en MALAYSIE par type de segment de consommateurs

Portions individuelles

Packs familiaux

Consommateurs soucieux de leur santé

Étudiants

MarchĂ© des repas prĂȘts Ă  consommer en MALAYSIE par type d'ingrĂ©dients

Végétarien

Non-végétarien

Vegan

Sans gluten

Perspectives de la THAÏLANDE (milliards USD, 2019-2035)

MarchĂ© des repas prĂȘts Ă  consommer en THAÏLANDE par type de produit

Repas congelés

Repas réfrigérés

Repas Ă  longue conservation

Collations

MarchĂ© des repas prĂȘts Ă  consommer en THAÏLANDE par type de canal de distribution

Supermarchés

Magasins de proximité

Vente en ligne

Magasins spécialisés

MarchĂ© des repas prĂȘts Ă  consommer en THAÏLANDE par type de segment de consommateurs

Portions individuelles

Packs familiaux

Consommateurs soucieux de leur santé

Étudiants

MarchĂ© des repas prĂȘts Ă  consommer en THAÏLANDE par type d'ingrĂ©dients

Végétarien

Non-végétarien

Vegan

Sans gluten

Perspectives de l'INDONÉSIE (milliards USD, 2019-2035)

MarchĂ© des repas prĂȘts Ă  consommer en INDONÉSIE par type de produit

Repas congelés

Repas réfrigérés

Repas Ă  longue conservation

Collations

MarchĂ© des repas prĂȘts Ă  consommer en INDONÉSIE par type de canal de distribution

Supermarchés

Magasins de proximité

Vente en ligne

Magasins spécialisés

MarchĂ© des repas prĂȘts Ă  consommer en INDONÉSIE par type de segment de consommateurs

Portions individuelles

Packs familiaux

Consommateurs soucieux de leur santé

Étudiants

MarchĂ© des repas prĂȘts Ă  consommer en INDONÉSIE par type d'ingrĂ©dients

Végétarien

Non-végétarien

Vegan

Sans gluten

Perspectives du RESTE DE L'APAC (milliards USD, 2019-2035)

MarchĂ© des repas prĂȘts Ă  consommer dans le RESTE DE L'APAC par type de produit

Repas congelés

Repas réfrigérés

Repas Ă  longue conservation

Collations

MarchĂ© des repas prĂȘts Ă  consommer dans le RESTE DE L'APAC par type de canal de distribution

Supermarchés

Magasins de proximité

Vente en ligne

Magasins spécialisés

MarchĂ© des repas prĂȘts Ă  consommer dans le RESTE DE L'APAC par type de segment de consommateurs

Portions individuelles

Packs familiaux

Consommateurs soucieux de leur santé

Étudiants

MarchĂ© des repas prĂȘts Ă  consommer dans le RESTE DE L'APAC par type d'ingrĂ©dients

Végétarien

Non-végétarien

Vegan

Sans gluten

Perspectives de l'Amérique du Sud (milliards USD, 2019-2035)

MarchĂ© des repas prĂȘts Ă  consommer en AmĂ©rique du Sud par type de produit

Repas congelés

Repas réfrigérés

Repas Ă  longue conservation

Collations

MarchĂ© des repas prĂȘts Ă  consommer en AmĂ©rique du Sud par type de canal de distribution

Supermarchés

Magasins de proximité

Vente en ligne

Magasins spécialisés

MarchĂ© des repas prĂȘts Ă  consommer en AmĂ©rique du Sud par type de segment de consommateurs

Portions individuelles

Packs familiaux

Consommateurs soucieux de leur santé

Étudiants

MarchĂ© des repas prĂȘts Ă  consommer en AmĂ©rique du Sud par type d'ingrĂ©dients

Végétarien

Non-végétarien

Vegan

Sans gluten

MarchĂ© des repas prĂȘts Ă  consommer par type rĂ©gional (milliards USD, 2019-2035)

Brésil

Mexique

Argentine

Reste de l'Amérique du Sud

Perspectives du BRÉSIL (milliards USD, 2019-2035)

MarchĂ© des repas prĂȘts Ă  consommer au BRÉSIL par type de produit

Repas congelés

Repas réfrigérés

Repas Ă  longue conservation

Collations

MarchĂ© des repas prĂȘts Ă  consommer au BRÉSIL par type de canal de distribution

Supermarchés

Magasins de proximité

Vente en ligne

Magasins spécialisés

MarchĂ© des repas prĂȘts Ă  consommer au BRÉSIL par type de segment de consommateurs

Portions individuelles

Packs familiaux

Consommateurs soucieux de leur santé

Étudiants

MarchĂ© des repas prĂȘts Ă  consommer au BRÉSIL par type d'ingrĂ©dients

Végétarien

Non-végétarien

Vegan

Sans gluten

Perspectives du MEXIQUE (milliards USD, 2019-2035)

MarchĂ© des repas prĂȘts Ă  consommer au MEXIQUE par type de produit

Repas congelés

Repas réfrigérés

Repas Ă  longue conservation

Collations

MarchĂ© des repas prĂȘts Ă  consommer au MEXIQUE par type de canal de distribution

Supermarchés

Magasins de proximité

Vente en ligne

Magasins spécialisés

MarchĂ© des repas prĂȘts Ă  consommer au MEXIQUE par type de segment de consommateurs

Portions individuelles

Packs familiaux

Consommateurs soucieux de leur santé

Étudiants

MarchĂ© des repas prĂȘts Ă  consommer au MEXIQUE par type d'ingrĂ©dients

Végétarien

Non-végétarien

Vegan

Sans gluten

Perspectives de l'ARGENTINE (milliards USD, 2019-2035)

MarchĂ© des repas prĂȘts Ă  consommer en ARGENTINE par type de produit

Repas congelés

Repas réfrigérés

Repas Ă  longue conservation

Collations

MarchĂ© des repas prĂȘts Ă  consommer en ARGENTINE par type de canal de distribution

Supermarchés

Magasins de proximité

Vente en ligne

Magasins spécialisés

MarchĂ© des repas prĂȘts Ă  consommer en ARGENTINE par type de segment de consommateurs

Portions individuelles

Packs familiaux

Consommateurs soucieux de leur santé

Étudiants

MarchĂ© des repas prĂȘts Ă  consommer en ARGENTINE par type d'ingrĂ©dients

Végétarien

Non-végétarien

Vegan

Sans gluten

Perspectives du RESTE DE L'AMÉRIQUE DU SUD (milliards USD, 2019-2035)

MarchĂ© des repas prĂȘts Ă  consommer dans le RESTE DE L'AMÉRIQUE DU SUD par type de produit

Repas congelés

Repas réfrigérés

Repas Ă  longue conservation

Collations

MarchĂ© des repas prĂȘts Ă  consommer dans le RESTE DE L'AMÉRIQUE DU SUD par type de canal de distribution

Supermarchés

Magasins de proximité

Vente en ligne

Magasins spécialisés

MarchĂ© des repas prĂȘts Ă  consommer dans le RESTE DE L'AMÉRIQUE DU SUD par type de segment de consommateurs

Portions individuelles

Packs familiaux

Consommateurs soucieux de leur santé

Étudiants

MarchĂ© des repas prĂȘts Ă  consommer dans le RESTE DE L'AMÉRIQUE DU SUD par type d'ingrĂ©dients

Végétarien

Non-végétarien

Vegan

Sans gluten

Perspectives du MEA (milliards USD, 2019-2035)

MarchĂ© des repas prĂȘts Ă  consommer en MEA par type de produit

Repas congelés

Repas réfrigérés

Repas Ă  longue conservation

Collations

MarchĂ© des repas prĂȘts Ă  consommer en MEA par type de canal de distribution

Supermarchés

Magasins de proximité

Vente en ligne

Magasins spécialisés

MarchĂ© des repas prĂȘts Ă  consommer en MEA par type de segment de consommateurs

Portions individuelles

Packs familiaux

Consommateurs soucieux de leur santé

Étudiants

MarchĂ© des repas prĂȘts Ă  consommer en MEA par type d'ingrĂ©dients

Végétarien

Non-végétarien

Vegan

Sans gluten

MarchĂ© des repas prĂȘts Ă  consommer par type rĂ©gional (milliards USD, 2019-2035)

Pays du CCG

Afrique du Sud

Reste du MEA

Perspectives des PAYS DU CCG (milliards USD, 2019-2035)

MarchĂ© des repas prĂȘts Ă  consommer dans les PAYS DU CCG par type de produit

Repas congelés

Repas réfrigérés

Repas Ă  longue conservation

Collations

MarchĂ© des repas prĂȘts Ă  consommer dans les PAYS DU CCG par type de canal de distribution

Supermarchés

Magasins de proximité

Vente en ligne

Magasins spécialisés

MarchĂ© des repas prĂȘts Ă  consommer dans les PAYS DU CCG par type de segment de consommateurs

Portions individuelles

Packs familiaux

Consommateurs soucieux de leur santé

Étudiants

MarchĂ© des repas prĂȘts Ă  consommer dans les PAYS DU CCG par type d'ingrĂ©dients

Végétarien

Non-végétarien

Vegan

Sans gluten

Perspectives de l'AFRIQUE DU SUD (milliards USD, 2019-2035)

MarchĂ© des repas prĂȘts Ă  consommer en AFRIQUE DU SUD par type de produit

Repas congelés

Repas réfrigérés

Repas Ă  longue conservation

Collations

MarchĂ© des repas prĂȘts Ă  consommer en AFRIQUE DU SUD par type de canal de distribution

Supermarchés

Magasins de proximité

Vente en ligne

Magasins spécialisés

MarchĂ© des repas prĂȘts Ă  consommer en AFRIQUE DU SUD par type de segment de consommateurs

Portions individuelles

Packs familiaux

Consommateurs soucieux de leur santé

Étudiants

MarchĂ© des repas prĂȘts Ă  consommer en AFRIQUE DU SUD par type d'ingrĂ©dients

Végétarien

Non-végétarien

Vegan

Sans gluten

Perspectives du RESTE DU MEA (milliards USD, 2019-2035)

MarchĂ© des repas prĂȘts Ă  consommer dans le RESTE DU MEA par type de produit

Repas congelés

Repas réfrigérés

Repas Ă  longue conservation

Collations

MarchĂ© des repas prĂȘts Ă  consommer dans le RESTE DU MEA par type de canal de distribution

Supermarchés

Magasins de proximité

Vente en ligne

Magasins spécialisés

MarchĂ© des repas prĂȘts Ă  consommer dans le RESTE DU MEA par type de segment de consommateurs

Portions individuelles

Packs familiaux

Consommateurs soucieux de leur santé

Étudiants

MarchĂ© des repas prĂȘts Ă  consommer dans le RESTE DU MEA par type d'ingrĂ©dients

Végétarien

Non-végétarien

Vegan

Sans gluten


Compare Licence

×
Features License Type
Single User Multiuser License Enterprise User
Price $4,950 $5,950 $7,250
Maximum User Access Limit 1 User Upto 10 Users Unrestricted Access Throughout the Organization
Free Customization ✓ ✓ ✓
Direct Access to Analyst ✓ ✓ ✓
Deliverable Format ✓ ✓ ✓
Platform Access ✗ ✗ ✓
Discount on Next Purchase 10% 15% 15%
Printable Versions ✗ ✗ ✓