Segmentation du marché des semi-conducteurs et de l’électronique
Semi-conducteurs et électronique par application (milliard USD, 2025-2035)
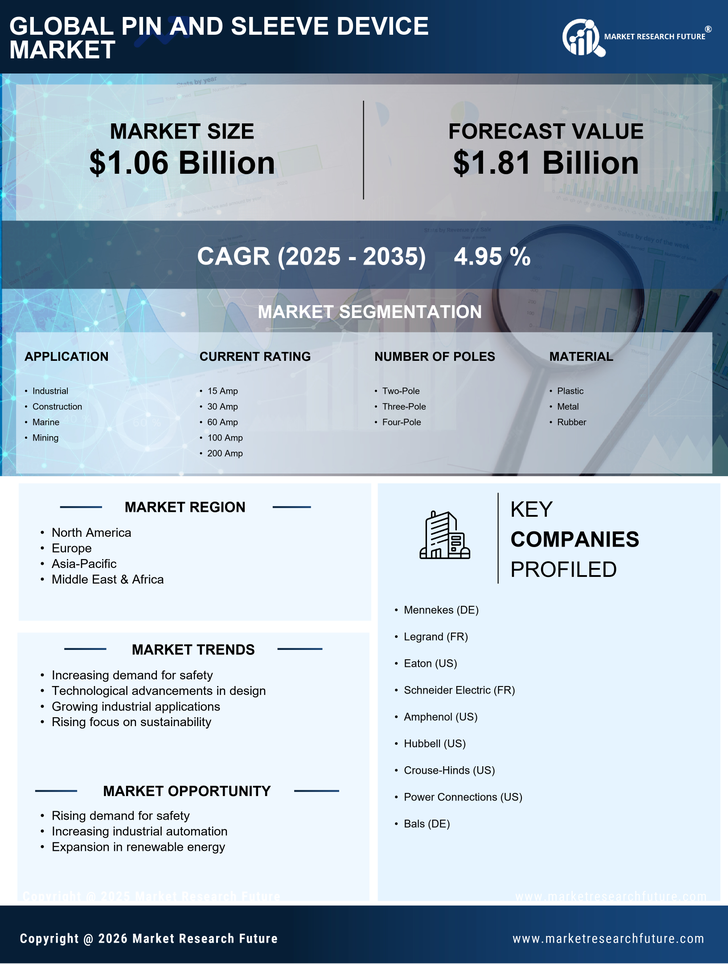
- Industriel
- Construction
- Marin
- Exploitation minière
Semi-conducteurs et électronique par intensité nominale (milliards USD, 2025-2035)
- Amplificateur 15
- Amplificateur 30
- Amplificateur 60
- Amplificateur 100
- Amplificateur 200
Semi-conducteurs et électronique par nombre de pôles (USD milliards, 2025-2035)
- Bipolaire
- Tripolaire
- Quadripolaire
Semi-conducteurs et électronique par matériau (USD milliards, 2025-2035)
- Plastique
- Métal
- Caoutchouc