Request Free Sample ×

Kindly complete the form below to receive a free sample of this Report

* Please use a valid business email

Leading companies partner with us for data-driven Insights

clients tt-cursor
Hero Background

Sur le marché de la cogénération d'énergie thermique et électrique

ID: MRFR/EnP/34852-HCR
128 Pages
Priya Nagrale
Last Updated: April 06, 2026

Rapport d'étude de marché sur la cogénération à réseau : par technologie (moteur à combustion interne, turbine à gaz, microturbine, pile à hydrogène, moteur Stirling), par application (résidentielle, commerciale, industrielle), par type de combustible (gaz naturel, biomasse, charbon, énergie renouvelable, chaleur résiduelle), par configuration de système (chaleur unique, chaleur double, chaleur multiple) et par région (Amérique du Nord, Europe, Amérique du Sud, Asie-Pacifique, Moyen-Orient et Afrique) - Prévisions jusqu'en 2035.

Partager
Download PDF ×

We do not share your information with anyone. However, we may send you emails based on your report interest from time to time. You may contact us at any time to opt-out.

On Grid Combined Heat Power Market Infographic
Purchase Options
  1. 1 RÉSUMÉ EXÉCUTIF
    1. 1.1 Aperçu du marché
    2. 1.2 Principales conclusions
    3. 1.3 Segmentation du marché
    4. 1.4 Paysage concurrentiel
    5. 1.5 Défis et opportunités
    6. 1.6 Perspectives d'avenir
  2. 2 INTRODUCTION AU MARCHÉ
    1. 2.1 Définition
    2. 2.2 Portée de l'étude
      1. 2.2.1 Objectif de recherche
      2. 2.2.2 Hypothèse
      3. 2.2.3 Limitations
  3. 3 MÉTHODOLOGIE DE RECHERCHE
    1. 3.1 Aperçu
    2. 3.2 Exploration de données
    3. 3.3 Recherche secondaire
    4. 3.4 Recherche primaire
      1. 3.4.1 Interviews primaires et processus de collecte d'informations
      2. 3.4.2 Répartition des répondants primaires
    5. 3.5 Modèle de prévision
    6. 3.6 Estimation de la taille du marché
      1. 3.6.1 Approche ascendante
      2. 3.6.2 Approche descendante
    7. 3.7 Triangulation des données
    8. 3.8 Validation
  4. 4 DYNAMIQUE DU MARCHÉ
    1. 4.1 Aperçu
    2. 4.2 Facteurs moteurs
    3. 4.3 Contraintes
    4. 4.4 Opportunités
  5. 5 ANALYSE DES FACTEURS DU MARCHÉ
    1. 5.1 Analyse de la chaîne de valeur
    2. 5.2 Analyse des cinq forces de Porter
      1. 5.2.1 Pouvoir de négociation des fournisseurs
      2. 5.2.2 Pouvoir de négociation des acheteurs
      3. 5.2.3 Menace des nouveaux entrants
      4. 5.2.4 Menace des substituts
      5. 5.2.5 Intensité de la rivalité
    3. 5.3 Analyse de l'impact du COVID-19
      1. 5.3.1 Analyse de l'impact sur le marché
      2. 5.3.2 Impact régional
      3. 5.3.3 Analyse des opportunités et des menaces
  6. 6 MARCHÉ DE LA CHALEUR ET DE L'ÉNERGIE COMBINÉE EN RÉSEAU, PAR TECHNOLOGIE (MILLIARDS USD)
    1. 6.1 Moteur à combustion interne
    2. 6.2 Turbine à gaz
    3. 6.3 Microturbine
    4. 6.4 Pile à hydrogène
    5. 6.5 Moteur Stirling
  7. 7 MARCHÉ DE LA CHALEUR ET DE L'ÉNERGIE COMBINÉE EN RÉSEAU, PAR APPLICATION (MILLIARDS USD)
    1. 7.1 Résidentiel
    2. 7.2 Commercial
    3. 7.3 Industriel
  8. 8 MARCHÉ DE LA CHALEUR ET DE L'ÉNERGIE COMBINÉE EN RÉSEAU, PAR TYPE DE CARBURANT (MILLIARDS USD)
    1. 8.1 Gaz naturel
    2. 8.2 Biomasse
    3. 8.3 Charbon
    4. 8.4 Énergie renouvelable
    5. 8.5 Chaleur résiduelle
  9. 9 MARCHÉ DE LA CHALEUR ET DE L'ÉNERGIE COMBINÉE EN RÉSEAU, PAR CONFIGURATION DU SYSTÈME (MILLIARDS USD)
    1. 9.1 Chaleur unique
    2. 9.2 Chaleur double
    3. 9.3 Chaleur multiple
  10. 10 MARCHÉ DE LA CHALEUR ET DE L'ÉNERGIE COMBINÉE EN RÉSEAU, PAR RÉGION (MILLIARDS USD)
    1. 10.1 Amérique du Nord
      1. 10.1.1 États-Unis
      2. 10.1.2 Canada
    2. 10.2 Europe
      1. 10.2.1 Allemagne
      2. 10.2.2 Royaume-Uni
      3. 10.2.3 France
      4. 10.2.4 Russie
      5. 10.2.5 Italie
      6. 10.2.6 Espagne
      7. 10.2.7 Reste de l'Europe
    3. 10.3 APAC
      1. 10.3.1 Chine
      2. 10.3.2 Inde
      3. 10.3.3 Japon
      4. 10.3.4 Corée du Sud
      5. 10.3.5 Malaisie
      6. 10.3.6 Thaïlande
      7. 10.3.7 Indonésie
      8. 10.3.8 Reste de l'APAC
    4. 10.4 Amérique du Sud
      1. 10.4.1 Brésil
      2. 10.4.2 Mexique
      3. 10.4.3 Argentine
      4. 10.4.4 Reste de l'Amérique du Sud
    5. 10.5 MEA
      1. 10.5.1 Pays du CCG
      2. 10.5.2 Afrique du Sud
      3. 10.5.3 Reste de la MEA
  11. 11 PAYSAGE CONCURRENTIEL
    1. 11.1 Aperçu
    2. 11.2 Analyse concurrentielle
    3. 11.3 Analyse de la part de marché
    4. 11.4 Principale stratégie de croissance sur le marché de la chaleur et de l'énergie combinée en réseau
    5. 11.5 Évaluation comparative
    6. 11.6 Acteurs principaux en termes de nombre de développements sur le marché de la chaleur et de l'énergie combinée en réseau
    7. 11.7 Principaux développements et stratégies de croissance
      1. 11.7.1 Lancement de nouveaux produits / Déploiement de services
      2. 11.7.2 Fusions et acquisitions
      3. 11.7.3 Coentreprises
    8. 11.8 Matrice financière des principaux acteurs
      1. 11.8.1 Ventes et revenus d'exploitation
      2. 11.8.2 Dépenses de R&D des principaux acteurs. 2023
  12. 12 PROFILS D'ENTREPRISE
    1. 12.1 Schneider Electric
      1. 12.1.1 Aperçu financier
      2. 12.1.2 Produits offerts
      3. 12.1.3 Principaux développements
      4. 12.1.4 Analyse SWOT
      5. 12.1.5 Stratégies clés
    2. 12.2 Mitsubishi Power
      1. 12.2.1 Aperçu financier
      2. 12.2.2 Produits offerts
      3. 12.2.3 Principaux développements
      4. 12.2.4 Analyse SWOT
      5. 12.2.5 Stratégies clés
    3. 12.3 MAN Energy Solutions
      1. 12.3.1 Aperçu financier
      2. 12.3.2 Produits offerts
      3. 12.3.3 Principaux développements
      4. 12.3.4 Analyse SWOT
      5. 12.3.5 Stratégies clés
    4. 12.4 Energy Technology Holdings
      1. 12.4.1 Aperçu financier
      2. 12.4.2 Produits offerts
      3. 12.4.3 Principaux développements
      4. 12.4.4 Analyse SWOT
      5. 12.4.5 Stratégies clés
    5. 12.5 Fischer Anlagenbau
      1. 12.5.1 Aperçu financier
      2. 12.5.2 Produits offerts
      3. 12.5.3 Principaux développements
      4. 12.5.4 Analyse SWOT
      5. 12.5.5 Stratégies clés
    6. 12.6 Doosan Fuel Cell
      1. 12.6.1 Aperçu financier
      2. 12.6.2 Produits offerts
      3. 12.6.3 Principaux développements
      4. 12.6.4 Analyse SWOT
      5. 12.6.5 Stratégies clés
    7. 12.7 Ceres Media
      1. 12.7.1 Aperçu financier
      2. 12.7.2 Produits offerts
      3. 12.7.3 Principaux développements
      4. 12.7.4 Analyse SWOT
      5. 12.7.5 Stratégies clés
    8. 12.8 Capstone Turbine
      1. 12.8.1 Aperçu financier
      2. 12.8.2 Produits offerts
      3. 12.8.3 Principaux développements
      4. 12.8.4 Analyse SWOT
      5. 12.8.5 Stratégies clés
    9. 12.9 UTC Power
      1. 12.9.1 Aperçu financier
      2. 12.9.2 Produits offerts
      3. 12.9.3 Principaux développements
      4. 12.9.4 Analyse SWOT
      5. 12.9.5 Stratégies clés
    10. 12.10 Delta Energy
      1. 12.10.1 Aperçu financier
      2. 12.10.2 Produits offerts
      3. 12.10.3 Principaux développements
      4. 12.10.4 Analyse SWOT
      5. 12.10.5 Stratégies clés
    11. 12.11 Veolia
      1. 12.11.1 Aperçu financier
      2. 12.11.2 Produits offerts
      3. 12.11.3 Principaux développements
      4. 12.11.4 Analyse SWOT
      5. 12.11.5 Stratégies clés
    12. 12.12 General Electric
      1. 12.12.1 Aperçu financier
      2. 12.12.2 Produits offerts
      3. 12.12.3 Principaux développements
      4. 12.12.4 Analyse SWOT
      5. 12.12.5 Stratégies clés
    13. 12.13 Caterpillar
      1. 12.13.1 Aperçu financier
      2. 12.13.2 Produits offerts
      3. 12.13.3 Principaux développements
      4. 12.13.4 Analyse SWOT
      5. 12.13.5 Stratégies clés
    14. 12.14 Siemens
      1. 12.14.1 Aperçu financier
      2. 12.14.2 Produits offerts
      3. 12.14.3 Principaux développements
      4. 12.14.4 Analyse SWOT
      5. 12.14.5 Stratégies clés
    15. 12.15 ABB
      1. 12.15.1 Aperçu financier
      2. 12.15.2 Produits offerts
      3. 12.15.3 Principaux développements
      4. 12.15.4 Analyse SWOT
      5. 12.15.5 Stratégies clés
  13. 13 ANNEXE
    1. 13.1 Références
    2. 13.2 Rapports connexes
    3. LISTE DES TABLEAUX
    4. TABLEAU 1. LISTE DES HYPOTHÈSES
    5. TABLEAU 2. ESTIMATIONS DE LA TAILLE DU MARCHÉ DE LA CHALEUR ET DE L'ÉNERGIE COMBINÉE EN RÉSEAU EN AMÉRIQUE DU NORD & PRÉVISIONS, PAR TECHNOLOGIE, 2019-2032 (MILLIARDS USD)
    6. TABLEAU 3. ESTIMATIONS DE LA TAILLE DU MARCHÉ DE LA CHALEUR ET DE L'ÉNERGIE COMBINÉE EN RÉSEAU EN AMÉRIQUE DU NORD & PRÉVISIONS, PAR APPLICATION, 2019-2032 (MILLIARDS USD)
    7. TABLEAU 4. ESTIMATIONS DE LA TAILLE DU MARCHÉ DE LA CHALEUR ET DE L'ÉNERGIE COMBINÉE EN RÉSEAU EN AMÉRIQUE DU NORD & PRÉVISIONS, PAR TYPE DE CARBURANT, 2019-2032 (MILLIARDS USD)
    8. TABLEAU 5. ESTIMATIONS DE LA TAILLE DU MARCHÉ DE LA CHALEUR ET DE L'ÉNERGIE COMBINÉE EN RÉSEAU EN AMÉRIQUE DU NORD & PRÉVISIONS, PAR CONFIGURATION DU SYSTÈME, 2019-2032 (MILLIARDS USD)
    9. TABLEAU 6. ESTIMATIONS DE LA TAILLE DU MARCHÉ DE LA CHALEUR ET DE L'ÉNERGIE COMBINÉE EN RÉSEAU EN AMÉRIQUE DU NORD & PRÉVISIONS, PAR RÉGION, 2019-2032 (MILLIARDS USD)
    10. TABLEAU 7. ESTIMATIONS DE LA TAILLE DU MARCHÉ DE LA CHALEUR ET DE L'ÉNERGIE COMBINÉE EN RÉSEAU AUX ÉTATS-UNIS & PRÉVISIONS, PAR TECHNOLOGIE, 2019-2032 (MILLIARDS USD)
    11. TABLEAU 8. ESTIMATIONS DE LA TAILLE DU MARCHÉ DE LA CHALEUR ET DE L'ÉNERGIE COMBINÉE EN RÉSEAU AUX ÉTATS-UNIS & PRÉVISIONS, PAR APPLICATION, 2019-2032 (MILLIARDS USD)
    12. TABLEAU 9. ESTIMATIONS DE LA TAILLE DU MARCHÉ DE LA CHALEUR ET DE L'ÉNERGIE COMBINÉE EN RÉSEAU AUX ÉTATS-UNIS & PRÉVISIONS, PAR TYPE DE CARBURANT, 2019-2032 (MILLIARDS USD)
    13. TABLEAU 10. ESTIMATIONS DE LA TAILLE DU MARCHÉ DE LA CHALEUR ET DE L'ÉNERGIE COMBINÉE EN RÉSEAU AUX ÉTATS-UNIS & PRÉVISIONS, PAR CONFIGURATION DU SYSTÈME, 2019-2032 (MILLIARDS USD)
    14. TABLEAU 11. ESTIMATIONS DE LA TAILLE DU MARCHÉ DE LA CHALEUR ET DE L'ÉNERGIE COMBINÉE EN RÉSEAU AUX ÉTATS-UNIS & PRÉVISIONS, PAR RÉGION, 2019-2032 (MILLIARDS USD)
    15. TABLEAU 12. ESTIMATIONS DE LA TAILLE DU MARCHÉ DE LA CHALEUR ET DE L'ÉNERGIE COMBINÉE EN RÉSEAU AU CANADA & PRÉVISIONS, PAR TECHNOLOGIE, 2019-2032 (MILLIARDS USD)
    16. TABLEAU 13. ESTIMATIONS DE LA TAILLE DU MARCHÉ DE LA CHALEUR ET DE L'ÉNERGIE COMBINÉE EN RÉSEAU AU CANADA & PRÉVISIONS, PAR APPLICATION, 2019-2032 (MILLIARDS USD)
    17. TABLEAU 14. ESTIMATIONS DE LA TAILLE DU MARCHÉ DE LA CHALEUR ET DE L'ÉNERGIE COMBINÉE EN RÉSEAU AU CANADA & PRÉVISIONS, PAR TYPE DE CARBURANT, 2019-2032 (MILLIARDS USD)
    18. TABLEAU 15. ESTIMATIONS DE LA TAILLE DU MARCHÉ DE LA CHALEUR ET DE L'ÉNERGIE COMBINÉE EN RÉSEAU AU CANADA & PRÉVISIONS, PAR CONFIGURATION DU SYSTÈME, 2019-2032 (MILLIARDS USD)
    19. TABLEAU 16. ESTIMATIONS DE LA TAILLE DU MARCHÉ DE LA CHALEUR ET DE L'ÉNERGIE COMBINÉE EN RÉSEAU AU CANADA & PRÉVISIONS, PAR RÉGION, 2019-2032 (MILLIARDS USD)
    20. TABLEAU 17. ESTIMATIONS DE LA TAILLE DU MARCHÉ DE LA CHALEUR ET DE L'ÉNERGIE COMBINÉE EN RÉSEAU EN EUROPE & PRÉVISIONS, PAR TECHNOLOGIE, 2019-2032 (MILLIARDS USD)
    21. TABLEAU 18. ESTIMATIONS DE LA TAILLE DU MARCHÉ DE LA CHALEUR ET DE L'ÉNERGIE COMBINÉE EN RÉSEAU EN EUROPE & PRÉVISIONS, PAR APPLICATION, 2019-2032 (MILLIARDS USD)
    22. TABLEAU 19. ESTIMATIONS DE LA TAILLE DU MARCHÉ DE LA CHALEUR ET DE L'ÉNERGIE COMBINÉE EN RÉSEAU EN EUROPE & PRÉVISIONS, PAR TYPE DE CARBURANT, 2019-2032 (MILLIARDS USD)
    23. TABLEAU 20. ESTIMATIONS DE LA TAILLE DU MARCHÉ DE LA CHALEUR ET DE L'ÉNERGIE COMBINÉE EN RÉSEAU EN EUROPE & PRÉVISIONS, PAR CONFIGURATION DU SYSTÈME, 2019-2032 (MILLIARDS USD)
    24. TABLEAU 21. ESTIMATIONS DE LA TAILLE DU MARCHÉ DE LA CHALEUR ET DE L'ÉNERGIE COMBINÉE EN RÉSEAU EN EUROPE & PRÉVISIONS, PAR RÉGION, 2019-2032 (MILLIARDS USD)
    25. TABLEAU 22. ESTIMATIONS DE LA TAILLE DU MARCHÉ DE LA CHALEUR ET DE L'ÉNERGIE COMBINÉE EN RÉSEAU EN ALLEMAGNE & PRÉVISIONS, PAR TECHNOLOGIE, 2019-2032 (MILLIARDS USD)
    26. TABLEAU 23. ESTIMATIONS DE LA TAILLE DU MARCHÉ DE LA CHALEUR ET DE L'ÉNERGIE COMBINÉE EN RÉSEAU EN ALLEMAGNE & PRÉVISIONS, PAR APPLICATION, 2019-2032 (MILLIARDS USD)
    27. TABLEAU 24. ESTIMATIONS DE LA TAILLE DU MARCHÉ DE LA CHALEUR ET DE L'ÉNERGIE COMBINÉE EN RÉSEAU EN ALLEMAGNE & PRÉVISIONS, PAR TYPE DE CARBURANT, 2019-2032 (MILLIARDS USD)
    28. TABLEAU 25. ESTIMATIONS DE LA TAILLE DU MARCHÉ DE LA CHALEUR ET DE L'ÉNERGIE COMBINÉE EN RÉSEAU EN ALLEMAGNE & PRÉVISIONS, PAR CONFIGURATION DU SYSTÈME, 2019-2032 (MILLIARDS USD)
    29. TABLEAU 26. ESTIMATIONS DE LA TAILLE DU MARCHÉ DE LA CHALEUR ET DE L'ÉNERGIE COMBINÉE EN RÉSEAU EN ALLEMAGNE & PRÉVISIONS, PAR RÉGION, 2019-2032 (MILLIARDS USD)
    30. TABLEAU 27. ESTIMATIONS DE LA TAILLE DU MARCHÉ DE LA CHALEUR ET DE L'ÉNERGIE COMBINÉE EN RÉSEAU AU ROYAUME-UNI & PRÉVISIONS, PAR TECHNOLOGIE, 2019-2032 (MILLIARDS USD)
    31. TABLEAU 28. ESTIMATIONS DE LA TAILLE DU MARCHÉ DE LA CHALEUR ET DE L'ÉNERGIE COMBINÉE EN RÉSEAU AU ROYAUME-UNI & PRÉVISIONS, PAR APPLICATION, 2019-2032 (MILLIARDS USD)
    32. TABLEAU 29. ESTIMATIONS DE LA TAILLE DU MARCHÉ DE LA CHALEUR ET DE L'ÉNERGIE COMBINÉE EN RÉSEAU AU ROYAUME-UNI & PRÉVISIONS, PAR TYPE DE CARBURANT, 2019-2032 (MILLIARDS USD)
    33. TABLEAU 30. ESTIMATIONS DE LA TAILLE DU MARCHÉ DE LA CHALEUR ET DE L'ÉNERGIE COMBINÉE EN RÉSEAU AU ROYAUME-UNI & PRÉVISIONS, PAR CONFIGURATION DU SYSTÈME, 2019-2032 (MILLIARDS USD)
    34. TABLEAU 31. ESTIMATIONS DE LA TAILLE DU MARCHÉ DE LA CHALEUR ET DE L'ÉNERGIE COMBINÉE EN RÉSEAU AU ROYAUME-UNI & PRÉVISIONS, PAR RÉGION, 2019-2032 (MILLIARDS USD)
    35. TABLEAU 32. ESTIMATIONS DE LA TAILLE DU MARCHÉ DE LA CHALEUR ET DE L'ÉNERGIE COMBINÉE EN RÉSEAU EN FRANCE & PRÉVISIONS, PAR TECHNOLOGIE, 2019-2032 (MILLIARDS USD)
    36. TABLEAU 33. ESTIMATIONS DE LA TAILLE DU MARCHÉ DE LA CHALEUR ET DE L'ÉNERGIE COMBINÉE EN RÉSEAU EN FRANCE & PRÉVISIONS, PAR APPLICATION, 2019-2032 (MILLIARDS USD)
    37. TABLEAU 34. ESTIMATIONS DE LA TAILLE DU MARCHÉ DE LA CHALEUR ET DE L'ÉNERGIE COMBINÉE EN RÉSEAU EN FRANCE & PRÉVISIONS, PAR TYPE DE CARBURANT, 2019-2032 (MILLIARDS USD)
    38. TABLEAU 35. ESTIMATIONS DE LA TAILLE DU MARCHÉ DE LA CHALEUR ET DE L'ÉNERGIE COMBINÉE EN RÉSEAU EN FRANCE & PRÉVISIONS, PAR CONFIGURATION DU SYSTÈME, 2019-2032 (MILLIARDS USD)
    39. TABLEAU 36. ESTIMATIONS DE LA TAILLE DU MARCHÉ DE LA CHALEUR ET DE L'ÉNERGIE COMBINÉE EN RÉSEAU EN FRANCE & PRÉVISIONS, PAR RÉGION, 2019-2032 (MILLIARDS USD)
    40. TABLEAU 37. ESTIMATIONS DE LA TAILLE DU MARCHÉ DE LA CHALEUR ET DE L'ÉNERGIE COMBINÉE EN RÉSEAU EN RUSSIE & PRÉVISIONS, PAR TECHNOLOGIE, 2019-2032 (MILLIARDS USD)
    41. TABLEAU 38. ESTIMATIONS DE LA TAILLE DU MARCHÉ DE LA CHALEUR ET DE L'ÉNERGIE COMBINÉE EN RÉSEAU EN RUSSIE & PRÉVISIONS, PAR APPLICATION, 2019-2032 (MILLIARDS USD)
    42. TABLEAU 39. ESTIMATIONS DE LA TAILLE DU MARCHÉ DE LA CHALEUR ET DE L'ÉNERGIE COMBINÉE EN RÉSEAU EN RUSSIE & PRÉVISIONS, PAR TYPE DE CARBURANT, 2019-2032 (MILLIARDS USD)
    43. TABLEAU 40. ESTIMATIONS DE LA TAILLE DU MARCHÉ DE LA CHALEUR ET DE L'ÉNERGIE COMBINÉE EN RÉSEAU EN RUSSIE & PRÉVISIONS, PAR CONFIGURATION DU SYSTÈME, 2019-2032 (MILLIARDS USD)
    44. TABLEAU 41. ESTIMATIONS DE LA TAILLE DU MARCHÉ DE LA CHALEUR ET DE L'ÉNERGIE COMBINÉE EN RÉSEAU EN RUSSIE & PRÉVISIONS, PAR RÉGION, 2019-2032 (MILLIARDS USD)
    45. TABLEAU 42. ESTIMATIONS DE LA TAILLE DU MARCHÉ DE LA CHALEUR ET DE L'ÉNERGIE COMBINÉE EN RÉSEAU EN ITALIE & PRÉVISIONS, PAR TECHNOLOGIE, 2019-2032 (MILLIARDS USD)
    46. TABLEAU 43. ESTIMATIONS DE LA TAILLE DU MARCHÉ DE LA CHALEUR ET DE L'ÉNERGIE COMBINÉE EN RÉSEAU EN ITALIE & PRÉVISIONS, PAR APPLICATION, 2019-2032 (MILLIARDS USD)
    47. TABLEAU 44. ESTIMATIONS DE LA TAILLE DU MARCHÉ DE LA CHALEUR ET DE L'ÉNERGIE COMBINÉE EN RÉSEAU EN ITALIE & PRÉVISIONS, PAR TYPE DE CARBURANT, 2019-2032 (MILLIARDS USD)
    48. TABLEAU 45. ESTIMATIONS DE LA TAILLE DU MARCHÉ DE LA CHALEUR ET DE L'ÉNERGIE COMBINÉE EN RÉSEAU EN ITALIE & PRÉVISIONS, PAR CONFIGURATION DU SYSTÈME, 2019-2032 (MILLIARDS USD)
    49. TABLEAU 46. ESTIMATIONS DE LA TAILLE DU MARCHÉ DE LA CHALEUR ET DE L'ÉNERGIE COMBINÉE EN RÉSEAU EN ITALIE & PRÉVISIONS, PAR RÉGION, 2019-2032 (MILLIARDS USD)
    50. TABLEAU 47. ESTIMATIONS DE LA TAILLE DU MARCHÉ DE LA CHALEUR ET DE L'ÉNERGIE COMBINÉE EN RÉSEAU EN ESPAGNE & PRÉVISIONS, PAR TECHNOLOGIE, 2019-2032 (MILLIARDS USD)
    51. TABLEAU 48. ESTIMATIONS DE LA TAILLE DU MARCHÉ DE LA CHALEUR ET DE L'ÉNERGIE COMBINÉE EN RÉSEAU EN ESPAGNE & PRÉVISIONS, PAR APPLICATION, 2019-2032 (MILLIARDS USD)
    52. TABLEAU 49. ESTIMATIONS DE LA TAILLE DU MARCHÉ DE LA CHALEUR ET DE L'ÉNERGIE COMBINÉE EN RÉSEAU EN ESPAGNE & PRÉVISIONS, PAR TYPE DE CARBURANT, 2019-2032 (MILLIARDS USD)
    53. TABLEAU 50. ESTIMATIONS DE LA TAILLE DU MARCHÉ DE LA CHALEUR ET DE L'ÉNERGIE COMBINÉE EN RÉSEAU EN ESPAGNE & PRÉVISIONS, PAR CONFIGURATION DU SYSTÈME, 2019-2032 (MILLIARDS USD)
    54. TABLEAU 51. ESTIMATIONS DE LA TAILLE DU MARCHÉ DE LA CHALEUR ET DE L'ÉNERGIE COMBINÉE EN RÉSEAU EN ESPAGNE & PRÉVISIONS, PAR RÉGION, 2019-2032 (MILLIARDS USD)
    55. TABLEAU 52. ESTIMATIONS DE LA TAILLE DU MARCHÉ DE LA CHALEUR ET DE L'ÉNERGIE COMBINÉE EN RÉSEAU DANS LE RESTE DE L'EUROPE & PRÉVISIONS, PAR TECHNOLOGIE, 2019-2032 (MILLIARDS USD)
    56. TABLEAU 53. ESTIMATIONS DE LA TAILLE DU MARCHÉ DE LA CHALEUR ET DE L'ÉNERGIE COMBINÉE EN RÉSEAU DANS LE RESTE DE L'EUROPE & PRÉVISIONS, PAR APPLICATION, 2019-2032 (MILLIARDS USD)
    57. TABLEAU 54. ESTIMATIONS DE LA TAILLE DU MARCHÉ DE LA CHALEUR ET DE L'ÉNERGIE COMBINÉE EN RÉSEAU DANS LE RESTE DE L'EUROPE & PRÉVISIONS, PAR TYPE DE CARBURANT, 2019-2032 (MILLIARDS USD)
    58. TABLEAU 55. ESTIMATIONS DE LA TAILLE DU MARCHÉ DE LA CHALEUR ET DE L'ÉNERGIE COMBINÉE EN RÉSEAU DANS LE RESTE DE L'EUROPE & PRÉVISIONS, PAR CONFIGURATION DU SYSTÈME, 2019-2032 (MILLIARDS USD)
    59. TABLEAU 56. ESTIMATIONS DE LA TAILLE DU MARCHÉ DE LA CHALEUR ET DE L'ÉNERGIE COMBINÉE EN RÉSEAU DANS LE RESTE DE L'EUROPE & PRÉVISIONS, PAR RÉGION, 2019-2032 (MILLIARDS USD)
    60. TABLEAU 57. ESTIMATIONS DE LA TAILLE DU MARCHÉ DE LA CHALEUR ET DE L'ÉNERGIE COMBINÉE EN RÉSEAU EN APAC & PRÉVISIONS, PAR TECHNOLOGIE, 2019-2032 (MILLIARDS USD)
    61. TABLEAU 58. ESTIMATIONS DE LA TAILLE DU MARCHÉ DE LA CHALEUR ET DE L'ÉNERGIE COMBINÉE EN RÉSEAU EN APAC & PRÉVISIONS, PAR APPLICATION, 2019-2032 (MILLIARDS USD)
    62. TABLEAU 59. ESTIMATIONS DE LA TAILLE DU MARCHÉ DE LA CHALEUR ET DE L'ÉNERGIE COMBINÉE EN RÉSEAU EN APAC & PRÉVISIONS, PAR TYPE DE CARBURANT, 2019-2032 (MILLIARDS USD)
    63. TABLEAU 60. ESTIMATIONS DE LA TAILLE DU MARCHÉ DE LA CHALEUR ET DE L'ÉNERGIE COMBINÉE EN RÉSEAU EN APAC & PRÉVISIONS, PAR CONFIGURATION DU SYSTÈME, 2019-2032 (MILLIARDS USD)
    64. TABLEAU 61. ESTIMATIONS DE LA TAILLE DU MARCHÉ DE LA CHALEUR ET DE L'ÉNERGIE COMBINÉE EN RÉSEAU EN APAC & PRÉVISIONS, PAR RÉGION, 2019-2032 (MILLIARDS USD)
    65. TABLEAU 62. ESTIMATIONS DE LA TAILLE DU MARCHÉ DE LA CHALEUR ET DE L'ÉNERGIE COMBINÉE EN RÉSEAU EN CHINE & PRÉVISIONS, PAR TECHNOLOGIE, 2019-2032 (MILLIARDS USD)
    66. TABLEAU 63. ESTIMATIONS DE LA TAILLE DU MARCHÉ DE LA CHALEUR ET DE L'ÉNERGIE COMBINÉE EN RÉSEAU EN CHINE & PRÉVISIONS, PAR APPLICATION, 2019-2032 (MILLIARDS USD)
    67. TABLEAU 64. ESTIMATIONS DE LA TAILLE DU MARCHÉ DE LA CHALEUR ET DE L'ÉNERGIE COMBINÉE EN RÉSEAU EN CHINE & PRÉVISIONS, PAR TYPE DE CARBURANT, 2019-2032 (MILLIARDS USD)
    68. TABLEAU 65. ESTIMATIONS DE LA TAILLE DU MARCHÉ DE LA CHALEUR ET DE L'ÉNERGIE COMBINÉE EN RÉSEAU EN CHINE & PRÉVISIONS, PAR CONFIGURATION DU SYSTÈME, 2019-2032 (MILLIARDS USD)
    69. TABLEAU 66. ESTIMATIONS DE LA TAILLE DU MARCHÉ DE LA CHALEUR ET DE L'ÉNERGIE COMBINÉE EN RÉSEAU EN CHINE & PRÉVISIONS, PAR RÉGION, 2019-2032 (MILLIARDS USD)
    70. TABLEAU 67. ESTIMATIONS DE LA TAILLE DU MARCHÉ DE LA CHALEUR ET DE L'ÉNERGIE COMBINÉE EN RÉSEAU EN INDE & PRÉVISIONS, PAR TECHNOLOGIE, 2019-2032 (MILLIARDS USD)
    71. TABLEAU 68. ESTIMATIONS DE LA TAILLE DU MARCHÉ DE LA CHALEUR ET DE L'ÉNERGIE COMBINÉE EN RÉSEAU EN INDE & PRÉVISIONS, PAR APPLICATION, 2019-2032 (MILLIARDS USD)
    72. TABLEAU 69. ESTIMATIONS DE LA TAILLE DU MARCHÉ DE LA CHALEUR ET DE L'ÉNERGIE COMBINÉE EN RÉSEAU EN INDE & PRÉVISIONS, PAR TYPE DE CARBURANT, 2019-2032 (MILLIARDS USD)
    73. TABLEAU 70. ESTIMATIONS DE LA TAILLE DU MARCHÉ DE LA CHALEUR ET DE L'ÉNERGIE COMBINÉE EN RÉSEAU EN INDE & PRÉVISIONS, PAR CONFIGURATION DU SYSTÈME, 2019-2032 (MILLIARDS USD)
    74. TABLEAU 71. ESTIMATIONS DE LA TAILLE DU MARCHÉ DE LA CHALEUR ET DE L'ÉNERGIE COMBINÉE EN RÉSEAU EN INDE & PRÉVISIONS, PAR RÉGION, 2019-2032 (MILLIARDS USD)
    75. TABLEAU 72. ESTIMATIONS DE LA TAILLE DU MARCHÉ DE LA CHALEUR ET DE L'ÉNERGIE COMBINÉE EN RÉSEAU AU JAPON & PRÉVISIONS, PAR TECHNOLOGIE, 2019-2032 (MILLIARDS USD)
    76. TABLEAU 73. ESTIMATIONS DE LA TAILLE DU MARCHÉ DE LA CHALEUR ET DE L'ÉNERGIE COMBINÉE EN RÉSEAU AU JAPON & PRÉVISIONS, PAR APPLICATION, 2019-2032 (MILLIARDS USD)
    77. TABLEAU 74. ESTIMATIONS DE LA TAILLE DU MARCHÉ DE LA CHALEUR ET DE L'ÉNERGIE COMBINÉE EN RÉSEAU AU JAPON & PRÉVISIONS, PAR TYPE DE CARBURANT, 2019-2032 (MILLIARDS USD)
    78. TABLEAU 75. ESTIMATIONS DE LA TAILLE DU MARCHÉ DE LA CHALEUR ET DE L'ÉNERGIE COMBINÉE EN RÉSEAU AU JAPON & PRÉVISIONS, PAR CONFIGURATION DU SYSTÈME, 2019-2032 (MILLIARDS USD)
    79. TABLEAU 76. ESTIMATIONS DE LA TAILLE DU MARCHÉ DE LA CHALEUR ET DE L'ÉNERGIE COMBINÉE EN RÉSEAU AU JAPON & PRÉVISIONS, PAR RÉGION, 2019-2032 (MILLIARDS USD)
    80. TABLEAU 77. ESTIMATIONS DE LA TAILLE DU MARCHÉ DE LA CHALEUR ET DE L'ÉNERGIE COMBINÉE EN RÉSEAU EN CORÉE DU SUD & PRÉVISIONS, PAR TECHNOLOGIE, 2019-2032 (MILLIARDS USD)
    81. TABLEAU 78. ESTIMATIONS DE LA TAILLE DU MARCHÉ DE LA CHALEUR ET DE L'ÉNERGIE COMBINÉE EN RÉSEAU EN CORÉE DU SUD & PRÉVISIONS, PAR APPLICATION, 2019-2032 (MILLIARDS USD)
    82. TABLEAU 79. ESTIMATIONS DE LA TAILLE DU MARCHÉ DE LA CHALEUR ET DE L'ÉNERGIE COMBINÉE EN RÉSEAU EN CORÉE DU SUD & PRÉVISIONS, PAR TYPE DE CARBURANT, 2019-2032 (MILLIARDS USD)
    83. TABLEAU 80. ESTIMATIONS DE LA TAILLE DU MARCHÉ DE LA CHALEUR ET DE L'ÉNERGIE COMBINÉE EN RÉSEAU EN CORÉE DU SUD & PRÉVISIONS, PAR CONFIGURATION DU SYSTÈME, 2019-2032 (MILLIARDS USD)
    84. TABLEAU 81. ESTIMATIONS DE LA TAILLE DU MARCHÉ DE LA CHALEUR ET DE L'ÉNERGIE COMBINÉE EN RÉSEAU EN CORÉE DU SUD & PRÉVISIONS, PAR RÉGION, 2019-2032 (MILLIARDS USD)
    85. TABLEAU 82. ESTIMATIONS DE LA TAILLE DU MARCHÉ DE LA CHALEUR ET DE L'ÉNERGIE COMBINÉE EN RÉSEAU EN MALAYSIE & PRÉVISIONS, PAR TECHNOLOGIE, 2019-2032 (MILLIARDS USD)
    86. TABLEAU 83. ESTIMATIONS DE LA TAILLE DU MARCHÉ DE LA CHALEUR ET DE L'ÉNERGIE COMBINÉE EN RÉSEAU EN MALAYSIE & PRÉVISIONS, PAR APPLICATION, 2019-2032 (MILLIARDS USD)
    87. TABLEAU 84. ESTIMATIONS DE LA TAILLE DU MARCHÉ DE LA CHALEUR ET DE L'ÉNERGIE COMBINÉE EN RÉSEAU EN MALAYSIE & PRÉVISIONS, PAR TYPE DE CARBURANT, 2019-2032 (MILLIARDS USD)
    88. TABLEAU 85. ESTIMATIONS DE LA TAILLE DU MARCHÉ DE LA CHALEUR ET DE L'ÉNERGIE COMBINÉE EN RÉSEAU EN MALAYSIE & PRÉVISIONS, PAR CONFIGURATION DU SYSTÈME, 2019-2032 (MILLIARDS USD)
    89. TABLEAU 86. ESTIMATIONS DE LA TAILLE DU MARCHÉ DE LA CHALEUR ET DE L'ÉNERGIE COMBINÉE EN RÉSEAU EN MALAYSIE & PRÉVISIONS, PAR RÉGION, 2019-2032 (MILLIARDS USD)
    90. TABLEAU 87. ESTIMATIONS DE LA TAILLE DU MARCHÉ DE LA CHALEUR ET DE L'ÉNERGIE COMBINÉE EN RÉSEAU EN THAÏLANDE & PRÉVISIONS, PAR TECHNOLOGIE, 2019-2032 (MILLIARDS USD)
    91. TABLEAU 88. ESTIMATIONS DE LA TAILLE DU MARCHÉ DE LA CHALEUR ET DE L'ÉNERGIE COMBINÉE EN RÉSEAU EN THAÏLANDE & PRÉVISIONS, PAR APPLICATION, 2019-2032 (MILLIARDS USD)
    92. TABLEAU 89. ESTIMATIONS DE LA TAILLE DU MARCHÉ DE LA CHALEUR ET DE L'ÉNERGIE COMBINÉE EN RÉSEAU EN THAÏLANDE & PRÉVISIONS, PAR TYPE DE CARBURANT, 2019-2032 (MILLIARDS USD)
    93. TABLEAU 90. ESTIMATIONS DE LA TAILLE DU MARCHÉ DE LA CHALEUR ET DE L'ÉNERGIE COMBINÉE EN RÉSEAU EN THAÏLANDE & PRÉVISIONS, PAR CONFIGURATION DU SYSTÈME, 2019-2032 (MILLIARDS USD)
    94. TABLEAU 91. ESTIMATIONS DE LA TAILLE DU MARCHÉ DE LA CHALEUR ET DE L'ÉNERGIE COMBINÉE EN RÉSEAU EN THAÏLANDE & PRÉVISIONS, PAR RÉGION, 2019-2032 (MILLIARDS USD)
    95. TABLEAU 92. ESTIMATIONS DE LA TAILLE DU MARCHÉ DE LA CHALEUR ET DE L'ÉNERGIE COMBINÉE EN RÉSEAU EN INDONÉSIE & PRÉVISIONS, PAR TECHNOLOGIE, 2019-2032 (MILLIARDS USD)
    96. TABLEAU 93. ESTIMATIONS DE LA TAILLE DU MARCHÉ DE LA CHALEUR ET DE L'ÉNERGIE COMBINÉE EN RÉSEAU EN INDONÉSIE & PRÉVISIONS, PAR APPLICATION, 2019-2032 (MILLIARDS USD)
    97. TABLEAU 94. ESTIMATIONS DE LA TAILLE DU MARCHÉ DE LA CHALEUR ET DE L'ÉNERGIE COMBINÉE EN RÉSEAU EN INDONÉSIE & PRÉVISIONS, PAR TYPE DE CARBURANT, 2019-2032 (MILLIARDS USD)
    98. TABLEAU 95. ESTIMATIONS DE LA TAILLE DU MARCHÉ DE LA CHALEUR ET DE L'ÉNERGIE COMBINÉE EN RÉSEAU EN INDONÉSIE & PRÉVISIONS, PAR CONFIGURATION DU SYSTÈME, 2019-2032 (MILLIARDS USD)
    99. TABLEAU 96. ESTIMATIONS DE LA TAILLE DU MARCHÉ DE LA CHALEUR ET DE L'ÉNERGIE COMBINÉE EN RÉSEAU EN INDONÉSIE & PRÉVISIONS, PAR RÉGION, 2019-2032 (MILLIARDS USD)
    100. TABLEAU 97. ESTIMATIONS DE LA TAILLE DU MARCHÉ DE LA CHALEUR ET DE L'ÉNERGIE COMBINÉE EN RÉSEAU DANS LE RESTE DE L'APAC & PRÉVISIONS, PAR TECHNOLOGIE, 2019-2032 (MILLIARDS USD)
    101. TABLEAU 98. ESTIMATIONS DE LA TAILLE DU MARCHÉ DE LA CHALEUR ET DE L'ÉNERGIE COMBINÉE EN RÉSEAU DANS LE RESTE DE L'APAC & PRÉVISIONS, PAR APPLICATION, 2019-2032 (MILLIARDS USD)
    102. TABLEAU 99. ESTIMATIONS DE LA TAILLE DU MARCHÉ DE LA CHALEUR ET DE L'ÉNERGIE COMBINÉE EN RÉSEAU DANS LE RESTE DE L'APAC & PRÉVISIONS, PAR TYPE DE CARBURANT, 2019-2032 (MILLIARDS USD)
    103. TABLEAU 100. ESTIMATIONS DE LA TAILLE DU MARCHÉ DE LA CHALEUR ET DE L'ÉNERGIE COMBINÉE EN RÉSEAU DANS LE RESTE DE L'APAC & PRÉVISIONS, PAR CONFIGURATION DU SYSTÈME, 2019-2032 (MILLIARDS USD)
    104. TABLEAU 101. ESTIMATIONS DE LA TAILLE DU MARCHÉ DE LA CHALEUR ET DE L'ÉNERGIE COMBINÉE EN RÉSEAU DANS LE RESTE DE L'APAC & PRÉVISIONS, PAR RÉGION, 2019-2032 (MILLIARDS USD)
    105. TABLEAU 102. ESTIMATIONS DE LA TAILLE DU MARCHÉ DE LA CHALEUR ET DE L'ÉNERGIE COMBINÉE EN RÉSEAU EN AMÉRIQUE DU SUD & PRÉVISIONS, PAR TECHNOLOGIE, 2019-2032 (MILLIARDS USD)
    106. TABLEAU 103. ESTIMATIONS DE LA TAILLE DU MARCHÉ DE LA CHALEUR ET DE L'ÉNERGIE COMBINÉE EN RÉSEAU EN AMÉRIQUE DU SUD & PRÉVISIONS, PAR APPLICATION, 2019-2032 (MILLIARDS USD)
    107. TABLEAU 104. ESTIMATIONS DE LA TAILLE DU MARCHÉ DE LA CHALEUR ET DE L'ÉNERGIE COMBINÉE EN RÉSEAU EN AMÉRIQUE DU SUD & PRÉVISIONS, PAR TYPE DE CARBURANT, 2019-2032 (MILLIARDS USD)
    108. TABLEAU 105. ESTIMATIONS DE LA TAILLE DU MARCHÉ DE LA CHALEUR ET DE L'ÉNERGIE COMBINÉE EN RÉSEAU EN AMÉRIQUE DU SUD & PRÉVISIONS, PAR CONFIGURATION DU SYSTÈME, 2019-2032 (MILLIARDS USD)
    109. TABLEAU 106. ESTIMATIONS DE LA TAILLE DU MARCHÉ DE LA CHALEUR ET DE L'ÉNERGIE COMBINÉE EN RÉSEAU EN AMÉRIQUE DU SUD & PRÉVISIONS, PAR RÉGION, 2019-2032 (MILLIARDS USD)
    110. TABLEAU 107. ESTIMATIONS DE LA TAILLE DU MARCHÉ DE LA CHALEUR ET DE L'ÉNERGIE COMBINÉE EN RÉSEAU AU BRÉSIL & PRÉVISIONS, PAR TECHNOLOGIE, 2019-2032 (MILLIARDS USD)
    111. TABLEAU 108. ESTIMATIONS DE LA TAILLE DU MARCHÉ DE LA CHALEUR ET DE L'ÉNERGIE COMBINÉE EN RÉSEAU AU BRÉSIL & PRÉVISIONS, PAR APPLICATION, 2019-2032 (MILLIARDS USD)
    112. TABLEAU 109. ESTIMATIONS DE LA TAILLE DU MARCHÉ DE LA CHALEUR ET DE L'ÉNERGIE COMBINÉE EN RÉSEAU AU BRÉSIL & PRÉVISIONS, PAR TYPE DE CARBURANT, 2019-2032 (MILLIARDS USD)
    113. TABLEAU 110. ESTIMATIONS DE LA TAILLE DU MARCHÉ DE LA CHALEUR ET DE L'ÉNERGIE COMBINÉE EN RÉSEAU AU BRÉSIL & PRÉVISIONS, PAR CONFIGURATION DU SYSTÈME, 2019-2032 (MILLIARDS USD)
    114. TABLEAU 111. ESTIMATIONS DE LA TAILLE DU MARCHÉ DE LA CHALEUR ET DE L'ÉNERGIE COMBINÉE EN RÉSEAU AU BRÉSIL & PRÉVISIONS, PAR RÉGION, 2019-2032 (MILLIARDS USD)
    115. TABLEAU 112. ESTIMATIONS DE LA TAILLE DU MARCHÉ DE LA CHALEUR ET DE L'ÉNERGIE COMBINÉE EN RÉSEAU AU MEXIQUE & PRÉVISIONS, PAR TECHNOLOGIE, 2019-2032 (MILLIARDS USD)
    116. TABLEAU 113. ESTIMATIONS DE LA TAILLE DU MARCHÉ DE LA CHALEUR ET DE L'ÉNERGIE COMBINÉE EN RÉSEAU AU MEXIQUE & PRÉVISIONS, PAR APPLICATION, 2019-2032 (MILLIARDS USD)
    117. TABLEAU 114. ESTIMATIONS DE LA TAILLE DU MARCHÉ DE LA CHALEUR ET DE L'ÉNERGIE COMBINÉE EN RÉSEAU AU MEXIQUE & PRÉVISIONS, PAR TYPE DE CARBURANT, 2019-2032 (MILLIARDS USD)
    118. TABLEAU 115. ESTIMATIONS DE LA TAILLE DU MARCHÉ DE LA CHALEUR ET DE L'ÉNERGIE COMBINÉE EN RÉSEAU AU MEXIQUE & PRÉVISIONS, PAR CONFIGURATION DU SYSTÈME, 2019-2032 (MILLIARDS USD)
    119. TABLEAU 116. ESTIMATIONS DE LA TAILLE DU MARCHÉ DE LA CHALEUR ET DE L'ÉNERGIE COMBINÉE EN RÉSEAU AU MEXIQUE & PRÉVISIONS, PAR RÉGION, 2019-2032 (MILLIARDS USD)
    120. TABLEAU 117. ESTIMATIONS DE LA TAILLE DU MARCHÉ DE LA CHALEUR ET DE L'ÉNERGIE COMBINÉE EN RÉSEAU EN ARGENTINE & PRÉVISIONS, PAR TECHNOLOGIE, 2019-2032 (MILLIARDS USD)
    121. TABLEAU 118. ESTIMATIONS DE LA TAILLE DU MARCHÉ DE LA CHALEUR ET DE L'ÉNERGIE COMBINÉE EN RÉSEAU EN ARGENTINE & PRÉVISIONS, PAR APPLICATION, 2019-2032 (MILLIARDS USD)
    122. TABLEAU 119. ESTIMATIONS DE LA TAILLE DU MARCHÉ DE LA CHALEUR ET DE L'ÉNERGIE COMBINÉE EN RÉSEAU EN ARGENTINE & PRÉVISIONS, PAR TYPE DE CARBURANT, 2019-2032 (MILLIARDS USD)
    123. TABLEAU 120. ESTIMATIONS DE LA TAILLE DU MARCHÉ DE LA CHALEUR ET DE L'ÉNERGIE COMBINÉE EN RÉSEAU EN ARGENTINE & PRÉVISIONS, PAR CONFIGURATION DU SYSTÈME, 2019-2032 (MILLIARDS USD)
    124. TABLEAU 121. ESTIMATIONS DE LA TAILLE DU MARCHÉ DE LA CHALEUR ET DE L'ÉNERGIE COMBINÉE EN RÉSEAU EN ARGENTINE & PRÉVISIONS, PAR RÉGION, 2019-2032 (MILLIARDS USD)
    125. TABLEAU 122. ESTIMATIONS DE LA TAILLE DU MARCHÉ DE LA CHALEUR ET DE L'ÉNERGIE COMBINÉE EN RÉSEAU DANS LE RESTE DE L'AMÉRIQUE DU SUD & PRÉVISIONS, PAR TECHNOLOGIE, 2019-2032 (MILLIARDS USD)
    126. TABLEAU 123. ESTIMATIONS DE LA TAILLE DU MARCHÉ DE LA CHALEUR ET DE L'ÉNERGIE COMBINÉE EN RÉSEAU DANS LE RESTE DE L'AMÉRIQUE DU SUD & PRÉVISIONS, PAR APPLICATION, 2019-2032 (MILLIARDS USD)
    127. TABLEAU 124. ESTIMATIONS DE LA TAILLE DU MARCHÉ DE LA CHALEUR ET DE L'ÉNERGIE COMBINÉE EN RÉSEAU DANS LE RESTE DE L'AMÉRIQUE DU SUD & PRÉVISIONS, PAR TYPE DE CARBURANT, 2019-2032 (MILLIARDS USD)
    128. TABLEAU 125. ESTIMATIONS DE LA TAILLE DU MARCHÉ DE LA CHALEUR ET DE L'ÉNERGIE COMBINÉE EN RÉSEAU DANS LE RESTE DE L'AMÉRIQUE DU SUD & PRÉVISIONS, PAR CONFIGURATION DU SYSTÈME, 2019-2032 (MILLIARDS USD)
    129. TABLEAU 126. ESTIMATIONS DE LA TAILLE DU MARCHÉ DE LA CHALEUR ET DE L'ÉNERGIE COMBINÉE EN RÉSEAU DANS LE RESTE DE L'AMÉRIQUE DU SUD & PRÉVISIONS, PAR RÉGION, 2019-2032 (MILLIARDS USD)
    130. TABLEAU 127. ESTIMATIONS DE LA TAILLE DU MARCHÉ DE LA CHALEUR ET DE L'ÉNERGIE COMBINÉE EN RÉSEAU DANS LA MEA & PRÉVISIONS, PAR TECHNOLOGIE, 2019-2032 (MILLIARDS USD)
    131. TABLEAU 128. ESTIMATIONS DE LA TAILLE DU MARCHÉ DE LA CHALEUR ET DE L'ÉNERGIE COMBINÉE EN RÉSEAU DANS LA MEA & PRÉVISIONS, PAR APPLICATION, 2019-2032 (MILLIARDS USD)
    132. TABLEAU 129. ESTIMATIONS DE LA TAILLE DU MARCHÉ DE LA CHALEUR ET DE L'ÉNERGIE COMBINÉE EN RÉSEAU DANS LA MEA & PRÉVISIONS, PAR TYPE DE CARBURANT, 2019-2032 (MILLIARDS USD)
    133. TABLEAU 130. ESTIMATIONS DE LA TAILLE DU MARCHÉ DE LA CHALEUR ET DE L'ÉNERGIE COMBINÉE EN RÉSEAU DANS LA MEA & PRÉVISIONS, PAR CONFIGURATION DU SYSTÈME, 2019-2032 (MILLIARDS USD)
    134. TABLEAU 131. ESTIMATIONS DE LA TAILLE DU MARCHÉ DE LA CHALEUR ET DE L'ÉNERGIE COMBINÉE EN RÉSEAU DANS LA MEA & PRÉVISIONS, PAR RÉGION, 2019-2032 (MILLIARDS USD)
    135. TABLEAU 132. ESTIMATIONS DE LA TAILLE DU MARCHÉ DE LA CHALEUR ET DE L'ÉNERGIE COMBINÉE EN RÉSEAU DANS LES PAYS DU CCG & PRÉVISIONS, PAR TECHNOLOGIE, 2019-2032 (MILLIARDS USD)
    136. TABLEAU 133. ESTIMATIONS DE LA TAILLE DU MARCHÉ DE LA CHALEUR ET DE L'ÉNERGIE COMBINÉE EN RÉSEAU DANS LES PAYS DU CCG & PRÉVISIONS, PAR APPLICATION, 2019-2032 (MILLIARDS USD)
    137. TABLEAU 134. ESTIMATIONS DE LA TAILLE DU MARCHÉ DE LA CHALEUR ET DE L'ÉNERGIE COMBINÉE EN RÉSEAU DANS LES PAYS DU CCG & PRÉVISIONS, PAR TYPE DE CARBURANT, 2019-2032 (MILLIARDS USD)
    138. TABLEAU 135. ESTIMATIONS DE LA TAILLE DU MARCHÉ DE LA CHALEUR ET DE L'ÉNERGIE COMBINÉE EN RÉSEAU DANS LES PAYS DU CCG & PRÉVISIONS, PAR CONFIGURATION DU SYSTÈME, 2019-2032 (MILLIARDS USD)
    139. TABLEAU 136. ESTIMATIONS DE LA TAILLE DU MARCHÉ DE LA CHALEUR ET DE L'ÉNERGIE COMBINÉE EN RÉSEAU DANS LES PAYS DU CCG & PRÉVISIONS, PAR RÉGION, 2019-2032 (MILLIARDS USD)
    140. TABLEAU 137. ESTIMATIONS DE LA TAILLE DU MARCHÉ DE LA CHALEUR ET DE L'ÉNERGIE COMBINÉE EN RÉSEAU EN AFRIQUE DU SUD & PRÉVISIONS, PAR TECHNOLOGIE, 2019-2032 (MILLIARDS USD)
    141. TABLEAU 138. ESTIMATIONS DE LA TAILLE DU MARCHÉ DE LA CHALEUR ET DE L'ÉNERGIE COMBINÉE EN RÉSEAU EN AFRIQUE DU SUD & PRÉVISIONS, PAR APPLICATION, 2019-2032 (MILLIARDS USD)
    142. TABLEAU 139. ESTIMATIONS DE LA TAILLE DU MARCHÉ DE LA CHALEUR ET DE L'ÉNERGIE COMBINÉE EN RÉSEAU EN AFRIQUE DU SUD & PRÉVISIONS, PAR TYPE DE CARBURANT, 2019-2032 (MILLIARDS USD)
    143. TABLEAU 140. ESTIMATIONS DE LA TAILLE DU MARCHÉ DE LA CHALEUR ET DE L'ÉNERGIE COMBINÉE EN RÉSEAU EN AFRIQUE DU SUD & PRÉVISIONS, PAR CONFIGURATION DU SYSTÈME, 2019-2032 (MILLIARDS USD)
    144. TABLEAU 141. ESTIMATIONS DE LA TAILLE DU MARCHÉ DE LA CHALEUR ET DE L'ÉNERGIE COMBINÉE EN RÉSEAU EN AFRIQUE DU SUD & PRÉVISIONS, PAR RÉGION, 2019-2032 (MILLIARDS USD)
    145. TABLEAU 142. ESTIMATIONS DE LA TAILLE DU MARCHÉ DE LA CHALEUR ET DE L'ÉNERGIE COMBINÉE EN RÉSEAU DANS LE RESTE DE LA MEA & PRÉVISIONS, PAR TECHNOLOGIE, 2019-2032 (MILLIARDS USD)
    146. TABLEAU 143. ESTIMATIONS DE LA TAILLE DU MARCHÉ DE LA CHALEUR ET DE L'ÉNERGIE COMBINÉE EN RÉSEAU DANS LE RESTE DE LA MEA & PRÉVISIONS, PAR APPLICATION, 2019-2032 (MILLIARDS USD)
    147. TABLEAU 144. ESTIMATIONS DE LA TAILLE DU MARCHÉ DE LA CHALEUR ET DE L'ÉNERGIE COMBINÉE EN RÉSEAU DANS LE RESTE DE LA MEA & PRÉVISIONS, PAR TYPE DE CARBURANT, 2019-2032 (MILLIARDS USD)
    148. TABLEAU 145. ESTIMATIONS DE LA TAILLE DU MARCHÉ DE LA CHALEUR ET DE L'ÉNERGIE COMBINÉE EN RÉSEAU DANS LE RESTE DE LA MEA & PRÉVISIONS, PAR CONFIGURATION DU SYSTÈME, 2019-2032 (MILLIARDS USD)
    149. TABLEAU 146. ESTIMATIONS DE LA TAILLE DU MARCHÉ DE LA CHALEUR ET DE L'ÉNERGIE COMBINÉE EN RÉSEAU DANS LE RESTE DE LA MEA & PRÉVISIONS, PAR RÉGION, 2019-2032 (MILLIARDS USD)
    150. TABLEAU 147. LANCEMENT DE PRODUIT / DÉVELOPPEMENT DE PRODUIT / APPROBATION
    151. TABLEAU 148. ACQUISITION / PARTENARIAT
  14. LISTE DES FIGURES
  15. FIGURE 1 SYNOPSIS DU MARCHÉ
  16. FIGURE 2 ANALYSE DU MARCHÉ DE LA CHALEUR ET DE L'ÉNERGIE COMBINÉE EN RÉSEAU EN AMÉRIQUE DU NORD
  17. FIGURE 3 ANALYSE DU MARCHÉ DE LA CHALEUR ET DE L'ÉNERGIE COMBINÉE EN RÉSEAU AUX ÉTATS-UNIS PAR TECHNOLOGIE
  18. FIGURE 4 ANALYSE DU MARCHÉ DE LA CHALEUR ET DE L'ÉNERGIE COMBINÉE EN RÉSEAU AUX ÉTATS-UNIS PAR APPLICATION
  19. FIGURE 5 ANALYSE DU MARCHÉ DE LA CHALEUR ET DE L'ÉNERGIE COMBINÉE EN RÉSEAU AUX ÉTATS-UNIS PAR TYPE DE CARBURANT
  20. FIGURE 6 ANALYSE DU MARCHÉ DE LA CHALEUR ET DE L'ÉNERGIE COMBINÉE EN RÉSEAU AUX ÉTATS-UNIS PAR CONFIGURATION DU SYSTÈME
  21. FIGURE 7 ANALYSE DU MARCHÉ DE LA CHALEUR ET DE L'ÉNERGIE COMBINÉE EN RÉSEAU AUX ÉTATS-UNIS PAR RÉGION
  22. FIGURE 8 ANALYSE DU MARCHÉ DE LA CHALEUR ET DE L'ÉNERGIE COMBINÉE EN RÉSEAU AU CANADA PAR TECHNOLOGIE
  23. FIGURE 9 ANALYSE DU MARCHÉ DE LA CHALEUR ET DE L'ÉNERGIE COMBINÉE EN RÉSEAU AU CANADA PAR APPLICATION
  24. FIGURE 10 ANALYSE DU MARCHÉ DE LA CHALEUR ET DE L'ÉNERGIE COMBINÉE EN RÉSEAU AU CANADA PAR TYPE DE CARBURANT
  25. FIGURE 11 ANALYSE DU MARCHÉ DE LA CHALEUR ET DE L'ÉNERGIE COMBINÉE EN RÉSEAU AU CANADA PAR CONFIGURATION DU SYSTÈME
  26. FIGURE 12 ANALYSE DU MARCHÉ DE LA CHALEUR ET DE L'ÉNERGIE COMBINÉE EN RÉSEAU AU CANADA PAR RÉGION
  27. FIGURE 13 ANALYSE DU MARCHÉ DE LA CHALEUR ET DE L'ÉNERGIE COMBINÉE EN RÉSEAU EN EUROPE
  28. FIGURE 14 ANALYSE DU MARCHÉ DE LA CHALEUR ET DE L'ÉNERGIE COMBINÉE EN RÉSEAU EN ALLEMAGNE PAR TECHNOLOGIE
  29. FIGURE 15 ANALYSE DU MARCHÉ DE LA CHALEUR ET DE L'ÉNERGIE COMBINÉE EN RÉSEAU EN ALLEMAGNE PAR APPLICATION
  30. FIGURE 16 ANALYSE DU MARCHÉ DE LA CHALEUR ET DE L'ÉNERGIE COMBINÉE EN RÉSEAU EN ALLEMAGNE PAR TYPE DE CARBURANT
  31. FIGURE 17 ANALYSE DU MARCHÉ DE LA CHALEUR ET DE L'ÉNERGIE COMBINÉE EN RÉSEAU EN ALLEMAGNE PAR CONFIGURATION DU SYSTÈME
  32. FIGURE 18 ANALYSE DU MARCHÉ DE LA CHALEUR ET DE L'ÉNERGIE COMBINÉE EN RÉSEAU EN ALLEMAGNE PAR RÉGION
  33. FIGURE 19 ANALYSE DU MARCHÉ DE LA CHALEUR ET DE L'ÉNERGIE COMBINÉE EN RÉSEAU AU ROYAUME-UNI PAR TECHNOLOGIE
  34. FIGURE 20 ANALYSE DU MARCHÉ DE LA CHALEUR ET DE L'ÉNERGIE COMBINÉE EN RÉSEAU AU ROYAUME-UNI PAR APPLICATION
  35. FIGURE 21 ANALYSE DU MARCHÉ DE LA CHALEUR ET DE L'ÉNERGIE COMBINÉE EN RÉSEAU AU ROYAUME-UNI PAR TYPE DE CARBURANT
  36. FIGURE 22 ANALYSE DU MARCHÉ DE LA CHALEUR ET DE L'ÉNERGIE COMBINÉE EN RÉSEAU AU ROYAUME-UNI PAR CONFIGURATION DU SYSTÈME
  37. FIGURE 23 ANALYSE DU MARCHÉ DE LA CHALEUR ET DE L'ÉNERGIE COMBINÉE EN RÉSEAU AU ROYAUME-UNI PAR RÉGION
  38. FIGURE 24 ANALYSE DU MARCHÉ DE LA CHALEUR ET DE L'ÉNERGIE COMBINÉE EN RÉSEAU EN FRANCE PAR TECHNOLOGIE
  39. FIGURE 25 ANALYSE DU MARCHÉ DE LA CHALEUR ET DE L'ÉNERGIE COMBINÉE EN RÉSEAU EN FRANCE PAR APPLICATION
  40. FIGURE 26 ANALYSE DU MARCHÉ DE LA CHALEUR ET DE L'ÉNERGIE COMBINÉE EN RÉSEAU EN FRANCE PAR TYPE DE CARBURANT
  41. FIGURE 27 ANALYSE DU MARCHÉ DE LA CHALEUR ET DE L'ÉNERGIE COMBINÉE EN RÉSEAU EN FRANCE PAR CONFIGURATION DU SYSTÈME
  42. FIGURE 28 ANALYSE DU MARCHÉ DE LA CHALEUR ET DE L'ÉNERGIE COMBINÉE EN RÉSEAU EN FRANCE PAR RÉGION
  43. FIGURE 29 ANALYSE DU MARCHÉ DE LA CHALEUR ET DE L'ÉNERGIE COMBINÉE EN RÉSEAU EN RUSSIE PAR TECHNOLOGIE
  44. FIGURE 30 ANALYSE DU MARCHÉ DE LA CHALEUR ET DE L'ÉNERGIE COMBINÉE EN RÉSEAU EN RUSSIE PAR APPLICATION
  45. FIGURE 31 ANALYSE DU MARCHÉ DE LA CHALEUR ET DE L'ÉNERGIE COMBINÉE EN RÉSEAU EN RUSSIE PAR TYPE DE CARBURANT
  46. FIGURE 32 ANALYSE DU MARCHÉ DE LA CHALEUR ET DE L'ÉNERGIE COMBINÉE EN RÉSEAU EN RUSSIE PAR CONFIGURATION DU SYSTÈME
  47. FIGURE 33 ANALYSE DU MARCHÉ DE LA CHALEUR ET DE L'ÉNERGIE COMBINÉE EN RÉSEAU EN RUSSIE PAR RÉGION
  48. FIGURE 34 ANALYSE DU MARCHÉ DE LA CHALEUR ET DE L'ÉNERGIE COMBINÉE EN RÉSEAU EN ITALIE PAR TECHNOLOGIE
  49. FIGURE 35 ANALYSE DU MARCHÉ DE LA CHALEUR ET DE L'ÉNERGIE COMBINÉE EN RÉSEAU EN ITALIE PAR APPLICATION
  50. FIGURE 36 ANALYSE DU MARCHÉ DE LA CHALEUR ET DE L'ÉNERGIE COMBINÉE EN RÉSEAU EN ITALIE PAR TYPE DE CARBURANT
  51. FIGURE 37 ANALYSE DU MARCHÉ DE LA CHALEUR ET DE L'ÉNERGIE COMBINÉE EN RÉSEAU EN ITALIE PAR CONFIGURATION DU SYSTÈME
  52. FIGURE 38 ANALYSE DU MARCHÉ DE LA CHALEUR ET DE L'ÉNERGIE COMBINÉE EN RÉSEAU EN ITALIE PAR RÉGION
  53. FIGURE 39 ANALYSE DU MARCHÉ DE LA CHALEUR ET DE L'ÉNERGIE COMBINÉE EN RÉSEAU EN ESPAGNE PAR TECHNOLOGIE
  54. FIGURE 40 ANALYSE DU MARCHÉ DE LA CHALEUR ET DE L'ÉNERGIE COMBINÉE EN RÉSEAU EN ESPAGNE PAR APPLICATION
  55. FIGURE 41 ANALYSE DU MARCHÉ DE LA CHALEUR ET DE L'ÉNERGIE COMBINÉE EN RÉSEAU EN ESPAGNE PAR TYPE DE CARBURANT
  56. FIGURE 42 ANALYSE DU MARCHÉ DE LA CHALEUR ET DE L'ÉNERGIE COMBINÉE EN RÉSEAU EN ESPAGNE PAR CONFIGURATION DU SYSTÈME
  57. FIGURE 43 ANALYSE DU MARCHÉ DE LA CHALEUR

Segmentation du marché de la production combinée de chaleur et d'électricité en réseau

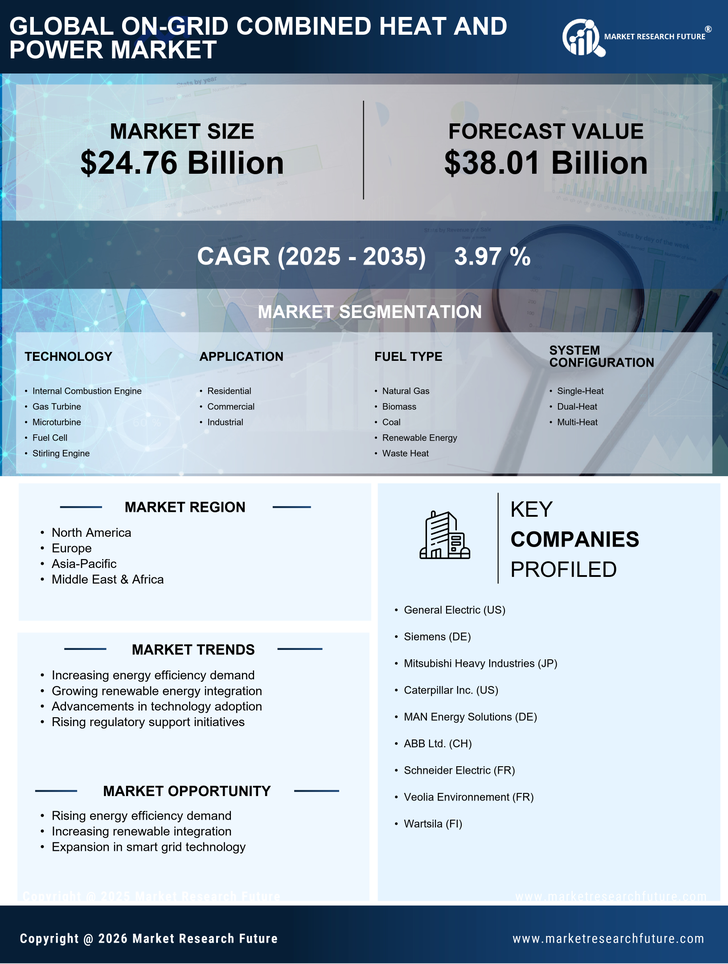
  • Marché de la production combinée de chaleur et d'électricité en réseau par technologie (milliards USD, 2019-2032)
    • Moteur à combustion interne
    • Turbine à gaz
    • Microturbine
    • Pile à hydrogène
    • Moteur Stirling


  • Marché de la production combinée de chaleur et d'électricité en réseau par application (milliards USD, 2019-2032)
    • Résidentiel
    • Commercial
    • Industriel


  • Marché de la production combinée de chaleur et d'électricité en réseau par type de combustible (milliards USD, 2019-2032)
    • Gaz naturel
    • Biomasse
    • Charbon
    • Énergie renouvelable
    • Chaleur résiduelle


  • Marché de la production combinée de chaleur et d'électricité en réseau par configuration de système (milliards USD, 2019-2032)
    • Chaleur unique
    • Chaleur double
    • Chaleur multiple


  • Marché de la production combinée de chaleur et d'électricité en réseau par région (milliards USD, 2019-2032)
    • Amérique du Nord
    • Europe
    • Amérique du Sud
    • Asie-Pacifique
    • Moyen-Orient et Afrique


Perspectives régionales du marché de la production combinée de chaleur et d'électricité en réseau (milliards USD, 2019-2032)


  • Perspectives de l'Amérique du Nord (milliards USD, 2019-2032)
    • Marché de la production combinée de chaleur et d'électricité en réseau en Amérique du Nord par type de technologie
      • Moteur à combustion interne
      • Turbine à gaz
      • Microturbine
      • Pile à hydrogène
      • Moteur Stirling
    • Marché de la production combinée de chaleur et d'électricité en réseau en Amérique du Nord par type d'application
      • Résidentiel
      • Commercial
      • Industriel
    • Marché de la production combinée de chaleur et d'électricité en réseau en Amérique du Nord par type de combustible
      • Gaz naturel
      • Biomasse
      • Charbon
      • Énergie renouvelable
      • Chaleur résiduelle
    • Marché de la production combinée de chaleur et d'électricité en réseau en Amérique du Nord par type de configuration de système
      • Chaleur unique
      • Chaleur double
      • Chaleur multiple
    • Marché de la production combinée de chaleur et d'électricité en réseau en Amérique du Nord par type régional
      • États-Unis
      • Canada
    • Perspectives des États-Unis (milliards USD, 2019-2032)
    • Marché de la production combinée de chaleur et d'électricité en réseau aux États-Unis par type de technologie
      • Moteur à combustion interne
      • Turbine à gaz
      • Microturbine
      • Pile à hydrogène
      • Moteur Stirling
    • Marché de la production combinée de chaleur et d'électricité en réseau aux États-Unis par type d'application
      • Résidentiel
      • Commercial
      • Industriel
    • Marché de la production combinée de chaleur et d'électricité en réseau aux États-Unis par type de combustible
      • Gaz naturel
      • Biomasse
      • Charbon
      • Énergie renouvelable
      • Chaleur résiduelle
    • Marché de la production combinée de chaleur et d'électricité en réseau aux États-Unis par type de configuration de système
      • Chaleur unique
      • Chaleur double
      • Chaleur multiple
    • Perspectives du Canada (milliards USD, 2019-2032)
    • Marché de la production combinée de chaleur et d'électricité en réseau au Canada par type de technologie
      • Moteur à combustion interne
      • Turbine à gaz
      • Microturbine
      • Pile à hydrogène
      • Moteur Stirling
    • Marché de la production combinée de chaleur et d'électricité en réseau au Canada par type d'application
      • Résidentiel
      • Commercial
      • Industriel
    • Marché de la production combinée de chaleur et d'électricité en réseau au Canada par type de combustible
      • Gaz naturel
      • Biomasse
      • Charbon
      • Énergie renouvelable
      • Chaleur résiduelle
    • Marché de la production combinée de chaleur et d'électricité en réseau au Canada par type de configuration de système
      • Chaleur unique
      • Chaleur double
      • Chaleur multiple
    • Perspectives de l'Europe (milliards USD, 2019-2032)
      • Marché de la production combinée de chaleur et d'électricité en réseau en Europe par type de technologie
        • Moteur à combustion interne
        • Turbine à gaz
        • Microturbine
        • Pile à hydrogène
        • Moteur Stirling
      • Marché de la production combinée de chaleur et d'électricité en réseau en Europe par type d'application
        • Résidentiel
        • Commercial
        • Industriel
      • Marché de la production combinée de chaleur et d'électricité en réseau en Europe par type de combustible
        • Gaz naturel
        • Biomasse
        • Charbon
        • Énergie renouvelable
        • Chaleur résiduelle
      • Marché de la production combinée de chaleur et d'électricité en réseau en Europe par type de configuration de système
        • Chaleur unique
        • Chaleur double
        • Chaleur multiple
      • Marché de la production combinée de chaleur et d'électricité en réseau en Europe par type régional
        • Allemagne
        • Royaume-Uni
        • France
        • Russie
        • Italie
        • Espagne
        • Reste de l'Europe
      • Perspectives de l'Allemagne (milliards USD, 2019-2032)
      • Marché de la production combinée de chaleur et d'électricité en réseau en Allemagne par type de technologie
        • Moteur à combustion interne
        • Turbine à gaz
        • Microturbine
        • Pile à hydrogène
        • Moteur Stirling
      • Marché de la production combinée de chaleur et d'électricité en réseau en Allemagne par type d'application
        • Résidentiel
        • Commercial
        • Industriel
      • Marché de la production combinée de chaleur et d'électricité en réseau en Allemagne par type de combustible
        • Gaz naturel
        • Biomasse
        • Charbon
        • Énergie renouvelable
        • Chaleur résiduelle
      • Marché de la production combinée de chaleur et d'électricité en réseau en Allemagne par type de configuration de système
        • Chaleur unique
        • Chaleur double
        • Chaleur multiple
      • Perspectives du Royaume-Uni (milliards USD, 2019-2032)
      • Marché de la production combinée de chaleur et d'électricité en réseau au Royaume-Uni par type de technologie
        • Moteur à combustion interne
        • Turbine à gaz
        • Microturbine
        • Pile à hydrogène
        • Moteur Stirling
      • Marché de la production combinée de chaleur et d'électricité en réseau au Royaume-Uni par type d'application
        • Résidentiel
        • Commercial
        • Industriel
      • Marché de la production combinée de chaleur et d'électricité en réseau au Royaume-Uni par type de combustible
        • Gaz naturel
        • Biomasse
        • Charbon
        • Énergie renouvelable
        • Chaleur résiduelle
      • Marché de la production combinée de chaleur et d'électricité en réseau au Royaume-Uni par type de configuration de système
        • Chaleur unique
        • Chaleur double
        • Chaleur multiple
      • Perspectives de la France (milliards USD, 2019-2032)
      • Marché de la production combinée de chaleur et d'électricité en réseau en France par type de technologie
        • Moteur à combustion interne
        • Turbine à gaz
        • Microturbine
        • Pile à hydrogène
        • Moteur Stirling
      • Marché de la production combinée de chaleur et d'électricité en réseau en France par type d'application
        • Résidentiel
        • Commercial
        • Industriel
      • Marché de la production combinée de chaleur et d'électricité en réseau en France par type de combustible
        • Gaz naturel
        • Biomasse
        • Charbon
        • Énergie renouvelable
        • Chaleur résiduelle
      • Marché de la production combinée de chaleur et d'électricité en réseau en France par type de configuration de système
        • Chaleur unique
        • Chaleur double
        • Chaleur multiple
      • Perspectives de la Russie (milliards USD, 2019-2032)
      • Marché de la production combinée de chaleur et d'électricité en réseau en Russie par type de technologie
        • Moteur à combustion interne
        • Turbine à gaz
        • Microturbine
        • Pile à hydrogène
        • Moteur Stirling
      • Marché de la production combinée de chaleur et d'électricité en réseau en Russie par type d'application
        • Résidentiel
        • Commercial
        • Industriel
      • Marché de la production combinée de chaleur et d'électricité en réseau en Russie par type de combustible
        • Gaz naturel
        • Biomasse
        • Charbon
        • Énergie renouvelable
        • Chaleur résiduelle
      • Marché de la production combinée de chaleur et d'électricité en réseau en Russie par type de configuration de système
        • Chaleur unique
        • Chaleur double
        • Chaleur multiple
      • Perspectives de l'Italie (milliards USD, 2019-2032)
      • Marché de la production combinée de chaleur et d'électricité en réseau en Italie par type de technologie
        • Moteur à combustion interne
        • Turbine à gaz
        • Microturbine
        • Pile à hydrogène
        • Moteur Stirling
      • Marché de la production combinée de chaleur et d'électricité en réseau en Italie par type d'application
        • Résidentiel
        • Commercial
        • Industriel
      • Marché de la production combinée de chaleur et d'électricité en réseau en Italie par type de combustible
        • Gaz naturel
        • Biomasse
        • Charbon
        • Énergie renouvelable
        • Chaleur résiduelle
      • Marché de la production combinée de chaleur et d'électricité en réseau en Italie par type de configuration de système
        • Chaleur unique
        • Chaleur double
        • Chaleur multiple
      • Perspectives de l'Espagne (milliards USD, 2019-2032)
      • Marché de la production combinée de chaleur et d'électricité en réseau en Espagne par type de technologie
        • Moteur à combustion interne
        • Turbine à gaz
        • Microturbine
        • Pile à hydrogène
        • Moteur Stirling
      • Marché de la production combinée de chaleur et d'électricité en réseau en Espagne par type d'application
        • Résidentiel
        • Commercial
        • Industriel
      • Marché de la production combinée de chaleur et d'électricité en réseau en Espagne par type de combustible
        • Gaz naturel
        • Biomasse
        • Charbon
        • Énergie renouvelable
        • Chaleur résiduelle
      • Marché de la production combinée de chaleur et d'électricité en réseau en Espagne par type de configuration de système
        • Chaleur unique
        • Chaleur double
        • Chaleur multiple
      • Perspectives du reste de l'Europe (milliards USD, 2019-2032)
      • Marché de la production combinée de chaleur et d'électricité en réseau dans le reste de l'Europe par type de technologie
        • Moteur à combustion interne
        • Turbine à gaz
        • Microturbine
        • Pile à hydrogène
        • Moteur Stirling
      • Marché de la production combinée de chaleur et d'électricité en réseau dans le reste de l'Europe par type d'application
        • Résidentiel
        • Commercial
        • Industriel
      • Marché de la production combinée de chaleur et d'électricité en réseau dans le reste de l'Europe par type de combustible
        • Gaz naturel
        • Biomasse
        • Charbon
        • Énergie renouvelable
        • Chaleur résiduelle
      • Marché de la production combinée de chaleur et d'électricité en réseau dans le reste de l'Europe par type de configuration de système
        • Chaleur unique
        • Chaleur double
        • Chaleur multiple
      • Perspectives de l'APAC (milliards USD, 2019-2032)
        • Marché de la production combinée de chaleur et d'électricité en réseau en APAC par type de technologie
          • Moteur à combustion interne
          • Turbine à gaz
          • Microturbine
          • Pile à hydrogène
          • Moteur Stirling
        • Marché de la production combinée de chaleur et d'électricité en réseau en APAC par type d'application
          • Résidentiel
          • Commercial
          • Industriel
        • Marché de la production combinée de chaleur et d'électricité en réseau en APAC par type de combustible
          • Gaz naturel
          • Biomasse
          • Charbon
          • Énergie renouvelable
          • Chaleur résiduelle
        • Marché de la production combinée de chaleur et d'électricité en réseau en APAC par type de configuration de système
          • Chaleur unique
          • Chaleur double
          • Chaleur multiple
        • Marché de la production combinée de chaleur et d'électricité en réseau en APAC par type régional
          • Chine
          • Inde
          • Japon
          • Corée du Sud
          • Malaisie
          • Thaïlande
          • Indonésie
          • Reste de l'APAC
        • Perspectives de la Chine (milliards USD, 2019-2032)
        • Marché de la production combinée de chaleur et d'électricité en réseau en Chine par type de technologie
          • Moteur à combustion interne
          • Turbine à gaz
          • Microturbine
          • Pile à hydrogène
          • Moteur Stirling
        • Marché de la production combinée de chaleur et d'électricité en réseau en Chine par type d'application
          • Résidentiel
          • Commercial
          • Industriel
        • Marché de la production combinée de chaleur et d'électricité en réseau en Chine par type de combustible
          • Gaz naturel
          • Biomasse
          • Charbon
          • Énergie renouvelable
          • Chaleur résiduelle
        • Marché de la production combinée de chaleur et d'électricité en réseau en Chine par type de configuration de système
          • Chaleur unique
          • Chaleur double
          • Chaleur multiple
        • Perspectives de l'Inde (milliards USD, 2019-2032)
        • Marché de la production combinée de chaleur et d'électricité en réseau en Inde par type de technologie
          • Moteur à combustion interne
          • Turbine à gaz
          • Microturbine
          • Pile à hydrogène
          • Moteur Stirling
        • Marché de la production combinée de chaleur et d'électricité en réseau en Inde par type d'application
          • Résidentiel
          • Commercial
          • Industriel
        • Marché de la production combinée de chaleur et d'électricité en réseau en Inde par type de combustible
          • Gaz naturel
          • Biomasse
          • Charbon
          • Énergie renouvelable
          • Chaleur résiduelle
        • Marché de la production combinée de chaleur et d'électricité en réseau en Inde par type de configuration de système
          • Chaleur unique
          • Chaleur double
          • Chaleur multiple
        • Perspectives du Japon (milliards USD, 2019-2032)
        • Marché de la production combinée de chaleur et d'électricité en réseau au Japon par type de technologie
          • Moteur à combustion interne
          • Turbine à gaz
          • Microturbine
          • Pile à hydrogène
          • Moteur Stirling
        • Marché de la production combinée de chaleur et d'électricité en réseau au Japon par type d'application
          • Résidentiel
          • Commercial
          • Industriel
        • Marché de la production combinée de chaleur et d'électricité en réseau au Japon par type de combustible
          • Gaz naturel
          • Biomasse
          • Charbon
          • Énergie renouvelable
          • Chaleur résiduelle
        • Marché de la production combinée de chaleur et d'électricité en réseau au Japon par type de configuration de système
          • Chaleur unique
          • Chaleur double
          • Chaleur multiple
        • Perspectives de la Corée du Sud (milliards USD, 2019-2032)
        • Marché de la production combinée de chaleur et d'électricité en réseau en Corée du Sud par type de technologie
          • Moteur à combustion interne
          • Turbine à gaz
          • Microturbine
          • Pile à hydrogène
          • Moteur Stirling
        • Marché de la production combinée de chaleur et d'électricité en réseau en Corée du Sud par type d'application
          • Résidentiel
          • Commercial
          • Industriel
        • Marché de la production combinée de chaleur et d'électricité en réseau en Corée du Sud par type de combustible
          • Gaz naturel
          • Biomasse
          • Charbon
          • Énergie renouvelable
          • Chaleur résiduelle
        • Marché de la production combinée de chaleur et d'électricité en réseau en Corée du Sud par type de configuration de système
          • Chaleur unique
          • Chaleur double
          • Chaleur multiple
        • Perspectives de la Malaisie (milliards USD, 2019-2032)
        • Marché de la production combinée de chaleur et d'électricité en réseau en Malaisie par type de technologie
          • Moteur à combustion interne
          • Turbine à gaz
          • Microturbine
          • Pile à hydrogène
          • Moteur Stirling
        • Marché de la production combinée de chaleur et d'électricité en réseau en Malaisie par type d'application
          • Résidentiel
          • Commercial
          • Industriel
        • Marché de la production combinée de chaleur et d'électricité en réseau en Malaisie par type de combustible
          • Gaz naturel
          • Biomasse
          • Charbon
          • Énergie renouvelable
          • Chaleur résiduelle
        • Marché de la production combinée de chaleur et d'électricité en réseau en Malaisie par type de configuration de système
          • Chaleur unique
          • Chaleur double
          • Chaleur multiple
        • Perspectives de la Thaïlande (milliards USD, 2019-2032)
        • Marché de la production combinée de chaleur et d'électricité en réseau en Thaïlande par type de technologie
          • Moteur à combustion interne
          • Turbine à gaz
          • Microturbine
          • Pile à hydrogène
          • Moteur Stirling
        • Marché de la production combinée de chaleur et d'électricité en réseau en Thaïlande par type d'application
          • Résidentiel
          • Commercial
          • Industriel
        • Marché de la production combinée de chaleur et d'électricité en réseau en Thaïlande par type de combustible
          • Gaz naturel
          • Biomasse
          • Charbon
          • Énergie renouvelable
          • Chaleur résiduelle
        • Marché de la production combinée de chaleur et d'électricité en réseau en Thaïlande par type de configuration de système
          • Chaleur unique
          • Chaleur double
          • Chaleur multiple
        • Perspectives de l'Indonésie (milliards USD, 2019-2032)
        • Marché de la production combinée de chaleur et d'électricité en réseau en Indonésie par type de technologie
          • Moteur à combustion interne
          • Turbine à gaz
          • Microturbine
          • Pile à hydrogène
          • Moteur Stirling
        • Marché de la production combinée de chaleur et d'électricité en réseau en Indonésie par type d'application
          • Résidentiel
          • Commercial
          • Industriel
        • Marché de la production combinée de chaleur et d'électricité en réseau en Indonésie par type de combustible
          • Gaz naturel
          • Biomasse
          • Charbon
          • Énergie renouvelable
          • Chaleur résiduelle
        • Marché de la production combinée de chaleur et d'électricité en réseau en Indonésie par type de configuration de système
          • Chaleur unique
          • Chaleur double
          • Chaleur multiple
        • Perspectives du reste de l'APAC (milliards USD, 2019-2032)
        • Marché de la production combinée de chaleur et d'électricité en réseau dans le reste de l'APAC par type de technologie
          • Moteur à combustion interne
          • Turbine à gaz
          • Microturbine
          • Pile à hydrogène
          • Moteur Stirling
        • Marché de la production combinée de chaleur et d'électricité en réseau dans le reste de l'APAC par type d'application
          • Résidentiel
          • Commercial
          • Industriel
        • Marché de la production combinée de chaleur et d'électricité en réseau dans le reste de l'APAC par type de combustible
          • Gaz naturel
          • Biomasse
          • Charbon
          • Énergie renouvelable
          • Chaleur résiduelle
        • Marché de la production combinée de chaleur et d'électricité en réseau dans le reste de l'APAC par type de configuration de système
          • Chaleur unique
          • Chaleur double
          • Chaleur multiple
        • Perspectives de l'Amérique du Sud (milliards USD, 2019-2032)
          • Marché de la production combinée de chaleur et d'électricité en réseau en Amérique du Sud par type de technologie
            • Moteur à combustion interne
            • Turbine à gaz
            • Microturbine
            • Pile à hydrogène
            • Moteur Stirling
          • Marché de la production combinée de chaleur et d'électricité en réseau en Amérique du Sud par type d'application
            • Résidentiel
            • Commercial
            • Industriel
          • Marché de la production combinée de chaleur et d'électricité en réseau en Amérique du Sud par type de combustible
            • Gaz naturel
            • Biomasse
            • Charbon
            • Énergie renouvelable
            • Chaleur résiduelle
          • Marché de la production combinée de chaleur et d'électricité en réseau en Amérique du Sud par type de configuration de système
            • Chaleur unique
            • Chaleur double
            • Chaleur multiple
          • Marché de la production combinée de chaleur et d'électricité en réseau en Amérique du Sud par type régional
            • Brésil
            • Mexique
            • Argentine
            • Reste de l'Amérique du Sud
          • Perspectives du Brésil (milliards USD, 2019-2032)
          • Marché de la production combinée de chaleur et d'électricité en réseau au Brésil par type de technologie
            • Moteur à combustion interne
            • Turbine à gaz
            • Microturbine
            • Pile à hydrogène
            • Moteur Stirling
          • Marché de la production combinée de chaleur et d'électricité en réseau au Brésil par type d'application
            • Résidentiel
            • Commercial
            • Industriel
          • Marché de la production combinée de chaleur et d'électricité en réseau au Brésil par type de combustible
            • Gaz naturel
            • Biomasse
            • Charbon
            • Énergie renouvelable
            • Chaleur résiduelle
          • Marché de la production combinée de chaleur et d'électricité en réseau au Brésil par type de configuration de système
            • Chaleur unique
            • Chaleur double
            • Chaleur multiple
          • Perspectives du Mexique (milliards USD, 2019-2032)
          • Marché de la production combinée de chaleur et d'électricité en réseau au Mexique par type de technologie
            • Moteur à combustion interne
            • Turbine à gaz
            • Microturbine
            • Pile à hydrogène
            • Moteur Stirling
          • Marché de la production combinée de chaleur et d'électricité en réseau au Mexique par type d'application
            • Résidentiel
            • Commercial
            • Industriel
          • Marché de la production combinée de chaleur et d'électricité en réseau au Mexique par type de combustible
            • Gaz naturel
            • Biomasse
            • Charbon
            • Énergie renouvelable
            • Chaleur résiduelle
          • Marché de la production combinée de chaleur et d'électricité en réseau au Mexique par type de configuration de système
            • Chaleur unique
            • Chaleur double
            • Chaleur multiple
          • Perspectives de l'Argentine (milliards USD, 2019-2032)
          • Marché de la production combinée de chaleur et d'électricité en réseau en Argentine par type de technologie
            • Moteur à combustion interne
            • Turbine à gaz
            • Microturbine
            • Pile à hydrogène
            • Moteur Stirling
          • Marché de la production combinée de chaleur et d'électricité en réseau en Argentine par type d'application
            • Résidentiel
            • Commercial
            • Industriel
          • Marché de la production combinée de chaleur et d'électricité en réseau en Argentine par type de combustible
            • Gaz naturel
            • Biomasse
            • Charbon
            • Énergie renouvelable
            • Chaleur résiduelle
          • Marché de la production combinée de chaleur et d'électricité en réseau en Argentine par type de configuration de système
            • Chaleur unique
            • Chaleur double
            • Chaleur multiple
          • Perspectives du reste de l'Amérique du Sud (milliards USD, 2019-2032)
          • Marché de la production combinée de chaleur et d'électricité en réseau dans le reste de l'Amérique du Sud par type de technologie
            • Moteur à combustion interne
            • Turbine à gaz
            • Microturbine
            • Pile à hydrogène
            • Moteur Stirling
          • Marché de la production combinée de chaleur et d'électricité en réseau dans le reste de l'Amérique du Sud par type d'application
            • Résidentiel
            • Commercial
            • Industriel
          • Marché de la production combinée de chaleur et d'électricité en réseau dans le reste de l'Amérique du Sud par type de combustible
            • Gaz naturel
            • Biomasse
            • Charbon
            • Énergie renouvelable
            • Chaleur résiduelle
          • Marché de la production combinée de chaleur et d'électricité en réseau dans le reste de l'Amérique du Sud par type de configuration de système
            • Chaleur unique
            • Chaleur double
            • Chaleur multiple
          • Perspectives de la MEA (milliards USD, 2019-2032)
            • Marché de la production combinée de chaleur et d'électricité en réseau dans la MEA par type de technologie
              • Moteur à combustion interne
              • Turbine à gaz
              • Microturbine
              • Pile à hydrogène
              • Moteur Stirling
            • Marché de la production combinée de chaleur et d'électricité en réseau dans la MEA par type d'application
              • Résidentiel
              • Commercial
              • Industriel
            • Marché de la production combinée de chaleur et d'électricité en réseau dans la MEA par type de combustible
              • Gaz naturel
              • Biomasse
              • Charbon
              • Énergie renouvelable
              • Chaleur résiduelle
            • Marché de la production combinée de chaleur et d'électricité en réseau dans la MEA par type de configuration de système
              • Chaleur unique
              • Chaleur double
              • Chaleur multiple
            • Marché de la production combinée de chaleur et d'électricité en réseau dans la MEA par type régional
              • Pays du CCG
              • Afrique du Sud
              • Reste de la MEA
            • Perspectives des pays du CCG (milliards USD, 2019-2032)
            • Marché de la production combinée de chaleur et d'électricité en réseau dans les pays du CCG par type de technologie
              • Moteur à combustion interne
              • Turbine à gaz
              • Microturbine
              • Pile à hydrogène
              • Moteur Stirling
            • Marché de la production combinée de chaleur et d'électricité en réseau dans les pays du CCG par type d'application
              • Résidentiel
              • Commercial
              • Industriel
            • Marché de la production combinée de chaleur et d'électricité en réseau dans les pays du CCG par type de combustible
              • Gaz naturel
              • Biomasse
              • Charbon
              • Énergie renouvelable
              • Chaleur résiduelle
            • Marché de la production combinée de chaleur et d'électricité en réseau dans les pays du CCG par type de configuration de système
              • Chaleur unique
              • Chaleur double
              • Chaleur multiple
            • Perspectives de l'Afrique du Sud (milliards USD, 2019-2032)
            • Marché de la production combinée de chaleur et d'électricité en réseau en Afrique du Sud par type de technologie
              • Moteur à combustion interne
              • Turbine à gaz
              • Microturbine
              • Pile à hydrogène
              • Moteur Stirling
            • Marché de la production combinée de chaleur et d'électricité en réseau en Afrique du Sud par type d'application
              • Résidentiel
              • Commercial
              • Industriel
            • Marché de la production combinée de chaleur et d'électricité en réseau en Afrique du Sud par type de combustible
              • Gaz naturel
              • Biomasse
              • Charbon
              • Énergie renouvelable
              • Chaleur résiduelle
            • Marché de la production combinée de chaleur et d'électricité en réseau en Afrique du Sud par type de configuration de système
              • Chaleur unique
              • Chaleur double
              • Chaleur multiple
            • Perspectives du reste de la MEA (milliards USD, 2019-2032)
            • Marché de la production combinée de chaleur et d'électricité en réseau dans le reste de la MEA par type de technologie
              • Moteur à combustion interne
              • Turbine à gaz
              • Microturbine
              • Pile à hydrogène
              • Moteur Stirling
            • Marché de la production combinée de chaleur et d'électricité en réseau dans le reste de la MEA par type d'application
              • Résidentiel
              • Commercial
              • Industriel
            • Marché de la production combinée de chaleur et d'électricité en réseau dans le reste de la MEA par type de combustible
              • Gaz naturel
              • Biomasse
              • Charbon
              • Énergie renouvelable
              • Chaleur résiduelle
            • Marché de la production combinée de chaleur et d'électricité en réseau dans le reste de la MEA par type de configuration de système
              • Chaleur unique
              • Chaleur double
              • Chaleur multiple


Compare Licence

×
Features License Type
Single User Multiuser License Enterprise User
Price $4,950 $5,950 $7,250
Maximum User Access Limit 1 User Upto 10 Users Unrestricted Access Throughout the Organization
Free Customization
Direct Access to Analyst
Deliverable Format
Platform Access
Discount on Next Purchase 10% 15% 15%
Printable Versions