Request Free Sample ×

Kindly complete the form below to receive a free sample of this Report

* Please use a valid business email

Leading companies partner with us for data-driven Insights

clients tt-cursor
Hero Background

Marché des commutateurs Ethernet industriels

ID: MRFR/SEM/4185-HCR
100 Pages
Nirmit Biswas
Last Updated: April 06, 2026

Rapport de recherche sur le marché des commutateurs Ethernet industriels Informations par type (géré et non géré), par domaines d'application (réseau intelligent et sécurité & surveillance), par taille d'organisation (PME et grandes entreprises), par utilisateurs finaux (aérospatiale et défense et pétrole et gaz), et par région (Amérique du Nord, Europe, Asie-Pacifique, et reste du monde) – Prévisions du marché jusqu'en 2035.

Partager
Download PDF ×

We do not share your information with anyone. However, we may send you emails based on your report interest from time to time. You may contact us at any time to opt-out.

Industrial Ethernet Switch Market Infographic
Purchase Options
  1. SECTION I : RÉSUMÉ EXÉCUTIF ET POINTS CLÉS\n\n
    1. 1.1 RÉSUMÉ EXÉCUTIF\n \n
      1. 1.1.1 Vue d'ensemble du marché\n \n
      2. 1.1.2 Conclusions clés\n \n
      3. 1.1.3 Segmentation du marché\n \n
      4. 1.1.4 Paysage concurrentiel\n \n
      5. 1.1.5 Défis et opportunités\n \n
      6. 1.1.6 Perspectives d'avenir\n2
  2. SECTION II : DÉLIMITATION, MÉTHODOLOGIE ET STRUCTURE DU MARCHÉ\n
    1. 2.1 INTRODUCTION AU MARCHÉ\n \n
      1. 2.1.1 Définition\n \n
      2. 2.1.2 Portée de l'étude\n \n \n
        1. 2.1.2.1 Objectif de la recherche\n \n \n
        2. 2.1.2.2 Hypothèse\n \n \n
        3. 2.1.2.3 Limitations\n
    2. 2.2 MÉTHODOLOGIE DE RECHERCHE\n \n
      1. 2.2.1 Vue d'ensemble\n \n
      2. 2.2.2 Exploration des données\n \n
      3. 2.2.3 Recherche secondaire\n \n
      4. 2.2.4 Recherche primaire\n \n \n
        1. 2.2.4.1 Interviews primaires et processus de collecte d'informations\n \n \n
        2. 2.2.4.2 Répartition des répondants principaux\n \n
      5. 2.2.5 Modèle de prévision\n \n
      6. 2.2.6 Estimation de la taille du marché\n \n \n
        1. 2.2.6.1 Approche ascendante\n \n \n
        2. 2.2.6.2 Approche descendante\n \n
      7. 2.2.7 Triangulation des données\n \n
      8. 2.2.8 Validation\n3
  3. SECTION III : ANALYSE QUALITATIVE\n
    1. 3.1 DYNAMIQUE DU MARCHÉ\n \n
      1. 3.1.1 Vue d'ensemble\n \n
      2. 3.1.2 Facteurs moteurs\n \n
      3. 3.1.3 Contraintes\n \n
      4. 3.1.4 Opportunités\n
    2. 3.2 ANALYSE DES FACTEURS DU MARCHÉ\n \n
      1. 3.2.1 Analyse de la chaîne de valeur\n \n
      2. 3.2.2 Analyse des cinq forces de Porter\n \n \n
        1. 3.2.2.1 Pouvoir de négociation des fournisseurs\n \n \n
        2. 3.2.2.2 Pouvoir de négociation des acheteurs\n \n \n
        3. 3.2.2.3 Menace des nouveaux entrants\n \n \n
        4. 3.2.2.4 Menace des substituts\n \n \n
        5. 3.2.2.5 Intensité de la rivalité\n \n
      3. 3.2.3 Analyse de l'impact du COVID-19\n \n \n
        1. 3.2.3.1 Analyse de l'impact sur le marché\n \n \n
        2. 3.2.3.2 Impact régional\n \n \n
        3. 3.2.3.3 Analyse des opportunités et des menaces\n4
  4. SECTION IV : ANALYSE QUANTITATIVE\n
    1. 4.1 Semi-conducteurs et électronique, PAR Type (milliards USD)\n \n
      1. 4.1.1 Géré\n \n
      2. 4.1.2 Non géré\n
    2. 4.2 Semi-conducteurs et électronique, PAR Domaines d'application (milliards USD)\n \n
      1. 4.2.1 Réseau intelligent\n \n
      2. 4.2.2 Sécurité et surveillance\n
    3. 4.3 Semi-conducteurs et électronique, PAR Taille d'organisation (milliards USD)\n \n
      1. 4.3.1 PME\n \n
      2. 4.3.2 Grande entreprise\n
    4. 4.4 Semi-conducteurs et électronique, PAR Utilisateur final (milliards USD)\n \n
      1. 4.4.1 Aérospatiale et défense\n \n
      2. 4.4.2 Pétrole et gaz\n
    5. 4.5 Semi-conducteurs et électronique, PAR Région (milliards USD)\n \n
      1. 4.5.1 Amérique du Nord\n \n \n
        1. 4.5.1.1 États-Unis\n \n \n
        2. 4.5.1.2 Canada\n \n
      2. 4.5.2 Europe\n \n \n
        1. 4.5.2.1 Allemagne\n \n \n
        2. 4.5.2.2 Royaume-Uni\n \n \n
        3. 4.5.2.3 France\n \n \n
        4. 4.5.2.4 Russie\n \n \n
        5. 4.5.2.5 Italie\n \n \n
        6. 4.5.2.6 Espagne\n \n \n
        7. 4.5.2.7 Reste de l'Europe\n \n
      3. 4.5.3 APAC\n \n \n
        1. 4.5.3.1 Chine\n \n \n
        2. 4.5.3.2 Inde\n \n \n
        3. 4.5.3.3 Japon\n \n \n
        4. 4.5.3.4 Corée du Sud\n \n \n
        5. 4.5.3.5 Malaisie\n \n \n
        6. 4.5.3.6 Thaïlande\n \n \n
        7. 4.5.3.7 Indonésie\n \n \n
        8. 4.5.3.8 Reste de l'APAC\n \n
      4. 4.5.4 Amérique du Sud\n \n \n
        1. 4.5.4.1 Brésil\n \n \n
        2. 4.5.4.2 Mexique\n \n \n
        3. 4.5.4.3 Argentine\n \n \n
        4. 4.5.4.4 Reste de l'Amérique du Sud\n \n
      5. 4.5.5 MEA\n \n \n
        1. 4.5.5.1 Pays du CCG\n \n \n
        2. 4.5.5.2 Afrique du Sud\n \n \n
        3. 4.5.5.3 Reste de la MEA\n5
  5. SECTION V : ANALYSE CONCURRENTIELLE\n
    1. 5.1 Paysage concurrentiel\n \n
      1. 5.1.1 Vue d'ensemble\n \n
      2. 5.1.2 Analyse concurrentielle\n \n
      3. 5.1.3 Analyse de la part de marché\n \n
      4. 5.1.4 Stratégie de croissance majeure dans les semi-conducteurs et l'électronique\n \n
      5. 5.1.5 Évaluation comparative\n \n
      6. 5.1.6 Acteurs principaux en termes de nombre de développements dans les semi-conducteurs et l'électronique\n \n
      7. 5.1.7 Développements clés et stratégies de croissance\n \n \n
        1. 5.1.7.1 Lancement de nouveaux produits/Déploiement de services\n \n \n
        2. 5.1.7.2 Fusions et acquisitions\n \n \n
        3. 5.1.7.3 Coentreprises\n \n
      8. 5.1.8 Matrice financière des principaux acteurs\n \n \n
        1. 5.1.8.1 Ventes et revenu d'exploitation\n \n \n
        2. 5.1.8.2 Dépenses de R&D des principaux acteurs. 2023\n
    2. 5.2 Profils d'entreprise\n \n
      1. 5.2.1 Cisco Systems (US)\n \n \n
        1. 5.2.1.1 Vue d'ensemble financière\n \n \n
        2. 5.2.1.2 Produits offerts\n \n \n
        3. 5.2.1.3 Développements clés\n \n \n
        4. 5.2.1.4 Analyse SWOT\n \n \n
        5. 5.2.1.5 Stratégies clés\n \n
      2. 5.2.2 Siemens (DE)\n \n \n
        1. 5.2.2.1 Vue d'ensemble financière\n \n \n
        2. 5.2.2.2 Produits offerts\n \n \n
        3. 5.2.2.3 Développements clés\n \n \n
        4. 5.2.2.4 Analyse SWOT\n \n \n
        5. 5.2.2.5 Stratégies clés\n \n
      3. 5.2.3 Rockwell Automation (US)\n \n \n
        1. 5.2.3.1 Vue d'ensemble financière\n \n \n
        2. 5.2.3.2 Produits offerts\n \n \n
        3. 5.2.3.3 Développements clés\n \n \n
        4. 5.2.3.4 Analyse SWOT\n \n \n
        5. 5.2.3.5 Stratégies clés\n \n
      4. 5.2.4 Moxa (TW)\n \n \n
        1. 5.2.4.1 Vue d'ensemble financière\n \n \n
        2. 5.2.4.2 Produits offerts\n \n \n
        3. 5.2.4.3 Développements clés\n \n \n
        4. 5.2.4.4 Analyse SWOT\n \n \n
        5. 5.2.4.5 Stratégies clés\n \n
      5. 5.2.5 Hirschmann (DE)\n \n \n
        1. 5.2.5.1 Vue d'ensemble financière\n \n \n
        2. 5.2.5.2 Produits offerts\n \n \n
        3. 5.2.5.3 Développements clés\n \n \n
        4. 5.2.5.4 Analyse SWOT\n \n \n
        5. 5.2.5.5 Stratégies clés\n \n
      6. 5.2.6 Belden (US)\n \n \n
        1. 5.2.6.1 Vue d'ensemble financière\n \n \n
        2. 5.2.6.2 Produits offerts\n \n \n
        3. 5.2.6.3 Développements clés\n \n \n
        4. 5.2.6.4 Analyse SWOT\n \n \n
        5. 5.2.6.5 Stratégies clés\n \n
      7. 5.2.7 Advantech (TW)\n \n \n
        1. 5.2.7.1 Vue d'ensemble financière\n \n \n
        2. 5.2.7.2 Produits offerts\n \n \n
        3. 5.2.7.3 Développements clés\n \n \n
        4. 5.2.7.4 Analyse SWOT\n \n \n
        5. 5.2.7.5 Stratégies clés\n \n
      8. 5.2.8 Phoenix Contact (DE)\n \n \n
        1. 5.2.8.1 Vue d'ensemble financière\n \n \n
        2. 5.2.8.2 Produits offerts\n \n \n
        3. 5.2.8.3 Développements clés\n \n \n
        4. 5.2.8.4 Analyse SWOT\n \n \n
        5. 5.2.8.5 Stratégies clés\n \n
      9. 5.2.9 Schneider Electric (FR)\n \n \n
        1. 5.2.9.1 Vue d'ensemble financière\n \n \n
        2. 5.2.9.2 Produits offerts\n \n \n
        3. 5.2.9.3 Développements clés\n \n \n
        4. 5.2.9.4 Analyse SWOT\n \n \n
        5. 5.2.9.5 Stratégies clés\n \n
      10. 5.2.10 Nexans (FR)\n \n \n
        1. 5.2.10.1 Vue d'ensemble financière\n \n \n
        2. 5.2.10.2 Produits offerts\n \n \n
        3. 5.2.10.3 Développements clés\n \n \n
        4. 5.2.10.4 Analyse SWOT\n \n \n
        5. 5.2.10.5 Stratégies clés\n
    3. 5.3 Annexe\n \n
      1. 5.3.1 Références\n \n
      2. 5.3.2 Rapports connexes\n6 LISTE DES FIGURES\n
    4. 6.1 SYNOPSIS DU MARCHÉ\n
    5. 6.2 ANALYSE DU MARCHÉ EN AMÉRIQUE DU NORD\n
    6. 6.3 ANALYSE DU MARCHÉ AUX ÉTATS-UNIS PAR TYPE\n
    7. 6.4 ANALYSE DU MARCHÉ AUX ÉTATS-UNIS PAR DOMAINES D'APPLICATION\n
    8. 6.5 ANALYSE DU MARCHÉ AUX ÉTATS-UNIS PAR TAILLE D'ORGANISATION\n
    9. 6.6 ANALYSE DU MARCHÉ AUX ÉTATS-UNIS PAR UTILISATEUR FINAL\n
    10. 6.7 ANALYSE DU MARCHÉ AU CANADA PAR TYPE\n
    11. 6.8 ANALYSE DU MARCHÉ AU CANADA PAR DOMAINES D'APPLICATION\n
    12. 6.9 ANALYSE DU MARCHÉ AU CANADA PAR TAILLE D'ORGANISATION\n
    13. 6.10 ANALYSE DU MARCHÉ AU CANADA PAR UTILISATEUR FINAL\n
    14. 6.11 ANALYSE DU MARCHÉ EN EUROPE\n
    15. 6.12 ANALYSE DU MARCHÉ EN ALLEMAGNE PAR TYPE\n
    16. 6.13 ANALYSE DU MARCHÉ EN ALLEMAGNE PAR DOMAINES D'APPLICATION\n
    17. 6.14 ANALYSE DU MARCHÉ EN ALLEMAGNE PAR TAILLE D'ORGANISATION\n
    18. 6.15 ANALYSE DU MARCHÉ EN ALLEMAGNE PAR UTILISATEUR FINAL\n
    19. 6.16 ANALYSE DU MARCHÉ AU ROYAUME-UNI PAR TYPE\n
    20. 6.17 ANALYSE DU MARCHÉ AU ROYAUME-UNI PAR DOMAINES D'APPLICATION\n
    21. 6.18 ANALYSE DU MARCHÉ AU ROYAUME-UNI PAR TAILLE D'ORGANISATION\n
    22. 6.19 ANALYSE DU MARCHÉ AU ROYAUME-UNI PAR UTILISATEUR FINAL\n
    23. 6.20 ANALYSE DU MARCHÉ EN FRANCE PAR TYPE\n
    24. 6.21 ANALYSE DU MARCHÉ EN FRANCE PAR DOMAINES D'APPLICATION\n
    25. 6.22 ANALYSE DU MARCHÉ EN FRANCE PAR TAILLE D'ORGANISATION\n
    26. 6.23 ANALYSE DU MARCHÉ EN FRANCE PAR UTILISATEUR FINAL\n
    27. 6.24 ANALYSE DU MARCHÉ EN RUSSIE PAR TYPE\n
    28. 6.25 ANALYSE DU MARCHÉ EN RUSSIE PAR DOMAINES D'APPLICATION\n
    29. 6.26 ANALYSE DU MARCHÉ EN RUSSIE PAR TAILLE D'ORGANISATION\n
    30. 6.27 ANALYSE DU MARCHÉ EN RUSSIE PAR UTILISATEUR FINAL\n
    31. 6.28 ANALYSE DU MARCHÉ EN ITALIE PAR TYPE\n
    32. 6.29 ANALYSE DU MARCHÉ EN ITALIE PAR DOMAINES D'APPLICATION\n
    33. 6.30 ANALYSE DU MARCHÉ EN ITALIE PAR TAILLE D'ORGANISATION\n
    34. 6.31 ANALYSE DU MARCHÉ EN ITALIE PAR UTILISATEUR FINAL\n
    35. 6.32 ANALYSE DU MARCHÉ EN ESPAGNE PAR TYPE\n
    36. 6.33 ANALYSE DU MARCHÉ EN ESPAGNE PAR DOMAINES D'APPLICATION\n
    37. 6.34 ANALYSE DU MARCHÉ EN ESPAGNE PAR TAILLE D'ORGANISATION\n
    38. 6.35 ANALYSE DU MARCHÉ EN ESPAGNE PAR UTILISATEUR FINAL\n
    39. 6.36 ANALYSE DU MARCHÉ DANS LE RESTE DE L'EUROPE PAR TYPE\n
    40. 6.37 ANALYSE DU MARCHÉ DANS LE RESTE DE L'EUROPE PAR DOMAINES D'APPLICATION\n
    41. 6.38 ANALYSE DU MARCHÉ DANS LE RESTE DE L'EUROPE PAR TAILLE D'ORGANISATION\n
    42. 6.39 ANALYSE DU MARCHÉ DANS LE RESTE DE L'EUROPE PAR UTILISATEUR FINAL\n
    43. 6.40 ANALYSE DU MARCHÉ EN APAC\n
    44. 6.41 ANALYSE DU MARCHÉ EN CHINE PAR TYPE\n
    45. 6.42 ANALYSE DU MARCHÉ EN CHINE PAR DOMAINES D'APPLICATION\n
    46. 6.43 ANALYSE DU MARCHÉ EN CHINE PAR TAILLE D'ORGANISATION\n
    47. 6.44 ANALYSE DU MARCHÉ EN CHINE PAR UTILISATEUR FINAL\n
    48. 6.45 ANALYSE DU MARCHÉ EN INDE PAR TYPE\n
    49. 6.46 ANALYSE DU MARCHÉ EN INDE PAR DOMAINES D'APPLICATION\n
    50. 6.47 ANALYSE DU MARCHÉ EN INDE PAR TAILLE D'ORGANISATION\n
    51. 6.48 ANALYSE DU MARCHÉ EN INDE PAR UTILISATEUR FINAL\n
    52. 6.49 ANALYSE DU MARCHÉ AU JAPON PAR TYPE\n
    53. 6.50 ANALYSE DU MARCHÉ AU JAPON PAR DOMAINES D'APPLICATION\n
    54. 6.51 ANALYSE DU MARCHÉ AU JAPON PAR TAILLE D'ORGANISATION\n
    55. 6.52 ANALYSE DU MARCHÉ AU JAPON PAR UTILISATEUR FINAL\n
    56. 6.53 ANALYSE DU MARCHÉ EN CORÉE DU SUD PAR TYPE\n
    57. 6.54 ANALYSE DU MARCHÉ EN CORÉE DU SUD PAR DOMAINES D'APPLICATION\n
    58. 6.55 ANALYSE DU MARCHÉ EN CORÉE DU SUD PAR TAILLE D'ORGANISATION\n
    59. 6.56 ANALYSE DU MARCHÉ EN CORÉE DU SUD PAR UTILISATEUR FINAL\n
    60. 6.57 ANALYSE DU MARCHÉ EN MALAYSIE PAR TYPE\n
    61. 6.58 ANALYSE DU MARCHÉ EN MALAYSIE PAR DOMAINES D'APPLICATION\n
    62. 6.59 ANALYSE DU MARCHÉ EN MALAYSIE PAR TAILLE D'ORGANISATION\n
    63. 6.60 ANALYSE DU MARCHÉ EN MALAYSIE PAR UTILISATEUR FINAL\n
    64. 6.61 ANALYSE DU MARCHÉ EN THAÏLANDE PAR TYPE\n
    65. 6.62 ANALYSE DU MARCHÉ EN THAÏLANDE PAR DOMAINES D'APPLICATION\n
    66. 6.63 ANALYSE DU MARCHÉ EN THAÏLANDE PAR TAILLE D'ORGANISATION\n
    67. 6.64 ANALYSE DU MARCHÉ EN THAÏLANDE PAR UTILISATEUR FINAL\n
    68. 6.65 ANALYSE DU MARCHÉ EN INDONÉSIE PAR TYPE\n
    69. 6.66 ANALYSE DU MARCHÉ EN INDONÉSIE PAR DOMAINES D'APPLICATION\n
    70. 6.67 ANALYSE DU MARCHÉ EN INDONÉSIE PAR TAILLE D'ORGANISATION\n
    71. 6.68 ANALYSE DU MARCHÉ EN INDONÉSIE PAR UTILISATEUR FINAL\n
    72. 6.69 ANALYSE DU MARCHÉ DANS LE RESTE DE L'APAC PAR TYPE\n
    73. 6.70 ANALYSE DU MARCHÉ DANS LE RESTE DE L'APAC PAR DOMAINES D'APPLICATION\n
    74. 6.71 ANALYSE DU MARCHÉ DANS LE RESTE DE L'APAC PAR TAILLE D'ORGANISATION\n
    75. 6.72 ANALYSE DU MARCHÉ DANS LE RESTE DE L'APAC PAR UTILISATEUR FINAL\n
    76. 6.73 ANALYSE DU MARCHÉ EN AMÉRIQUE DU SUD\n
    77. 6.74 ANALYSE DU MARCHÉ AU BRÉSIL PAR TYPE\n
    78. 6.75 ANALYSE DU MARCHÉ AU BRÉSIL PAR DOMAINES D'APPLICATION\n
    79. 6.76 ANALYSE DU MARCHÉ AU BRÉSIL PAR TAILLE D'ORGANISATION\n
    80. 6.77 ANALYSE DU MARCHÉ AU BRÉSIL PAR UTILISATEUR FINAL\n
    81. 6.78 ANALYSE DU MARCHÉ AU MEXIQUE PAR TYPE\n
    82. 6.79 ANALYSE DU MARCHÉ AU MEXIQUE PAR DOMAINES D'APPLICATION\n
    83. 6.80 ANALYSE DU MARCHÉ AU MEXIQUE PAR TAILLE D'ORGANISATION\n
    84. 6.81 ANALYSE DU MARCHÉ AU MEXIQUE PAR UTILISATEUR FINAL\n
    85. 6.82 ANALYSE DU MARCHÉ EN ARGENTINE PAR TYPE\n
    86. 6.83 ANALYSE DU MARCHÉ EN ARGENTINE PAR DOMAINES D'APPLICATION\n
    87. 6.84 ANALYSE DU MARCHÉ EN ARGENTINE PAR TAILLE D'ORGANISATION\n
    88. 6.85 ANALYSE DU MARCHÉ EN ARGENTINE PAR UTILISATEUR FINAL\n
    89. 6.86 ANALYSE DU MARCHÉ DANS LE RESTE DE L'AMÉRIQUE DU SUD PAR TYPE\n
    90. 6.87 ANALYSE DU MARCHÉ DANS LE RESTE DE L'AMÉRIQUE DU SUD PAR DOMAINES D'APPLICATION\n
    91. 6.88 ANALYSE DU MARCHÉ DANS LE RESTE DE L'AMÉRIQUE DU SUD PAR TAILLE D'ORGANISATION\n
    92. 6.89 ANALYSE DU MARCHÉ DANS LE RESTE DE L'AMÉRIQUE DU SUD PAR UTILISATEUR FINAL\n
    93. 6.90 ANALYSE DU MARCHÉ EN MEA\n
    94. 6.91 ANALYSE DU MARCHÉ DANS LES PAYS DU CCG PAR TYPE\n
    95. 6.92 ANALYSE DU MARCHÉ DANS LES PAYS DU CCG PAR DOMAINES D'APPLICATION\n
    96. 6.93 ANALYSE DU MARCHÉ DANS LES PAYS DU CCG PAR TAILLE D'ORGANISATION\n
    97. 6.94 ANALYSE DU MARCHÉ DANS LES PAYS DU CCG PAR UTILISATEUR FINAL\n
    98. 6.95 ANALYSE DU MARCHÉ EN AFRIQUE DU SUD PAR TYPE\n
    99. 6.96 ANALYSE DU MARCHÉ EN AFRIQUE DU SUD PAR DOMAINES D'APPLICATION\n
    100. 6.97 ANALYSE DU MARCHÉ EN AFRIQUE DU SUD PAR TAILLE D'ORGANISATION\n
    101. 6.98 ANALYSE DU MARCHÉ EN AFRIQUE DU SUD PAR UTILISATEUR FINAL\n
    102. 6.99 ANALYSE DU MARCHÉ DANS LE RESTE DE LA MEA PAR TYPE\n
    103. 6.100 ANALYSE DU MARCHÉ DANS LE RESTE DE LA MEA PAR DOMAINES D'APPLICATION\n
    104. 6.101 ANALYSE DU MARCHÉ DANS LE RESTE DE LA MEA PAR TAILLE D'ORGANISATION\n
    105. 6.102 ANALYSE DU MARCHÉ DANS LE RESTE DE LA MEA PAR UTILISATEUR FINAL\n
    106. 6.103 CRITÈRES D'ACHAT CLÉS DES SEMI-CONDUCTEURS ET ÉLECTRONIQUE\n
    107. 6.104 PROCESSUS DE RECHERCHE DE MRFR\n
    108. 6.105 ANALYSE DRO DES SEMI-CONDUCTEURS ET ÉLECTRONIQUE\n
    109. 6.106 ANALYSE D'IMPACT DES FACTEURS MOTRICES : SEMI-CONDUCTEURS ET ÉLECTRONIQUE\n
    110. 6.107 ANALYSE D'IMPACT DES CONTRAINTES : SEMI-CONDUCTEURS ET ÉLECTRONIQUE\n
    111. 6.108 CHAÎNE D'APPROVISIONNEMENT / CHAÎNE DE VALEUR : SEMI-CONDUCTEURS ET ÉLECTRONIQUE\n
    112. 6.109 SEMI-CONDUCTEURS ET ÉLECTRONIQUE, PAR TYPE, 2024 (% PART)\n \n
    113. 6.110 SEMI-CONDUCTEURS ET ÉLECTRONIQUE, PAR TYPE, 2024 À 2035 (milliards USD)\n \n
    114. 6.111 SEMI-CONDUCTEURS ET ÉLECTRONIQUE, PAR DOMAINES D'APPLICATION, 2024 (% PART)\n \n
    115. 6.112 SEMI-CONDUCTEURS ET ÉLECTRONIQUE, PAR DOMAINES D'APPLICATION, 2024 À 2035 (milliards USD)\n \n
    116. 6.113 SEMI-CONDUCTEURS ET ÉLECTRONIQUE, PAR TAILLE D'ORGANISATION, 2024 (% PART)\n \n
    117. 6.114 SEMI-CONDUCTEURS ET ÉLECTRONIQUE, PAR TAILLE D'ORGANISATION, 2024 À 2035 (milliards USD)\n \n
    118. 6.115 SEMI-CONDUCTEURS ET ÉLECTRONIQUE, PAR UTILISATEUR FINAL, 2024 (% PART)\n \n
    119. 6.116 SEMI-CONDUCTEURS ET ÉLECTRONIQUE, PAR UTILISATEUR FINAL, 2024 À 2035 (milliards USD)\n \n
    120. 6.117 ÉVALUATION COMPARATIVE DES PRINCIPAUX CONCURRENTS\n7 LISTE DES TABLEAUX\n \n
    121. 7.1 LISTE DES HYPOTHÈSES\n \n
      1. 7.1.1 \n \n
    122. 7.2 ESTIMATIONS DE TAILLE DU MARCHÉ EN AMÉRIQUE DU NORD ; PRÉVISIONS\n \n
      1. 7.2.1 PAR TYPE, 2025-2035 (milliards USD)\n \n
      2. 7.2.2 PAR DOMAINES D'APPLICATION, 2025-2035 (milliards USD)\n \n
      3. 7.2.3 PAR TAILLE D'ORGANISATION, 2025-2035 (milliards USD)\n \n
      4. 7.2.4 PAR UTILISATEUR FINAL, 2025-2035 (milliards USD)\n \n
    123. 7.3 ESTIMATIONS DE TAILLE DU MARCHÉ AUX ÉTATS-UNIS ; PRÉVISIONS\n \n
      1. 7.3.1 PAR TYPE, 2025-2035 (milliards USD)\n \n
      2. 7.3.2 PAR DOMAINES D'APPLICATION, 2025-2035 (milliards USD)\n \n
      3. 7.3.3 PAR TAILLE D'ORGANISATION, 2025-2035 (milliards USD)\n \n
      4. 7.3.4 PAR UTILISATEUR FINAL, 2025-2035 (milliards USD)\n \n
    124. 7.4 ESTIMATIONS DE TAILLE DU MARCHÉ AU CANADA ; PRÉVISIONS\n \n
      1. 7.4.1 PAR TYPE, 2025-2035 (milliards USD)\n \n
      2. 7.4.2 PAR DOMAINES D'APPLICATION, 2025-2035 (milliards USD)\n \n
      3. 7.4.3 PAR TAILLE D'ORGANISATION, 2025-2035 (milliards USD)\n \n
      4. 7.4.4 PAR UTILISATEUR FINAL, 2025-2035 (milliards USD)\n \n
    125. 7.5 ESTIMATIONS DE TAILLE DU MARCHÉ EN EUROPE ; PRÉVISIONS\n \n
      1. 7.5.1 PAR TYPE, 2025-2035 (milliards USD)\n \n
      2. 7.5.2 PAR DOMAINES D'APPLICATION, 2025-2035 (milliards USD)\n \n
      3. 7.5.3 PAR TAILLE D'ORGANISATION, 2025-2035 (milliards USD)\n \n
      4. 7.5.4 PAR UTILISATEUR FINAL, 2025-2035 (milliards USD)\n \n
    126. 7.6 ESTIMATIONS DE TAILLE DU MARCHÉ EN ALLEMAGNE ; PRÉVISIONS\n \n
      1. 7.6.1 PAR TYPE, 2025-2035 (milliards USD)\n \n
      2. 7.6.2 PAR DOMAINES D'APPLICATION, 2025-2035 (milliards USD)\n \n
      3. 7.6.3 PAR TAILLE D'ORGANISATION, 2025-2035 (milliards USD)\n \n
      4. 7.6.4 PAR UTILISATEUR FINAL, 2025-2035 (milliards USD)\n \n
    127. 7.7 ESTIMATIONS DE TAILLE DU MARCHÉ AU ROYAUME-UNI ; PRÉVISIONS\n \n
      1. 7.7.1 PAR TYPE, 2025-2035 (milliards USD)\n \n
      2. 7.7.2 PAR DOMAINES D'APPLICATION, 2025-2035 (milliards USD)\n \n
      3. 7.7.3 PAR TAILLE D'ORGANISATION, 2025-2035 (milliards USD)\n \n
      4. 7.7.4 PAR UTILISATEUR FINAL, 2025-2035 (milliards USD)\n \n
    128. 7.8 ESTIMATIONS DE TAILLE DU MARCHÉ EN FRANCE ; PRÉVISIONS\n \n
      1. 7.8.1 PAR TYPE, 2025-2035 (milliards USD)\n \n
      2. 7.8.2 PAR DOMAINES D'APPLICATION, 2025-2035 (milliards USD)\n \n
      3. 7.8.3 PAR TAILLE D'ORGANISATION, 2025-2035 (milliards USD)\n \n
      4. 7.8.4 PAR UTILISATEUR FINAL, 2025-2035 (milliards USD)\n \n
    129. 7.9 ESTIMATIONS DE TAILLE DU MARCHÉ EN RUSSIE ; PRÉVISIONS\n \n
      1. 7.9.1 PAR TYPE, 2025-2035 (milliards USD)\n \n
      2. 7.9.2 PAR DOMAINES D'APPLICATION, 2025-2035 (milliards USD)\n \n
      3. 7.9.3 PAR TAILLE D'ORGANISATION, 2025-2035 (milliards USD)\n \n
      4. 7.9.4 PAR UTILISATEUR FINAL, 2025-2035 (milliards USD)\n \n
    130. 7.10 ESTIMATIONS DE TAILLE DU MARCHÉ EN ITALIE ; PRÉVISIONS\n \n
      1. 7.10.1 PAR TYPE, 2025-2035 (milliards USD)\n \n
      2. 7.10.2 PAR DOMAINES D'APPLICATION, 2025-2035 (milliards USD)\n \n
      3. 7.10.3 PAR TAILLE D'ORGANISATION, 2025-2035 (milliards USD)\n \n
      4. 7.10.4 PAR UTILISATEUR FINAL, 2025-2035 (milliards USD)\n \n
    131. 7.11 ESTIMATIONS DE TAILLE DU MARCHÉ EN ESPAGNE ; PRÉVISIONS\n \n
      1. 7.11.1 PAR TYPE, 2025-2035 (milliards USD)\n \n
      2. 7.11.2 PAR DOMAINES D'APPLICATION, 2025-2035 (milliards USD)\n \n
      3. 7.11.3 PAR TAILLE D'ORGANISATION, 2025-2035 (milliards USD)\n \n
      4. 7.11.4 PAR UTILISATEUR FINAL, 2025-2035 (milliards USD)\n \n
    132. 7.12 ESTIMATIONS DE TAILLE DU MARCHÉ DANS LE RESTE DE L'EUROPE ; PRÉVISIONS\n \n
      1. 7.12.1 PAR TYPE, 2025-2035 (milliards USD)\n \n
      2. 7.12.2 PAR DOMAINES D'APPLICATION, 2025-2035 (milliards USD)\n \n
      3. 7.12.3 PAR TAILLE D'ORGANISATION, 2025-2035 (milliards USD)\n \n
      4. 7.12.4 PAR UTILISATEUR FINAL, 2025-2035 (milliards USD)\n \n
    133. 7.13 ESTIMATIONS DE TAILLE DU MARCHÉ EN APAC ; PRÉVISIONS\n \n
      1. 7.13.1 PAR TYPE, 2025-2035 (milliards USD)\n \n
      2. 7.13.2 PAR DOMAINES D'APPLICATION, 2025-2035 (milliards USD)\n \n
      3. 7.13.3 PAR TAILLE D'ORGANISATION, 2025-2035 (milliards USD)\n \n
      4. 7.13.4 PAR UTILISATEUR FINAL, 2025-2035 (milliards USD)\n \n
    134. 7.14 ESTIMATIONS DE TAILLE DU MARCHÉ EN CHINE ; PRÉVISIONS\n \n
      1. 7.14.1 PAR TYPE, 2025-2035 (milliards USD)\n \n
      2. 7.14.2 PAR DOMAINES D'APPLICATION, 2025-2035 (milliards USD)\n \n
      3. 7.14.3 PAR TAILLE D'ORGANISATION, 2025-2035 (milliards USD)\n \n
      4. 7.14.4 PAR UTILISATEUR FINAL, 2025-2035 (milliards USD)\n \n
    135. 7.15 ESTIMATIONS DE TAILLE DU MARCHÉ EN INDE ; PRÉVISIONS\n \n
      1. 7.15.1 PAR TYPE, 2025-2035 (milliards USD)\n \n
      2. 7.15.2 PAR DOMAINES D'APPLICATION, 2025-2035 (milliards USD)\n \n
      3. 7.15.3 PAR TAILLE D'ORGANISATION, 2025-2035 (milliards USD)\n \n
      4. 7.15.4 PAR UTILISATEUR FINAL, 2025-2035 (milliards USD)\n \n
    136. 7.16 ESTIMATIONS DE TAILLE DU MARCHÉ AU JAPON ; PRÉVISIONS\n \n
      1. 7.16.1 PAR TYPE, 2025-2035 (milliards USD)\n \n
      2. 7.16.2 PAR DOMAINES D'APPLICATION, 2025-2035 (milliards USD)\n \n
      3. 7.16.3 PAR TAILLE D'ORGANISATION, 2025-2035 (milliards USD)\n \n
      4. 7.16.4 PAR UTILISATEUR FINAL, 2025-2035 (milliards USD)\n \n
    137. 7.17 ESTIMATIONS DE TAILLE DU MARCHÉ EN CORÉE DU SUD ; PRÉVISIONS\n \n
      1. 7.17.1 PAR TYPE, 2025-2035 (milliards USD)\n \n
      2. 7.17.2 PAR DOMAINES D'APPLICATION, 2025-2035 (milliards USD)\n \n
      3. 7.17.3 PAR TAILLE D'ORGANISATION, 2025-2035 (milliards USD)\n \n
      4. 7.17.4 PAR UTILISATEUR FINAL, 2025-2035 (milliards USD)\n \n
    138. 7.18 ESTIMATIONS DE TAILLE DU MARCHÉ EN MALAYSIE ; PRÉVISIONS\n \n
      1. 7.18.1 PAR TYPE, 2025-2035 (milliards USD)\n \n
      2. 7.18.2 PAR DOMAINES D'APPLICATION, 2025-2035 (milliards USD)\n \n
      3. 7.18.3 PAR TAILLE D'ORGANISATION, 2025-2035 (milliards USD)\n \n
      4. 7.18.4 PAR UTILISATEUR FINAL, 2025-2035 (milliards USD)\n \n
    139. 7.19 ESTIMATIONS DE TAILLE DU MARCHÉ EN THAÏLANDE ; PRÉVISIONS\n \n
      1. 7.19.1 PAR TYPE, 2025-2035 (milliards USD)\n \n
      2. 7.19.2 PAR DOMAINES D'APPLICATION, 2025-2035 (milliards USD)\n \n
      3. 7.19.3 PAR TAILLE D'ORGANISATION, 2025-2035 (milliards USD)\n \n
      4. 7.19.4 PAR UTILISATEUR FINAL, 2025-2035 (milliards USD)\n \n
    140. 7.20 ESTIMATIONS DE TAILLE DU MARCHÉ EN INDONÉSIE ; PRÉVISIONS\n \n
      1. 7.20.1 PAR TYPE, 2025-2035 (milliards USD)\n \n
      2. 7.20.2 PAR DOMAINES D'APPLICATION, 2025-2035 (milliards USD)\n \n
      3. 7.20.3 PAR TAILLE D'ORGANISATION, 2025-2035 (milliards USD)\n \n
      4. 7.20.4 PAR UTILISATEUR FINAL, 2025-2035 (milliards USD)\n \n
    141. 7.21 ESTIMATIONS DE TAILLE DU MARCHÉ DANS LE RESTE DE L'APAC ; PRÉVISIONS\n \n
      1. 7.21.1 PAR TYPE, 2025-2035 (milliards USD)\n \n
      2. 7.21.2 PAR DOMAINES D'APPLICATION, 2025-2035 (milliards USD)\n \n
      3. 7.21.3 PAR TAILLE D'ORGANISATION, 2025-2035 (milliards USD)\n \n
      4. 7.21.4 PAR UTILISATEUR FINAL, 2025-2035 (milliards USD)\n \n
    142. 7.22 ESTIMATIONS DE TAILLE DU MARCHÉ EN AMÉRIQUE DU SUD ; PRÉVISIONS\n \n
      1. 7.22.1 PAR TYPE, 2025-2035 (milliards USD)\n \n
      2. 7.22.2 PAR DOMAINES D'APPLICATION, 2025-2035 (milliards USD)\n \n
      3. 7.22.3 PAR TAILLE D'ORGANISATION, 2025-2035 (milliards USD)\n \n
      4. 7.22.4 PAR UTILISATEUR FINAL, 2025-2035 (milliards USD)\n \n
    143. 7.23 ESTIMATIONS DE TAILLE DU MARCHÉ AU BRÉSIL ; PRÉVISIONS\n \n
      1. 7.23.1 PAR TYPE, 2025-2035 (milliards USD)\n \n
      2. 7.23.2 PAR DOMAINES D'APPLICATION, 2025-2035 (milliards USD)\n \n
      3. 7.23.3 PAR TAILLE D'ORGANISATION, 2025-2035 (milliards USD)\n \n
      4. 7.23.4 PAR UTILISATEUR FINAL, 2025-2035 (milliards USD)\n \n
    144. 7.24 ESTIMATIONS DE TAILLE DU MARCHÉ AU MEXIQUE ; PRÉVISIONS\n \n
      1. 7.24.1 PAR TYPE, 2025-2035 (milliards USD)\n \n
      2. 7.24.2 PAR DOMAINES D'APPLICATION, 2025-2035 (milliards USD)\n \n
      3. 7.24.3 PAR TAILLE D'ORGANISATION, 2025-2035 (milliards USD)\n \n
      4. 7.24.4 PAR UTILISATEUR FINAL, 2025-2035 (milliards USD)\n \n
    145. 7.25 ESTIMATIONS DE TAILLE DU MARCHÉ EN ARGENTINE ; PRÉVISIONS\n \n
      1. 7.25.1 PAR TYPE, 2025-2035 (milliards USD)\n \n
      2. 7.25.2 PAR DOMAINES D'APPLICATION, 2025-2035 (milliards USD)\n \n
      3. 7.25.3 PAR TAILLE D'ORGANISATION, 2025-2035 (milliards USD)\n \n
      4. 7.25.4 PAR UTILISATEUR FINAL, 2025-2035 (milliards USD)\n \n
    146. 7.26 ESTIMATIONS DE TAILLE DU MARCHÉ DANS LE RESTE DE L'AMÉRIQUE DU SUD ; PRÉVISIONS\n \n
      1. 7.26.1 PAR TYPE, 2025-2035 (milliards USD)\n \n
      2. 7.26.2 PAR DOMAINES D'APPLICATION, 2025-2035 (milliards USD)\n \n
      3. 7.26.3 PAR TAILLE D'ORGANISATION, 2025-2035 (milliards USD)\n \n
      4. 7.26.4 PAR UTILISATEUR FINAL, 2025-2035 (milliards USD)\n \n
    147. 7.27 ESTIMATIONS DE TAILLE DU MARCHÉ EN MEA ; PRÉVISIONS\n \n
      1. 7.27.1 PAR TYPE, 2025-2035 (milliards USD)\n \n
      2. 7.27.2 PAR DOMAINES D'APPLICATION, 2025-2035 (milliards USD)\n \n
      3. 7.27.3 PAR TAILLE D'ORGANISATION, 2025-2035 (milliards USD)\n \n
      4. 7.27.4 PAR UTILISATEUR FINAL, 2025-2035 (milliards USD)\n \n
    148. 7.28 ESTIMATIONS DE TAILLE DU MARCHÉ DANS LES PAYS DU CCG ; PRÉVISIONS\n \n
      1. 7.28.1 PAR TYPE, 2025-2035 (milliards USD)\n \n
      2. 7.28.2 PAR DOMAINES D'APPLICATION, 2025-2035 (milliards USD)\n \n
      3. 7.28.3 PAR TAILLE D'ORGANISATION, 2025-2035 (milliards USD)\n \n
      4. 7.28.4 PAR UTILISATEUR FINAL, 2025-2035 (milliards USD)\n \n
    149. 7.29 ESTIMATIONS DE TAILLE DU MARCHÉ EN AFRIQUE DU SUD ; PRÉVISIONS\n \n
      1. 7.29.1 PAR TYPE, 2025-2035 (milliards USD)\n \n
      2. 7.29.2 PAR DOMAINES D'APPLICATION, 2025-2035 (milliards USD)\n \n
      3. 7.29.3 PAR TAILLE D'ORGANISATION, 2025-2035 (milliards USD)\n \n
      4. 7.29.4 PAR UTILISATEUR FINAL, 2025-2035 (milliards USD)\n \n
    150. 7.30 ESTIMATIONS DE TAILLE DU MARCHÉ DANS LE RESTE DE LA MEA ; PRÉVISIONS\n \n
      1. 7.30.1 PAR TYPE, 2025-2035 (milliards USD)\n \n
      2. 7.30.2 PAR DOMAINES D'APPLICATION, 2025-2035 (milliards USD)\n \n
      3. 7.30.3 PAR TAILLE D'ORGANISATION, 2025-2035 (milliards USD)\n \n
      4. 7.30.4 PAR UTILISATEUR FINAL, 2025-2035 (milliards USD)\n \n
    151. 7.31 LANCEMENT DE PRODUIT/DÉVELOPPEMENT DE PRODUIT/APPROBATION\n \n
      1. 7.31.1 \n \n
    152. 7.32 ACQUISITION/PARTENARIAT\n \n

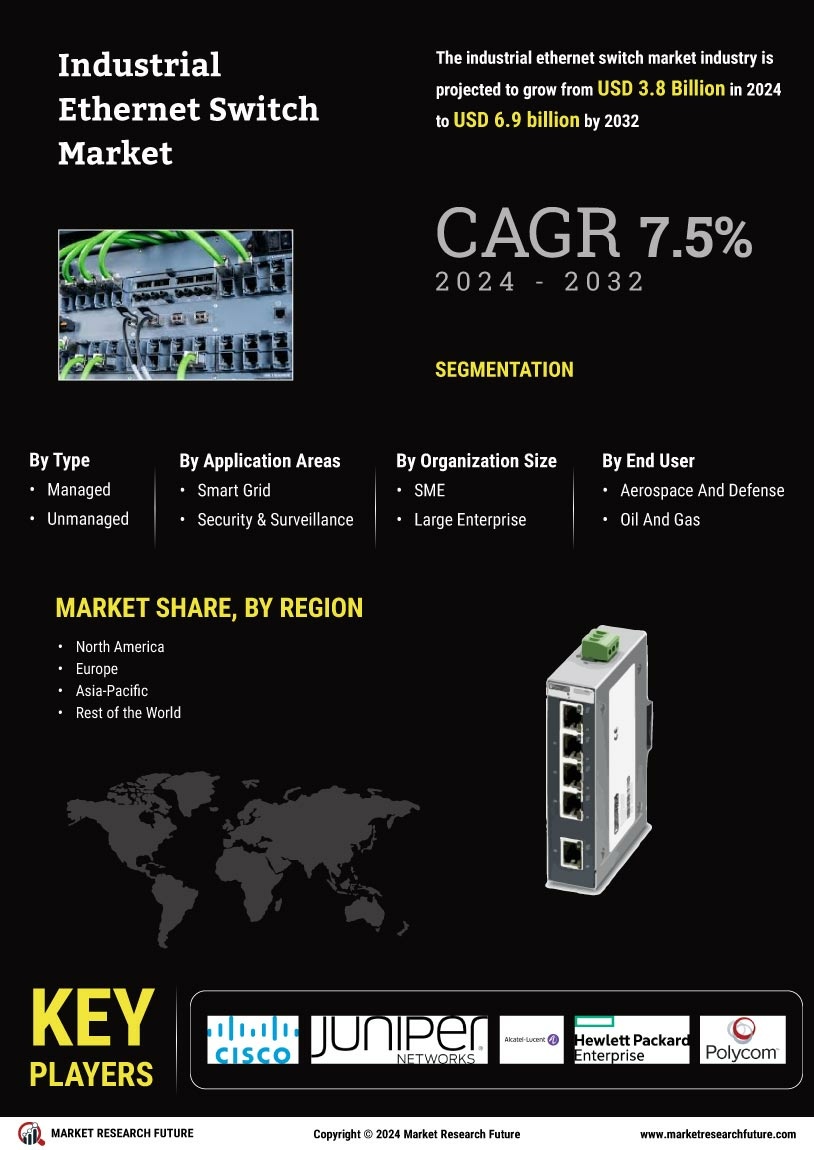
Segmentation du marché des commutateurs Ethernet industriels

Perspectives par type de commutateur Ethernet industriel (milliards USD, 2018-2032)

Géré

Non géré

Perspectives par domaines d'application des commutateurs Ethernet industriels (milliards USD, 2018-2032)

Réseau intelligent

Sécurité et surveillance

Perspectives par taille d'organisation des commutateurs Ethernet industriels (milliards USD, 2018-2032)

PME

Grande entreprise

Perspectives par utilisateur final des commutateurs Ethernet industriels (milliards USD, 2018-2032)

Aéronautique et défense

Pétrole et gaz

Perspectives régionales des commutateurs Ethernet industriels (milliards USD, 2018-2032)

Perspectives de l'Amérique du Nord (milliards USD, 2018-2032)

Commutateurs Ethernet industriels en Amérique du Nord par type

Géré

Non géré

Commutateurs Ethernet industriels en Amérique du Nord par domaines d'application

Réseau intelligent

Sécurité et surveillance

Commutateurs Ethernet industriels en Amérique du Nord par taille d'organisation

PME

Grande entreprise

Commutateurs Ethernet industriels en Amérique du Nord par utilisateur final

Aéronautique et défense

Pétrole et gaz

Perspectives des États-Unis (milliards USD, 2018-2032)

Commutateurs Ethernet industriels aux États-Unis par type

Géré

Non géré

Commutateurs Ethernet industriels aux États-Unis par domaines d'application

Réseau intelligent

Sécurité et surveillance

Commutateurs Ethernet industriels aux États-Unis par taille d'organisation

PME

Grande entreprise

Commutateurs Ethernet industriels aux États-Unis par utilisateur final

Aéronautique et défense

Pétrole et gaz

Perspectives du CANADA (milliards USD, 2018-2032)

Commutateurs Ethernet industriels au CANADA par type

Géré

Non géré

Commutateurs Ethernet industriels au CANADA par domaines d'application

Réseau intelligent

Sécurité et surveillance

Commutateurs Ethernet industriels au CANADA par taille d'organisation

PME

Grande entreprise

Commutateurs Ethernet industriels au CANADA par utilisateur final

Aéronautique et défense

Pétrole et gaz

Perspectives de l'Europe (milliards USD, 2018-2032)

Commutateurs Ethernet industriels en Europe par type

Géré

Non géré

Commutateurs Ethernet industriels en Europe par domaines d'application

Réseau intelligent

Sécurité et surveillance

Commutateurs Ethernet industriels en Europe par taille d'organisation

PME

Grande entreprise

Commutateurs Ethernet industriels en Europe par utilisateur final

Aéronautique et défense

Pétrole et gaz

Perspectives de l'Allemagne (milliards USD, 2018-2032)

Commutateurs Ethernet industriels en Allemagne par type

Géré

Non géré

Commutateurs Ethernet industriels en Allemagne par domaines d'application

Réseau intelligent

Sécurité et surveillance

Commutateurs Ethernet industriels en Allemagne par taille d'organisation

PME

Grande entreprise

Commutateurs Ethernet industriels en Allemagne par utilisateur final

Aéronautique et défense

Pétrole et gaz

Perspectives de la France (milliards USD, 2018-2032)

Commutateurs Ethernet industriels en France par type

Géré

Non géré

Commutateurs Ethernet industriels en France par domaines d'application

Réseau intelligent

Sécurité et surveillance

Commutateurs Ethernet industriels en France par taille d'organisation

PME

Grande entreprise

Commutateurs Ethernet industriels en France par utilisateur final

Aéronautique et défense

Pétrole et gaz

Perspectives du Royaume-Uni (milliards USD, 2018-2032)

Commutateurs Ethernet industriels au Royaume-Uni par type

Géré

Non géré

Commutateurs Ethernet industriels au Royaume-Uni par domaines d'application

Réseau intelligent

Sécurité et surveillance

Commutateurs Ethernet industriels au Royaume-Uni par taille d'organisation

PME

Grande entreprise

Commutateurs Ethernet industriels au Royaume-Uni par utilisateur final

Aéronautique et défense

Pétrole et gaz

Perspectives de l'ITALIE (milliards USD, 2018-2032)

Commutateurs Ethernet industriels en ITALIE par type

Géré

Non géré

Commutateurs Ethernet industriels en ITALIE par domaines d'application

Réseau intelligent

Sécurité et surveillance

Commutateurs Ethernet industriels en ITALIE par taille d'organisation

PME

Grande entreprise

Commutateurs Ethernet industriels en ITALIE par utilisateur final

Aéronautique et défense

Pétrole et gaz

Perspectives de l'Espagne (milliards USD, 2018-2032)

Commutateurs Ethernet industriels en Espagne par type

Géré

Non géré

Commutateurs Ethernet industriels en Espagne par domaines d'application

Réseau intelligent

Sécurité et surveillance

Commutateurs Ethernet industriels en Espagne par taille d'organisation

PME

Grande entreprise

Commutateurs Ethernet industriels en Espagne par utilisateur final

Aéronautique et défense

Pétrole et gaz

Perspectives du reste de l'Europe (milliards USD, 2018-2032)

Commutateurs Ethernet industriels dans le reste de l'Europe par type

Géré

Non géré

Commutateurs Ethernet industriels dans le reste de l'Europe par domaines d'application

Réseau intelligent

Sécurité et surveillance

Commutateurs Ethernet industriels dans le reste de l'Europe par taille d'organisation

PME

Grande entreprise

Commutateurs Ethernet industriels dans le reste de l'Europe par utilisateur final

Aéronautique et défense

Pétrole et gaz

Perspectives de la région Asie-Pacifique (milliards USD, 2018-2032)

Commutateurs Ethernet industriels en Asie-Pacifique par type

Géré

Non géré

Commutateurs Ethernet industriels en Asie-Pacifique par domaines d'application

Réseau intelligent

Sécurité et surveillance

Commutateurs Ethernet industriels en Asie-Pacifique par taille d'organisation

PME

Grande entreprise

Commutateurs Ethernet industriels en Asie-Pacifique par utilisateur final

Aéronautique et défense

Pétrole et gaz

Perspectives de la Chine (milliards USD, 2018-2032)

Commutateurs Ethernet industriels en Chine par type

Géré

Non géré

Commutateurs Ethernet industriels en Chine par domaines d'application

Réseau intelligent

Sécurité et surveillance

Commutateurs Ethernet industriels en Chine par taille d'organisation

PME

Grande entreprise

Commutateurs Ethernet industriels en Chine par utilisateur final

Aéronautique et défense

Pétrole et gaz

Perspectives du Japon (milliards USD, 2018-2032)

Commutateurs Ethernet industriels au Japon par type

Géré

Non géré

Commutateurs Ethernet industriels au Japon par domaines d'application

Réseau intelligent

Sécurité et surveillance

Commutateurs Ethernet industriels au Japon par taille d'organisation

PME

Grande entreprise

Commutateurs Ethernet industriels au Japon par utilisateur final

Aéronautique et défense

Pétrole et gaz

Perspectives de l'Inde (milliards USD, 2018-2032)

Commutateurs Ethernet industriels en Inde par type

Géré

Non géré

Commutateurs Ethernet industriels en Inde par domaines d'application

Réseau intelligent

Sécurité et surveillance

Commutateurs Ethernet industriels en Inde par taille d'organisation

PME

Grande entreprise

Commutateurs Ethernet industriels en Inde par utilisateur final

Aéronautique et défense

Pétrole et gaz

Perspectives de l'Australie (milliards USD, 2018-2032)

Commutateurs Ethernet industriels en Australie par type

Géré

Non géré

Commutateurs Ethernet industriels en Australie par domaines d'application

Réseau intelligent

Sécurité et surveillance

Commutateurs Ethernet industriels en Australie par taille d'organisation

PME

Grande entreprise

Commutateurs Ethernet industriels en Australie par utilisateur final

Aéronautique et défense

Pétrole et gaz

Perspectives du reste de la région Asie-Pacifique (milliards USD, 2018-2032)

Commutateurs Ethernet industriels dans le reste de la région Asie-Pacifique par type

Géré

Non géré

Commutateurs Ethernet industriels dans le reste de la région Asie-Pacifique par domaines d'application

Réseau intelligent

Sécurité et surveillance

Commutateurs Ethernet industriels dans le reste de la région Asie-Pacifique par taille d'organisation

PME

Grande entreprise

Commutateurs Ethernet industriels dans le reste de la région Asie-Pacifique par utilisateur final

Aéronautique et défense

Pétrole et gaz

Perspectives du reste du monde (milliards USD, 2018-2032)

Commutateurs Ethernet industriels dans le reste du monde par type

Géré

Non géré

Commutateurs Ethernet industriels dans le reste du monde par domaines d'application

Réseau intelligent

Sécurité et surveillance

Commutateurs Ethernet industriels dans le reste du monde par taille d'organisation

PME

Grande entreprise

Commutateurs Ethernet industriels dans le reste du monde par utilisateur final

Aéronautique et défense

Pétrole et gaz

Perspectives du Moyen-Orient (milliards USD, 2018-2032)

Commutateurs Ethernet industriels au Moyen-Orient par type

Géré

Non géré

Commutateurs Ethernet industriels au Moyen-Orient par domaines d'application

Réseau intelligent

Sécurité et surveillance

Commutateurs Ethernet industriels au Moyen-Orient par taille d'organisation

PME

Grande entreprise

Commutateurs Ethernet industriels au Moyen-Orient par utilisateur final

Aéronautique et défense

Pétrole et gaz

Perspectives de l'Afrique (milliards USD, 2018-2032)

Commutateurs Ethernet industriels en Afrique par type

Géré

Non géré

Commutateurs Ethernet industriels en Afrique par domaines d'application

Réseau intelligent

Sécurité et surveillance

Commutateurs Ethernet industriels en Afrique par taille d'organisation

PME

Grande entreprise

Commutateurs Ethernet industriels en Afrique par utilisateur final

Aéronautique et défense

Pétrole et gaz

Perspectives de l'Amérique latine (milliards USD, 2018-2032)

Commutateurs Ethernet industriels en Amérique latine par type

Géré

Non géré

Commutateurs Ethernet industriels en Amérique latine par domaines d'application

Réseau intelligent

Sécurité et surveillance

Commutateurs Ethernet industriels en Amérique latine par taille d'organisation

PME

Grande entreprise

Commutateurs Ethernet industriels en Amérique latine par utilisateur final

Aéronautique et défense

Pétrole et gaz

Compare Licence

×
Features License Type
Single User Multiuser License Enterprise User
Price $4,950 $5,950 $7,250
Maximum User Access Limit 1 User Upto 10 Users Unrestricted Access Throughout the Organization
Free Customization
Direct Access to Analyst
Deliverable Format
Platform Access
Discount on Next Purchase 10% 15% 15%
Printable Versions