Segmentation du marché de l’emballage et du transport
Emballage et transport par application (milliard USD, 2025-2035)
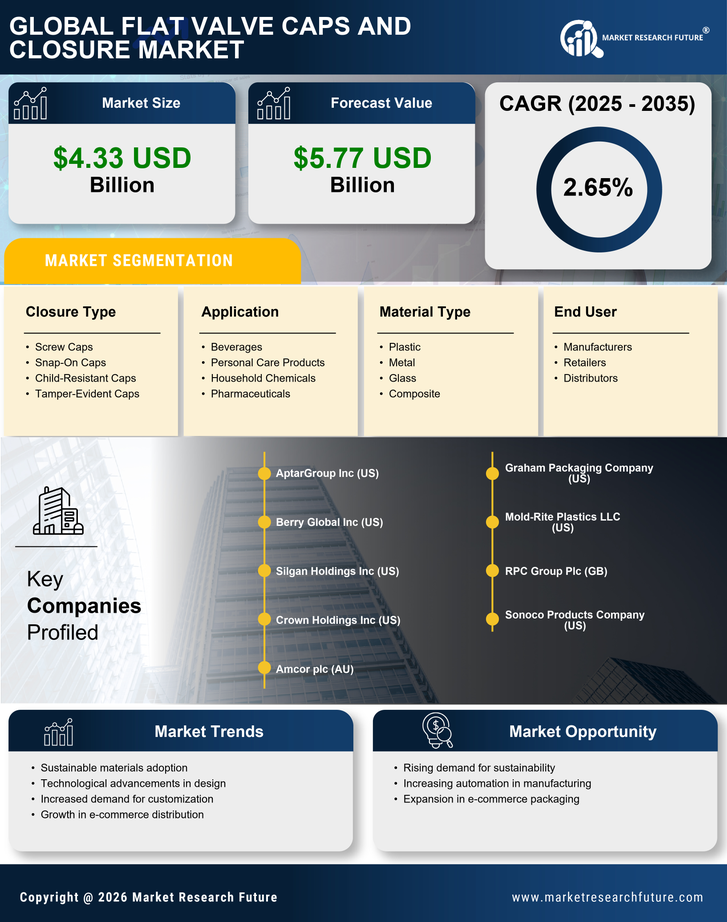
- Boissons
- Produits de soins personnels
- Produits chimiques ménagers
- Médicaments
Emballage et transport par type de matériau (USD milliards, 2025-2035)
- Plastique
- Métal
- Verre
- Composite
Emballage et transport par type de fermeture (USD milliards, 2025-2035)
- Bouchons à vis
- Casquettes à clipser
- Casquettes à l'épreuve des enfants
- Bouchons inviolables
Emballage et transport par utilisateur final (Milliard USD, 2025-2035)
- Fabricants
- Détaillants
- Distributeurs