Request Free Sample ×

Kindly complete the form below to receive a free sample of this Report

* Please use a valid business email

Leading companies partner with us for data-driven Insights

clients tt-cursor
Hero Background

Marché des logiciels de partage de fichiers

ID: MRFR/ICT/3155-CR
101 Pages
Ankit Gupta
Last Updated: April 24, 2026

Rapport de recherche sur le marché des logiciels de partage de fichiers Informations par type (Client-Serveur et Pair à Pair), par mode de déploiement (Cloud), par utilisateur final (Entreprises et Individus), par secteur (Gouvernement, Santé, Médias et Divertissement), et par région (Amérique du Nord, Europe, Asie-Pacifique, et Reste du Monde) – Prévisions du marché jusqu'en 2035.

Partager
Download PDF ×

We do not share your information with anyone. However, we may send you emails based on your report interest from time to time. You may contact us at any time to opt-out.

File Sharing Software Market Infographic
Purchase Options
  1. 1 SECTION I : RÉSUMÉ EXÉCUTIF ET POINTS CLÉS
    1. 1.1 RÉSUMÉ EXÉCUTIF
      1. 1.1.1 Vue d'ensemble du marché
      2. 1.1.2 Conclusions clés
      3. 1.1.3 Segmentation du marché
      4. 1.1.4 Paysage concurrentiel
      5. 1.1.5 Défis et opportunités
      6. 1.1.6 Perspectives d'avenir
  2. 2 SECTION II : DÉLIMITATION, MÉTHODOLOGIE ET STRUCTURE DU MARCHÉ
    1. 2.1 INTRODUCTION AU MARCHÉ
      1. 2.1.1 Définition
      2. 2.1.2 Portée de l'étude
        1. 2.1.2.1 Objectif de recherche
        2. 2.1.2.2 Hypothèse
        3. 2.1.2.3 Limitations
    2. 2.2 MÉTHODOLOGIE DE RECHERCHE
      1. 2.2.1 Vue d'ensemble
      2. 2.2.2 Exploration des données
      3. 2.2.3 Recherche secondaire
      4. 2.2.4 Recherche primaire
        1. 2.2.4.1 Interviews primaires et processus de collecte d'informations
        2. 2.2.4.2 Répartition des répondants principaux
      5. 2.2.5 Modèle de prévision
      6. 2.2.6 Estimation de la taille du marché
        1. 2.2.6.1 Approche ascendante
        2. 2.2.6.2 Approche descendante
      7. 2.2.7 Triangulation des données
      8. 2.2.8 Validation
  3. 3 SECTION III : ANALYSE QUALITATIVE
    1. 3.1 DYNAMIQUE DU MARCHÉ
      1. 3.1.1 Vue d'ensemble
      2. 3.1.2 Facteurs moteurs
      3. 3.1.3 Contraintes
      4. 3.1.4 Opportunités
    2. 3.2 ANALYSE DES FACTEURS DU MARCHÉ
      1. 3.2.1 Analyse de la chaîne de valeur
      2. 3.2.2 Analyse des cinq forces de Porter
        1. 3.2.2.1 Pouvoir de négociation des fournisseurs
        2. 3.2.2.2 Pouvoir de négociation des acheteurs
        3. 3.2.2.3 Menace des nouveaux entrants
        4. 3.2.2.4 Menace des substituts
        5. 3.2.2.5 Intensité de la rivalité
      3. 3.2.3 Analyse de l'impact du COVID-19
        1. 3.2.3.1 Analyse de l'impact sur le marché
        2. 3.2.3.2 Impact régional
        3. 3.2.3.3 Analyse des opportunités et des menaces
  4. 4 SECTION IV : ANALYSE QUANTITATIVE
    1. 4.1 Technologies de l'information et de la communication, PAR Type (milliards USD)
      1. 4.1.1 Client-Serveur
      2. 4.1.2 Pair à pair
    2. 4.2 Technologies de l'information et de la communication, PAR Mode de Déploiement (milliards USD)
      1. 4.2.1 Cloud
    3. 4.3 Technologies de l'information et de la communication, PAR Utilisateur Final (milliards USD)
      1. 4.3.1 Entreprises
      2. 4.3.2 Individuel
    4. 4.4 Technologies de l'information et de la communication, PAR Secteur (milliards USD)
      1. 4.4.1 Santé
      2. 4.4.2 Médias et divertissement
      3. 4.4.3 Gouvernement
    5. 4.5 Technologies de l'information et de la communication, PAR Région (milliards USD)
      1. 4.5.1 Amérique du Nord
        1. 4.5.1.1 États-Unis
        2. 4.5.1.2 Canada
      2. 4.5.2 Europe
        1. 4.5.2.1 Allemagne
        2. 4.5.2.2 Royaume-Uni
        3. 4.5.2.3 France
        4. 4.5.2.4 Russie
        5. 4.5.2.5 Italie
        6. 4.5.2.6 Espagne
        7. 4.5.2.7 Reste de l'Europe
      3. 4.5.3 APAC
        1. 4.5.3.1 Chine
        2. 4.5.3.2 Inde
        3. 4.5.3.3 Japon
        4. 4.5.3.4 Corée du Sud
        5. 4.5.3.5 Malaisie
        6. 4.5.3.6 Thaïlande
        7. 4.5.3.7 Indonésie
        8. 4.5.3.8 Reste de l'APAC
      4. 4.5.4 Amérique du Sud
        1. 4.5.4.1 Brésil
        2. 4.5.4.2 Mexique
        3. 4.5.4.3 Argentine
        4. 4.5.4.4 Reste de l'Amérique du Sud
      5. 4.5.5 MEA
        1. 4.5.5.1 Pays du CCG
        2. 4.5.5.2 Afrique du Sud
        3. 4.5.5.3 Reste de la MEA
  5. 5 SECTION V : ANALYSE CONCURRENTIELLE
    1. 5.1 Paysage concurrentiel
      1. 5.1.1 Vue d'ensemble
      2. 5.1.2 Analyse concurrentielle
      3. 5.1.3 Analyse de la part de marché
      4. 5.1.4 Stratégie de croissance majeure dans les technologies de l'information et de la communication
      5. 5.1.5 Évaluation comparative concurrentielle
      6. 5.1.6 Acteurs principaux en termes de nombre de développements dans les technologies de l'information et de la communication
      7. 5.1.7 Développements clés et stratégies de croissance
        1. 5.1.7.1 Lancement de nouveaux produits/Déploiement de services
        2. 5.1.7.2 Fusions et acquisitions
        3. 5.1.7.3 Coentreprises
      8. 5.1.8 Matrice financière des principaux acteurs
        1. 5.1.8.1 Ventes et revenu d'exploitation
        2. 5.1.8.2 Dépenses de R&D des principaux acteurs. 2023
    2. 5.2 Profils d'entreprise
      1. 5.2.1 Dropbox Inc (États-Unis)
        1. 5.2.1.1 Vue d'ensemble financière
        2. 5.2.1.2 Produits offerts
        3. 5.2.1.3 Développements clés
        4. 5.2.1.4 Analyse SWOT
        5. 5.2.1.5 Stratégies clés
      2. 5.2.2 Google LLC (États-Unis)
        1. 5.2.2.1 Vue d'ensemble financière
        2. 5.2.2.2 Produits offerts
        3. 5.2.2.3 Développements clés
        4. 5.2.2.4 Analyse SWOT
        5. 5.2.2.5 Stratégies clés
      3. 5.2.3 Microsoft Corporation (États-Unis)
        1. 5.2.3.1 Vue d'ensemble financière
        2. 5.2.3.2 Produits offerts
        3. 5.2.3.3 Développements clés
        4. 5.2.3.4 Analyse SWOT
        5. 5.2.3.5 Stratégies clés
      4. 5.2.4 Box Inc (États-Unis)
        1. 5.2.4.1 Vue d'ensemble financière
        2. 5.2.4.2 Produits offerts
        3. 5.2.4.3 Développements clés
        4. 5.2.4.4 Analyse SWOT
        5. 5.2.4.5 Stratégies clés
      5. 5.2.5 WeTransfer B.V. (NL)
        1. 5.2.5.1 Vue d'ensemble financière
        2. 5.2.5.2 Produits offerts
        3. 5.2.5.3 Développements clés
        4. 5.2.5.4 Analyse SWOT
        5. 5.2.5.5 Stratégies clés
      6. 5.2.6 Citrix Systems Inc (États-Unis)
        1. 5.2.6.1 Vue d'ensemble financière
        2. 5.2.6.2 Produits offerts
        3. 5.2.6.3 Développements clés
        4. 5.2.6.4 Analyse SWOT
        5. 5.2.6.5 Stratégies clés
      7. 5.2.7 pCloud AG (CH)
        1. 5.2.7.1 Vue d'ensemble financière
        2. 5.2.7.2 Produits offerts
        3. 5.2.7.3 Développements clés
        4. 5.2.7.4 Analyse SWOT
        5. 5.2.7.5 Stratégies clés
      8. 5.2.8 Sync.com Inc (CA)
        1. 5.2.8.1 Vue d'ensemble financière
        2. 5.2.8.2 Produits offerts
        3. 5.2.8.3 Développements clés
        4. 5.2.8.4 Analyse SWOT
        5. 5.2.8.5 Stratégies clés
      9. 5.2.9 Tresorit AG (CH)
        1. 5.2.9.1 Vue d'ensemble financière
        2. 5.2.9.2 Produits offerts
        3. 5.2.9.3 Développements clés
        4. 5.2.9.4 Analyse SWOT
        5. 5.2.9.5 Stratégies clés
    3. 5.3 Annexe
      1. 5.3.1 Références
      2. 5.3.2 Rapports connexes
  6. 6 LISTE DES FIGURES
    1. 6.1 SYNOPSIS DU MARCHÉ
    2. 6.2 ANALYSE DU MARCHÉ EN AMÉRIQUE DU NORD
    3. 6.3 ANALYSE DU MARCHÉ AUX ÉTATS-UNIS PAR TYPE
    4. 6.4 ANALYSE DU MARCHÉ AUX ÉTATS-UNIS PAR MODE DE DÉPLOIEMENT
    5. 6.5 ANALYSE DU MARCHÉ AUX ÉTATS-UNIS PAR UTILISATEUR FINAL
    6. 6.6 ANALYSE DU MARCHÉ AUX ÉTATS-UNIS PAR SECTEUR
    7. 6.7 ANALYSE DU MARCHÉ AU CANADA PAR TYPE
    8. 6.8 ANALYSE DU MARCHÉ AU CANADA PAR MODE DE DÉPLOIEMENT
    9. 6.9 ANALYSE DU MARCHÉ AU CANADA PAR UTILISATEUR FINAL
    10. 6.10 ANALYSE DU MARCHÉ AU CANADA PAR SECTEUR
    11. 6.11 ANALYSE DU MARCHÉ EN EUROPE
    12. 6.12 ANALYSE DU MARCHÉ EN ALLEMAGNE PAR TYPE
    13. 6.13 ANALYSE DU MARCHÉ EN ALLEMAGNE PAR MODE DE DÉPLOIEMENT
    14. 6.14 ANALYSE DU MARCHÉ EN ALLEMAGNE PAR UTILISATEUR FINAL
    15. 6.15 ANALYSE DU MARCHÉ EN ALLEMAGNE PAR SECTEUR
    16. 6.16 ANALYSE DU MARCHÉ AU ROYAUME-UNI PAR TYPE
    17. 6.17 ANALYSE DU MARCHÉ AU ROYAUME-UNI PAR MODE DE DÉPLOIEMENT
    18. 6.18 ANALYSE DU MARCHÉ AU ROYAUME-UNI PAR UTILISATEUR FINAL
    19. 6.19 ANALYSE DU MARCHÉ AU ROYAUME-UNI PAR SECTEUR
    20. 6.20 ANALYSE DU MARCHÉ EN FRANCE PAR TYPE
    21. 6.21 ANALYSE DU MARCHÉ EN FRANCE PAR MODE DE DÉPLOIEMENT
    22. 6.22 ANALYSE DU MARCHÉ EN FRANCE PAR UTILISATEUR FINAL
    23. 6.23 ANALYSE DU MARCHÉ EN FRANCE PAR SECTEUR
    24. 6.24 ANALYSE DU MARCHÉ EN RUSSIE PAR TYPE
    25. 6.25 ANALYSE DU MARCHÉ EN RUSSIE PAR MODE DE DÉPLOIEMENT
    26. 6.26 ANALYSE DU MARCHÉ EN RUSSIE PAR UTILISATEUR FINAL
    27. 6.27 ANALYSE DU MARCHÉ EN RUSSIE PAR SECTEUR
    28. 6.28 ANALYSE DU MARCHÉ EN ITALIE PAR TYPE
    29. 6.29 ANALYSE DU MARCHÉ EN ITALIE PAR MODE DE DÉPLOIEMENT
    30. 6.30 ANALYSE DU MARCHÉ EN ITALIE PAR UTILISATEUR FINAL
    31. 6.31 ANALYSE DU MARCHÉ EN ITALIE PAR SECTEUR
    32. 6.32 ANALYSE DU MARCHÉ EN ESPAGNE PAR TYPE
    33. 6.33 ANALYSE DU MARCHÉ EN ESPAGNE PAR MODE DE DÉPLOIEMENT
    34. 6.34 ANALYSE DU MARCHÉ EN ESPAGNE PAR UTILISATEUR FINAL
    35. 6.35 ANALYSE DU MARCHÉ EN ESPAGNE PAR SECTEUR
    36. 6.36 ANALYSE DU MARCHÉ DANS LE RESTE DE L'EUROPE PAR TYPE
    37. 6.37 ANALYSE DU MARCHÉ DANS LE RESTE DE L'EUROPE PAR MODE DE DÉPLOIEMENT
    38. 6.38 ANALYSE DU MARCHÉ DANS LE RESTE DE L'EUROPE PAR UTILISATEUR FINAL
    39. 6.39 ANALYSE DU MARCHÉ DANS LE RESTE DE L'EUROPE PAR SECTEUR
    40. 6.40 ANALYSE DU MARCHÉ EN APAC
    41. 6.41 ANALYSE DU MARCHÉ EN CHINE PAR TYPE
    42. 6.42 ANALYSE DU MARCHÉ EN CHINE PAR MODE DE DÉPLOIEMENT
    43. 6.43 ANALYSE DU MARCHÉ EN CHINE PAR UTILISATEUR FINAL
    44. 6.44 ANALYSE DU MARCHÉ EN CHINE PAR SECTEUR
    45. 6.45 ANALYSE DU MARCHÉ EN INDE PAR TYPE
    46. 6.46 ANALYSE DU MARCHÉ EN INDE PAR MODE DE DÉPLOIEMENT
    47. 6.47 ANALYSE DU MARCHÉ EN INDE PAR UTILISATEUR FINAL
    48. 6.48 ANALYSE DU MARCHÉ EN INDE PAR SECTEUR
    49. 6.49 ANALYSE DU MARCHÉ AU JAPON PAR TYPE
    50. 6.50 ANALYSE DU MARCHÉ AU JAPON PAR MODE DE DÉPLOIEMENT
    51. 6.51 ANALYSE DU MARCHÉ AU JAPON PAR UTILISATEUR FINAL
    52. 6.52 ANALYSE DU MARCHÉ AU JAPON PAR SECTEUR
    53. 6.53 ANALYSE DU MARCHÉ EN CORÉE DU SUD PAR TYPE
    54. 6.54 ANALYSE DU MARCHÉ EN CORÉE DU SUD PAR MODE DE DÉPLOIEMENT
    55. 6.55 ANALYSE DU MARCHÉ EN CORÉE DU SUD PAR UTILISATEUR FINAL
    56. 6.56 ANALYSE DU MARCHÉ EN CORÉE DU SUD PAR SECTEUR
    57. 6.57 ANALYSE DU MARCHÉ EN MALAYSIE PAR TYPE
    58. 6.58 ANALYSE DU MARCHÉ EN MALAYSIE PAR MODE DE DÉPLOIEMENT
    59. 6.59 ANALYSE DU MARCHÉ EN MALAYSIE PAR UTILISATEUR FINAL
    60. 6.60 ANALYSE DU MARCHÉ EN MALAYSIE PAR SECTEUR
    61. 6.61 ANALYSE DU MARCHÉ EN THAÏLANDE PAR TYPE
    62. 6.62 ANALYSE DU MARCHÉ EN THAÏLANDE PAR MODE DE DÉPLOIEMENT
    63. 6.63 ANALYSE DU MARCHÉ EN THAÏLANDE PAR UTILISATEUR FINAL
    64. 6.64 ANALYSE DU MARCHÉ EN THAÏLANDE PAR SECTEUR
    65. 6.65 ANALYSE DU MARCHÉ EN INDONÉSIE PAR TYPE
    66. 6.66 ANALYSE DU MARCHÉ EN INDONÉSIE PAR MODE DE DÉPLOIEMENT
    67. 6.67 ANALYSE DU MARCHÉ EN INDONÉSIE PAR UTILISATEUR FINAL
    68. 6.68 ANALYSE DU MARCHÉ EN INDONÉSIE PAR SECTEUR
    69. 6.69 ANALYSE DU MARCHÉ DANS LE RESTE DE L'APAC PAR TYPE
    70. 6.70 ANALYSE DU MARCHÉ DANS LE RESTE DE L'APAC PAR MODE DE DÉPLOIEMENT
    71. 6.71 ANALYSE DU MARCHÉ DANS LE RESTE DE L'APAC PAR UTILISATEUR FINAL
    72. 6.72 ANALYSE DU MARCHÉ DANS LE RESTE DE L'APAC PAR SECTEUR
    73. 6.73 ANALYSE DU MARCHÉ EN AMÉRIQUE DU SUD
    74. 6.74 ANALYSE DU MARCHÉ AU BRÉSIL PAR TYPE
    75. 6.75 ANALYSE DU MARCHÉ AU BRÉSIL PAR MODE DE DÉPLOIEMENT
    76. 6.76 ANALYSE DU MARCHÉ AU BRÉSIL PAR UTILISATEUR FINAL
    77. 6.77 ANALYSE DU MARCHÉ AU BRÉSIL PAR SECTEUR
    78. 6.78 ANALYSE DU MARCHÉ AU MEXIQUE PAR TYPE
    79. 6.79 ANALYSE DU MARCHÉ AU MEXIQUE PAR MODE DE DÉPLOIEMENT
    80. 6.80 ANALYSE DU MARCHÉ AU MEXIQUE PAR UTILISATEUR FINAL
    81. 6.81 ANALYSE DU MARCHÉ AU MEXIQUE PAR SECTEUR
    82. 6.82 ANALYSE DU MARCHÉ EN ARGENTINE PAR TYPE
    83. 6.83 ANALYSE DU MARCHÉ EN ARGENTINE PAR MODE DE DÉPLOIEMENT
    84. 6.84 ANALYSE DU MARCHÉ EN ARGENTINE PAR UTILISATEUR FINAL
    85. 6.85 ANALYSE DU MARCHÉ EN ARGENTINE PAR SECTEUR
    86. 6.86 ANALYSE DU MARCHÉ DANS LE RESTE DE L'AMÉRIQUE DU SUD PAR TYPE
    87. 6.87 ANALYSE DU MARCHÉ DANS LE RESTE DE L'AMÉRIQUE DU SUD PAR MODE DE DÉPLOIEMENT
    88. 6.88 ANALYSE DU MARCHÉ DANS LE RESTE DE L'AMÉRIQUE DU SUD PAR UTILISATEUR FINAL
    89. 6.89 ANALYSE DU MARCHÉ DANS LE RESTE DE L'AMÉRIQUE DU SUD PAR SECTEUR
    90. 6.90 ANALYSE DU MARCHÉ EN MEA
    91. 6.91 ANALYSE DU MARCHÉ DANS LES PAYS DU CCG PAR TYPE
    92. 6.92 ANALYSE DU MARCHÉ DANS LES PAYS DU CCG PAR MODE DE DÉPLOIEMENT
    93. 6.93 ANALYSE DU MARCHÉ DANS LES PAYS DU CCG PAR UTILISATEUR FINAL
    94. 6.94 ANALYSE DU MARCHÉ DANS LES PAYS DU CCG PAR SECTEUR
    95. 6.95 ANALYSE DU MARCHÉ EN AFRIQUE DU SUD PAR TYPE
    96. 6.96 ANALYSE DU MARCHÉ EN AFRIQUE DU SUD PAR MODE DE DÉPLOIEMENT
    97. 6.97 ANALYSE DU MARCHÉ EN AFRIQUE DU SUD PAR UTILISATEUR FINAL
    98. 6.98 ANALYSE DU MARCHÉ EN AFRIQUE DU SUD PAR SECTEUR
    99. 6.99 ANALYSE DU MARCHÉ DANS LE RESTE DE LA MEA PAR TYPE
    100. 6.100 ANALYSE DU MARCHÉ DANS LE RESTE DE LA MEA PAR MODE DE DÉPLOIEMENT
    101. 6.101 ANALYSE DU MARCHÉ DANS LE RESTE DE LA MEA PAR UTILISATEUR FINAL
    102. 6.102 ANALYSE DU MARCHÉ DANS LE RESTE DE LA MEA PAR SECTEUR
    103. 6.103 CRITÈRES D'ACHAT CLÉS DES TECHNOLOGIES DE L'INFORMATION ET DE LA COMMUNICATION
    104. 6.104 PROCESSUS DE RECHERCHE DE MRFR
    105. 6.105 ANALYSE DRO DES TECHNOLOGIES DE L'INFORMATION ET DE LA COMMUNICATION
    106. 6.106 ANALYSE D'IMPACT DES FACTEURS MOTRICES : TECHNOLOGIES DE L'INFORMATION ET DE LA COMMUNICATION
    107. 6.107 ANALYSE D'IMPACT DES CONTRAINTES : TECHNOLOGIES DE L'INFORMATION ET DE LA COMMUNICATION
    108. 6.108 CHAÎNE D'APPROVISIONNEMENT / VALEUR : TECHNOLOGIES DE L'INFORMATION ET DE LA COMMUNICATION
    109. 6.109 TECHNOLOGIES DE L'INFORMATION ET DE LA COMMUNICATION, PAR TYPE, 2024 (% PART)
    110. 6.110 TECHNOLOGIES DE L'INFORMATION ET DE LA COMMUNICATION, PAR TYPE, 2024 À 2035 (milliards USD)
    111. 6.111 TECHNOLOGIES DE L'INFORMATION ET DE LA COMMUNICATION, PAR MODE DE DÉPLOIEMENT, 2024 (% PART)
    112. 6.112 TECHNOLOGIES DE L'INFORMATION ET DE LA COMMUNICATION, PAR MODE DE DÉPLOIEMENT, 2024 À 2035 (milliards USD)
    113. 6.113 TECHNOLOGIES DE L'INFORMATION ET DE LA COMMUNICATION, PAR UTILISATEUR FINAL, 2024 (% PART)
    114. 6.114 TECHNOLOGIES DE L'INFORMATION ET DE LA COMMUNICATION, PAR UTILISATEUR FINAL, 2024 À 2035 (milliards USD)
    115. 6.115 TECHNOLOGIES DE L'INFORMATION ET DE LA COMMUNICATION, PAR SECTEUR, 2024 (% PART)
    116. 6.116 TECHNOLOGIES DE L'INFORMATION ET DE LA COMMUNICATION, PAR SECTEUR, 2024 À 2035 (milliards USD)
    117. 6.117 ÉVALUATION DES PRINCIPAUX CONCURRENTS
  7. 7 LISTE DES TABLEAUX
    1. 7.1 LISTE DES HYPOTHÈSES
  8. 7.1.1
    1. 7.2 ESTIMATIONS DE LA TAILLE DU MARCHÉ EN AMÉRIQUE DU NORD ; PRÉVISIONS
      1. 7.2.1 PAR TYPE, 2025-2035 (milliards USD)
      2. 7.2.2 PAR MODE DE DÉPLOIEMENT, 2025-2035 (milliards USD)
      3. 7.2.3 PAR UTILISATEUR FINAL, 2025-2035 (milliards USD)
      4. 7.2.4 PAR SECTEUR, 2025-2035 (milliards USD)
    2. 7.3 ESTIMATIONS DE LA TAILLE DU MARCHÉ AUX ÉTATS-UNIS ; PRÉVISIONS
      1. 7.3.1 PAR TYPE, 2025-2035 (milliards USD)
      2. 7.3.2 PAR MODE DE DÉPLOIEMENT, 2025-2035 (milliards USD)
      3. 7.3.3 PAR UTILISATEUR FINAL, 2025-2035 (milliards USD)
      4. 7.3.4 PAR SECTEUR, 2025-2035 (milliards USD)
    3. 7.4 ESTIMATIONS DE LA TAILLE DU MARCHÉ AU CANADA ; PRÉVISIONS
      1. 7.4.1 PAR TYPE, 2025-2035 (milliards USD)
      2. 7.4.2 PAR MODE DE DÉPLOIEMENT, 2025-2035 (milliards USD)
      3. 7.4.3 PAR UTILISATEUR FINAL, 2025-2035 (milliards USD)
      4. 7.4.4 PAR SECTEUR, 2025-2035 (milliards USD)
    4. 7.5 ESTIMATIONS DE LA TAILLE DU MARCHÉ EN EUROPE ; PRÉVISIONS
      1. 7.5.1 PAR TYPE, 2025-2035 (milliards USD)
      2. 7.5.2 PAR MODE DE DÉPLOIEMENT, 2025-2035 (milliards USD)
      3. 7.5.3 PAR UTILISATEUR FINAL, 2025-2035 (milliards USD)
      4. 7.5.4 PAR SECTEUR, 2025-2035 (milliards USD)
    5. 7.6 ESTIMATIONS DE LA TAILLE DU MARCHÉ EN ALLEMAGNE ; PRÉVISIONS
      1. 7.6.1 PAR TYPE, 2025-2035 (milliards USD)
      2. 7.6.2 PAR MODE DE DÉPLOIEMENT, 2025-2035 (milliards USD)
      3. 7.6.3 PAR UTILISATEUR FINAL, 2025-2035 (milliards USD)
      4. 7.6.4 PAR SECTEUR, 2025-2035 (milliards USD)
    6. 7.7 ESTIMATIONS DE LA TAILLE DU MARCHÉ AU ROYAUME-UNI ; PRÉVISIONS
      1. 7.7.1 PAR TYPE, 2025-2035 (milliards USD)
      2. 7.7.2 PAR MODE DE DÉPLOIEMENT, 2025-2035 (milliards USD)
      3. 7.7.3 PAR UTILISATEUR FINAL, 2025-2035 (milliards USD)
      4. 7.7.4 PAR SECTEUR, 2025-2035 (milliards USD)
    7. 7.8 ESTIMATIONS DE LA TAILLE DU MARCHÉ EN FRANCE ; PRÉVISIONS
      1. 7.8.1 PAR TYPE, 2025-2035 (milliards USD)
      2. 7.8.2 PAR MODE DE DÉPLOIEMENT, 2025-2035 (milliards USD)
      3. 7.8.3 PAR UTILISATEUR FINAL, 2025-2035 (milliards USD)
      4. 7.8.4 PAR SECTEUR, 2025-2035 (milliards USD)
    8. 7.9 ESTIMATIONS DE LA TAILLE DU MARCHÉ EN RUSSIE ; PRÉVISIONS
      1. 7.9.1 PAR TYPE, 2025-2035 (milliards USD)
      2. 7.9.2 PAR MODE DE DÉPLOIEMENT, 2025-2035 (milliards USD)
      3. 7.9.3 PAR UTILISATEUR FINAL, 2025-2035 (milliards USD)
      4. 7.9.4 PAR SECTEUR, 2025-2035 (milliards USD)
    9. 7.10 ESTIMATIONS DE LA TAILLE DU MARCHÉ EN ITALIE ; PRÉVISIONS
      1. 7.10.1 PAR TYPE, 2025-2035 (milliards USD)
      2. 7.10.2 PAR MODE DE DÉPLOIEMENT, 2025-2035 (milliards USD)
      3. 7.10.3 PAR UTILISATEUR FINAL, 2025-2035 (milliards USD)
      4. 7.10.4 PAR SECTEUR, 2025-2035 (milliards USD)
    10. 7.11 ESTIMATIONS DE LA TAILLE DU MARCHÉ EN ESPAGNE ; PRÉVISIONS
      1. 7.11.1 PAR TYPE, 2025-2035 (milliards USD)
      2. 7.11.2 PAR MODE DE DÉPLOIEMENT, 2025-2035 (milliards USD)
      3. 7.11.3 PAR UTILISATEUR FINAL, 2025-2035 (milliards USD)
      4. 7.11.4 PAR SECTEUR, 2025-2035 (milliards USD)
    11. 7.12 ESTIMATIONS DE LA TAILLE DU MARCHÉ DANS LE RESTE DE L'EUROPE ; PRÉVISIONS
      1. 7.12.1 PAR TYPE, 2025-2035 (milliards USD)
      2. 7.12.2 PAR MODE DE DÉPLOIEMENT, 2025-2035 (milliards USD)
      3. 7.12.3 PAR UTILISATEUR FINAL, 2025-2035 (milliards USD)
      4. 7.12.4 PAR SECTEUR, 2025-2035 (milliards USD)
    12. 7.13 ESTIMATIONS DE LA TAILLE DU MARCHÉ EN APAC ; PRÉVISIONS
      1. 7.13.1 PAR TYPE, 2025-2035 (milliards USD)
      2. 7.13.2 PAR MODE DE DÉPLOIEMENT, 2025-2035 (milliards USD)
      3. 7.13.3 PAR UTILISATEUR FINAL, 2025-2035 (milliards USD)
      4. 7.13.4 PAR SECTEUR, 2025-2035 (milliards USD)
    13. 7.14 ESTIMATIONS DE LA TAILLE DU MARCHÉ EN CHINE ; PRÉVISIONS
      1. 7.14.1 PAR TYPE, 2025-2035 (milliards USD)
      2. 7.14.2 PAR MODE DE DÉPLOIEMENT, 2025-2035 (milliards USD)
      3. 7.14.3 PAR UTILISATEUR FINAL, 2025-2035 (milliards USD)
      4. 7.14.4 PAR SECTEUR, 2025-2035 (milliards USD)
    14. 7.15 ESTIMATIONS DE LA TAILLE DU MARCHÉ EN INDE ; PRÉVISIONS
      1. 7.15.1 PAR TYPE, 2025-2035 (milliards USD)
      2. 7.15.2 PAR MODE DE DÉPLOIEMENT, 2025-2035 (milliards USD)
      3. 7.15.3 PAR UTILISATEUR FINAL, 2025-2035 (milliards USD)
      4. 7.15.4 PAR SECTEUR, 2025-2035 (milliards USD)
    15. 7.16 ESTIMATIONS DE LA TAILLE DU MARCHÉ AU JAPON ; PRÉVISIONS
      1. 7.16.1 PAR TYPE, 2025-2035 (milliards USD)
      2. 7.16.2 PAR MODE DE DÉPLOIEMENT, 2025-2035 (milliards USD)
      3. 7.16.3 PAR UTILISATEUR FINAL, 2025-2035 (milliards USD)
      4. 7.16.4 PAR SECTEUR, 2025-2035 (milliards USD)
    16. 7.17 ESTIMATIONS DE LA TAILLE DU MARCHÉ EN CORÉE DU SUD ; PRÉVISIONS
      1. 7.17.1 PAR TYPE, 2025-2035 (milliards USD)
      2. 7.17.2 PAR MODE DE DÉPLOIEMENT, 2025-2035 (milliards USD)
      3. 7.17.3 PAR UTILISATEUR FINAL, 2025-2035 (milliards USD)
      4. 7.17.4 PAR SECTEUR, 2025-2035 (milliards USD)
    17. 7.18 ESTIMATIONS DE LA TAILLE DU MARCHÉ EN MALAYSIE ; PRÉVISIONS
      1. 7.18.1 PAR TYPE, 2025-2035 (milliards USD)
      2. 7.18.2 PAR MODE DE DÉPLOIEMENT, 2025-2035 (milliards USD)
      3. 7.18.3 PAR UTILISATEUR FINAL, 2025-2035 (milliards USD)
      4. 7.18.4 PAR SECTEUR, 2025-2035 (milliards USD)
    18. 7.19 ESTIMATIONS DE LA TAILLE DU MARCHÉ EN THAÏLANDE ; PRÉVISIONS
      1. 7.19.1 PAR TYPE, 2025-2035 (milliards USD)
      2. 7.19.2 PAR MODE DE DÉPLOIEMENT, 2025-2035 (milliards USD)
      3. 7.19.3 PAR UTILISATEUR FINAL, 2025-2035 (milliards USD)
      4. 7.19.4 PAR SECTEUR, 2025-2035 (milliards USD)
    19. 7.20 ESTIMATIONS DE LA TAILLE DU MARCHÉ EN INDONÉSIE ; PRÉVISIONS
      1. 7.20.1 PAR TYPE, 2025-2035 (milliards USD)
      2. 7.20.2 PAR MODE DE DÉPLOIEMENT, 2025-2035 (milliards USD)
      3. 7.20.3 PAR UTILISATEUR FINAL, 2025-2035 (milliards USD)
      4. 7.20.4 PAR SECTEUR, 2025-2035 (milliards USD)
    20. 7.21 ESTIMATIONS DE LA TAILLE DU MARCHÉ DANS LE RESTE DE L'APAC ; PRÉVISIONS
      1. 7.21.1 PAR TYPE, 2025-2035 (milliards USD)
      2. 7.21.2 PAR MODE DE DÉPLOIEMENT, 2025-2035 (milliards USD)
      3. 7.21.3 PAR UTILISATEUR FINAL, 2025-2035 (milliards USD)
      4. 7.21.4 PAR SECTEUR, 2025-2035 (milliards USD)
    21. 7.22 ESTIMATIONS DE LA TAILLE DU MARCHÉ EN AMÉRIQUE DU SUD ; PRÉVISIONS
      1. 7.22.1 PAR TYPE, 2025-2035 (milliards USD)
      2. 7.22.2 PAR MODE DE DÉPLOIEMENT, 2025-2035 (milliards USD)
      3. 7.22.3 PAR UTILISATEUR FINAL, 2025-2035 (milliards USD)
      4. 7.22.4 PAR SECTEUR, 2025-2035 (milliards USD)
    22. 7.23 ESTIMATIONS DE LA TAILLE DU MARCHÉ AU BRÉSIL ; PRÉVISIONS
      1. 7.23.1 PAR TYPE, 2025-2035 (milliards USD)
      2. 7.23.2 PAR MODE DE DÉPLOIEMENT, 2025-2035 (milliards USD)
      3. 7.23.3 PAR UTILISATEUR FINAL, 2025-2035 (milliards USD)
      4. 7.23.4 PAR SECTEUR, 2025-2035 (milliards USD)
    23. 7.24 ESTIMATIONS DE LA TAILLE DU MARCHÉ AU MEXIQUE ; PRÉVISIONS
      1. 7.24.1 PAR TYPE, 2025-2035 (milliards USD)
      2. 7.24.2 PAR MODE DE DÉPLOIEMENT, 2025-2035 (milliards USD)
      3. 7.24.3 PAR UTILISATEUR FINAL, 2025-2035 (milliards USD)
      4. 7.24.4 PAR SECTEUR, 2025-2035 (milliards USD)
    24. 7.25 ESTIMATIONS DE LA TAILLE DU MARCHÉ EN ARGENTINE ; PRÉVISIONS
      1. 7.25.1 PAR TYPE, 2025-2035 (milliards USD)
      2. 7.25.2 PAR MODE DE DÉPLOIEMENT, 2025-2035 (milliards USD)
      3. 7.25.3 PAR UTILISATEUR FINAL, 2025-2035 (milliards USD)
      4. 7.25.4 PAR SECTEUR, 2025-2035 (milliards USD)
    25. 7.26 ESTIMATIONS DE LA TAILLE DU MARCHÉ DANS LE RESTE DE L'AMÉRIQUE DU SUD ; PRÉVISIONS
      1. 7.26.1 PAR TYPE, 2025-2035 (milliards USD)
      2. 7.26.2 PAR MODE DE DÉPLOIEMENT, 2025-2035 (milliards USD)
      3. 7.26.3 PAR UTILISATEUR FINAL, 2025-2035 (milliards USD)
      4. 7.26.4 PAR SECTEUR, 2025-2035 (milliards USD)
    26. 7.27 ESTIMATIONS DE LA TAILLE DU MARCHÉ EN MEA ; PRÉVISIONS
      1. 7.27.1 PAR TYPE, 2025-2035 (milliards USD)
      2. 7.27.2 PAR MODE DE DÉPLOIEMENT, 2025-2035 (milliards USD)
      3. 7.27.3 PAR UTILISATEUR FINAL, 2025-2035 (milliards USD)
      4. 7.27.4 PAR SECTEUR, 2025-2035 (milliards USD)
    27. 7.28 ESTIMATIONS DE LA TAILLE DU MARCHÉ DANS LES PAYS DU CCG ; PRÉVISIONS
      1. 7.28.1 PAR TYPE, 2025-2035 (milliards USD)
      2. 7.28.2 PAR MODE DE DÉPLOIEMENT, 2025-2035 (milliards USD)
      3. 7.28.3 PAR UTILISATEUR FINAL, 2025-2035 (milliards USD)
      4. 7.28.4 PAR SECTEUR, 2025-2035 (milliards USD)
    28. 7.29 ESTIMATIONS DE LA TAILLE DU MARCHÉ EN AFRIQUE DU SUD ; PRÉVISIONS
      1. 7.29.1 PAR TYPE, 2025-2035 (milliards USD)
      2. 7.29.2 PAR MODE DE DÉPLOIEMENT, 2025-2035 (milliards USD)
      3. 7.29.3 PAR UTILISATEUR FINAL, 2025-2035 (milliards USD)
      4. 7.29.4 PAR SECTEUR, 2025-2035 (milliards USD)
    29. 7.30 ESTIMATIONS DE LA TAILLE DU MARCHÉ DANS LE RESTE DE LA MEA ; PRÉVISIONS
      1. 7.30.1 PAR TYPE, 2025-2035 (milliards USD)
      2. 7.30.2 PAR MODE DE DÉPLOIEMENT, 2025-2035 (milliards USD)
      3. 7.30.3 PAR UTILISATEUR FINAL, 2025-2035 (milliards USD)
      4. 7.30.4 PAR SECTEUR, 2025-2035 (milliards USD)
    30. 7.31 LANCEMENT DE PRODUIT/DÉVELOPPEMENT/APPROBATION
  9. 7.31.1
    1. 7.32 ACQUISITION/PARTENARIAT
  10. 7.32.1

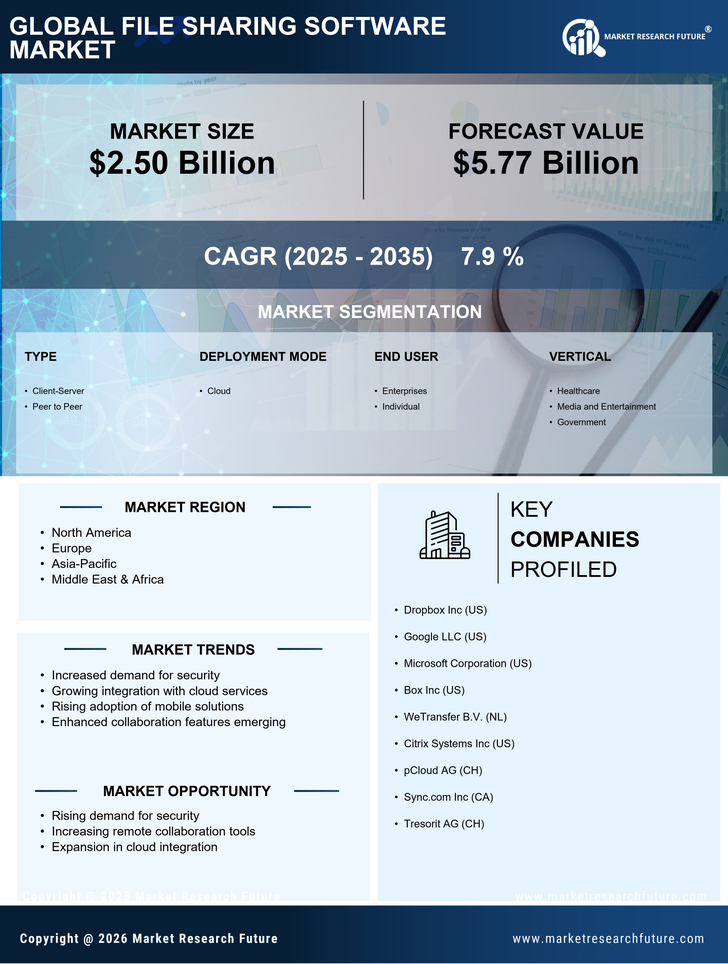
Segmentation du marché des logiciels de partage de fichiers

Perspectives par type de logiciel de partage de fichiers (milliards USD, 2018-2032)

  • Client-Serveur

  • Pair à pair

Perspectives par mode de déploiement de logiciel de partage de fichiers (milliards USD, 2018-2032)

  • Cloud

Perspectives par utilisateur final de logiciel de partage de fichiers (milliards USD, 2018-2032)

  • Entreprises

  • Individuel

Perspectives par secteur de logiciel de partage de fichiers (milliards USD, 2018-2032)

  • Santé

  • Média et divertissement

  • Gouvernement

Perspectives régionales de logiciel de partage de fichiers (milliards USD, 2018-2032)

  • Perspectives de l'Amérique du Nord (milliards USD, 2018-2032)

    • Logiciel de partage de fichiers en Amérique du Nord par type

      • Client-Serveur

      • Pair à pair

    • Logiciel de partage de fichiers en Amérique du Nord par mode de déploiement

      • Cloud

    • Logiciel de partage de fichiers en Amérique du Nord par utilisateur final

      • Entreprises

      • Individuel

    • Logiciel de partage de fichiers en Amérique du Nord par secteur

      • Santé

      • Média et divertissement

      • Gouvernement

    • Perspectives des États-Unis (milliards USD, 2018-2032)

    • Logiciel de partage de fichiers aux États-Unis par type

      • Client-Serveur

      • Pair à pair

    • Logiciel de partage de fichiers aux États-Unis par mode de déploiement

      • Cloud

    • Logiciel de partage de fichiers aux États-Unis par utilisateur final

      • Entreprises

      • Individuel

    • Logiciel de partage de fichiers aux États-Unis par secteur

      • Santé

      • Média et divertissement

      • Gouvernement

    • Perspectives du CANADA (milliards USD, 2018-2032)

    • Logiciel de partage de fichiers au CANADA par type

      • Client-Serveur

      • Pair à pair

    • Logiciel de partage de fichiers au CANADA par mode de déploiement

      • Cloud

    • Logiciel de partage de fichiers au CANADA par utilisateur final

      • Entreprises

      • Individuel

    • Logiciel de partage de fichiers au CANADA par secteur

      • Santé

      • Média et divertissement

      • Gouvernement

  • Perspectives de l'Europe (milliards USD, 2018-2032)

    • Logiciel de partage de fichiers en Europe par type

      • Client-Serveur

      • Pair à pair

    • Logiciel de partage de fichiers en Europe par mode de déploiement

      • Cloud

    • Logiciel de partage de fichiers en Europe par utilisateur final

      • Entreprises

      • Individuel

    • Logiciel de partage de fichiers en Europe par secteur

      • Santé

      • Média et divertissement

      • Gouvernement

    • Perspectives de l'Allemagne (milliards USD, 2018-2032)

    • Logiciel de partage de fichiers en Allemagne par type

      • Client-Serveur

      • Pair à pair

    • Logiciel de partage de fichiers en Allemagne par mode de déploiement

      • Cloud

    • Logiciel de partage de fichiers en Allemagne par utilisateur final

      • Entreprises

      • Individuel

    • Logiciel de partage de fichiers en Allemagne par secteur

      • Santé

      • Média et divertissement

      • Gouvernement

    • Perspectives de la France (milliards USD, 2018-2032)

    • Logiciel de partage de fichiers en France par type

      • Client-Serveur

      • Pair à pair

    • Logiciel de partage de fichiers en France par mode de déploiement

      • Cloud

    • Logiciel de partage de fichiers en France par utilisateur final

      • Entreprises

      • Individuel

    • Logiciel de partage de fichiers en France par secteur

      • Santé

      • Média et divertissement

      • Gouvernement

    • Perspectives du Royaume-Uni (milliards USD, 2018-2032)

    • Logiciel de partage de fichiers au Royaume-Uni par type

      • Client-Serveur

      • Pair à pair

    • Logiciel de partage de fichiers au Royaume-Uni par mode de déploiement

      • Cloud

    • Logiciel de partage de fichiers au Royaume-Uni par utilisateur final

      • Entreprises

      • Individuel

    • Logiciel de partage de fichiers au Royaume-Uni par secteur

      • Santé

      • Média et divertissement

      • Gouvernement

    • Perspectives de l'ITALIE (milliards USD, 2018-2032)

    • Logiciel de partage de fichiers en ITALIE par type

      • Client-Serveur

      • Pair à pair

    • Logiciel de partage de fichiers en ITALIE par mode de déploiement

      • Cloud

    • Logiciel de partage de fichiers en ITALIE par utilisateur final

      • Entreprises

      • Individuel

    • Logiciel de partage de fichiers en ITALIE par secteur

      • Santé

      • Média et divertissement

      • Gouvernement

    • Perspectives de l'ESPAGNE (milliards USD, 2018-2032)

    • Logiciel de partage de fichiers en Espagne par type

      • Client-Serveur

      • Pair à pair

    • Logiciel de partage de fichiers en Espagne par mode de déploiement

      • Cloud

    • Logiciel de partage de fichiers en Espagne par utilisateur final

      • Entreprises

      • Individuel

    • Logiciel de partage de fichiers en Espagne par secteur

      • Santé

      • Média et divertissement

      • Gouvernement

    • Perspectives du reste de l'Europe (milliards USD, 2018-2032)

    • Logiciel de partage de fichiers du reste de l'Europe par type

      • Client-Serveur

      • Pair à pair

    • Logiciel de partage de fichiers du reste de l'Europe par mode de déploiement

      • Cloud

    • Logiciel de partage de fichiers du reste de l'Europe par utilisateur final

      • Entreprises

      • Individuel

    • Logiciel de partage de fichiers du reste de l'Europe par secteur

      • Santé

      • Média et divertissement

      • Gouvernement

  • Perspectives de la région Asie-Pacifique (milliards USD, 2018-2032)

    • Logiciel de partage de fichiers en Asie-Pacifique par type

      • Client-Serveur

      • Pair à pair

    • Logiciel de partage de fichiers en Asie-Pacifique par mode de déploiement

      • Cloud

    • Logiciel de partage de fichiers en Asie-Pacifique par utilisateur final

      • Entreprises

      • Individuel

    • Logiciel de partage de fichiers en Asie-Pacifique par secteur

      • Santé

      • Média et divertissement

      • Gouvernement

    • Perspectives de la Chine (milliards USD, 2018-2032)

    • Logiciel de partage de fichiers en Chine par type

      • Client-Serveur

      • Pair à pair

    • Logiciel de partage de fichiers en Chine par mode de déploiement

      • Cloud

    • Logiciel de partage de fichiers en Chine par utilisateur final

      • Entreprises

      • Individuel

    • Logiciel de partage de fichiers en Chine par secteur

      • Santé

      • Média et divertissement

      • Gouvernement

    • Perspectives du Japon (milliards USD, 2018-2032)

    • Logiciel de partage de fichiers au Japon par type

      • Client-Serveur

      • Pair à pair

    • Logiciel de partage de fichiers au Japon par mode de déploiement

      • Cloud

    • Logiciel de partage de fichiers au Japon par utilisateur final

      • Entreprises

      • Individuel

    • Logiciel de partage de fichiers au Japon par secteur

      • Santé

      • Média et divertissement

      • Gouvernement

    • Perspectives de l'Inde (milliards USD, 2018-2032)

    • Logiciel de partage de fichiers en Inde par type

      • Client-Serveur

      • Pair à pair

    • Logiciel de partage de fichiers en Inde par mode de déploiement

      • Cloud

    • Logiciel de partage de fichiers en Inde par utilisateur final

      • Entreprises

      • Individuel

    • Logiciel de partage de fichiers en Inde par secteur

      • Santé

      • Média et divertissement

      • Gouvernement

    • Perspectives de l'Australie (milliards USD, 2018-2032)

    • Logiciel de partage de fichiers en Australie par type

      • Client-Serveur

      • Pair à pair

    • Logiciel de partage de fichiers en Australie par mode de déploiement

      • Cloud

    • Logiciel de partage de fichiers en Australie par utilisateur final

      • Entreprises

      • Individuel

    • Logiciel de partage de fichiers en Australie par secteur

      • Santé

      • Média et divertissement

      • Gouvernement

    • Perspectives du reste de la région Asie-Pacifique (milliards USD, 2018-2032)

    • Logiciel de partage de fichiers du reste de la région Asie-Pacifique par type

      • Client-Serveur

      • Pair à pair

    • Logiciel de partage de fichiers du reste de la région Asie-Pacifique par mode de déploiement

      • Cloud

    • Logiciel de partage de fichiers du reste de la région Asie-Pacifique par utilisateur final

      • Entreprises

      • Individuel

    • Logiciel de partage de fichiers du reste de la région Asie-Pacifique par secteur

      • Santé

      • Média et divertissement

      • Gouvernement

  • Perspectives du reste du monde (milliards USD, 2018-2032)

    • Logiciel de partage de fichiers du reste du monde par type

      • Client-Serveur

      • Pair à pair

    • Logiciel de partage de fichiers du reste du monde par mode de déploiement

      • Cloud

    • Logiciel de partage de fichiers du reste du monde par utilisateur final

      • Entreprises

      • Individuel

    • Logiciel de partage de fichiers du reste du monde par secteur

      • Santé

      • Média et divertissement

      • Gouvernement

    • Perspectives du Moyen-Orient (milliards USD, 2018-2032)

    • Logiciel de partage de fichiers au Moyen-Orient par type

      • Client-Serveur

      • Pair à pair

    • Logiciel de partage de fichiers au Moyen-Orient par mode de déploiement

      • Cloud

    • Logiciel de partage de fichiers au Moyen-Orient par utilisateur final

      • Entreprises

      • Individuel

    • Logiciel de partage de fichiers au Moyen-Orient par secteur

      • Santé

      • Média et divertissement

      • Gouvernement

    • Perspectives de l'Afrique (milliards USD, 2018-2032)

    • Logiciel de partage de fichiers en Afrique par type

      • Client-Serveur

      • Pair à pair

    • Logiciel de partage de fichiers en Afrique par mode de déploiement

      • Cloud

    • Logiciel de partage de fichiers en Afrique par utilisateur final

      • Entreprises

      • Individuel

    • Logiciel de partage de fichiers en Afrique par secteur

      • Santé

      • Média et divertissement

      • Gouvernement

    • Perspectives de l'Amérique Latine (milliards USD, 2018-2032)

    • Logiciel de partage de fichiers en Amérique Latine par type

      • Client-Serveur

      • Pair à pair

    • Logiciel de partage de fichiers en Amérique Latine par mode de déploiement

      • Cloud

    • Logiciel de partage de fichiers en Amérique Latine par utilisateur final

      • Entreprises

      • Individuel

    • Logiciel de partage de fichiers en Amérique Latine par secteur

      • Santé

      • Média et divertissement

      • Gouvernement

Compare Licence

×
Features License Type
Single User Multiuser License Enterprise User
Price $4,950 $5,950 $7,250
Maximum User Access Limit 1 User Upto 10 Users Unrestricted Access Throughout the Organization
Free Customization
Direct Access to Analyst
Deliverable Format
Platform Access
Discount on Next Purchase 10% 15% 15%
Printable Versions