Request Free Sample ×

Kindly complete the form below to receive a free sample of this Report

* Please use a valid business email

Leading companies partner with us for data-driven Insights

clients tt-cursor
Hero Background

Oil Gas SCADA Market

ID: MRFR/SEM/6453-HCR
128 Pages
Nirmit Biswas
Last Updated: April 06, 2026
Informe de investigación de mercado de SCADA para petróleo y gas: por aplicación (monitoreo de tuberías, monitoreo de producción de petróleo y gas, automatización de refinerías, gestión de distribución), por tipo de implementación (local, en la nube), por componentes (hardware, software, servicios), por uso final (upstream, midstream, downstream) y por región (Norteamérica, Europa, Sudamérica, Asia Pacífico, Medio Oriente y África): pronóstico de la industria hasta 2032.
Download PDF ×

We do not share your information with anyone. However, we may send you emails based on your report interest from time to time. You may contact us at any time to opt-out.

  1. 1 RESUMEN EJECUTIVO
    1. 1.1 Panorama del mercado
    2. 1.2 Hallazgos clave
    3. 1.3 Segmentación del mercado
    4. 1.4 Panorama competitivo
    5. 1.5 Desafíos y oportunidades
    6. 1.6 Perspectivas futuras
  2. 2 INTRODUCCIÓN AL MERCADO
    1. 2.1 Definición
    2. 2.2 Alcance del estudio
      1. 2.2.1 Objetivo de la investigación
      2. 2.2.2 Supuestos
      3. 2.2.3 Limitaciones
  3. 3 METODOLOGÍA DE LA INVESTIGACIÓN
    1. 3.1 Panorama general
    2. 3.2 Minería de datos
    3. 3.3 Investigación secundaria
    4. 3.4 Investigación primaria
      1. 3.4.1 Entrevistas primarias y proceso de recopilación de información
      2. 3.4.2 Desglose de los encuestados primarios
    5. 3.5 Modelo de pronóstico
    6. 3.6 Estimación del tamaño del mercado
      1. 3.6.1 Enfoque ascendente
      2. 3.6.2 Enfoque descendente
    7. 3.7 Triangulación de datos
    8. 3.8 Validación
  4. 4 DINÁMICA DEL MERCADO
    1. 4.1 Visión general
    2. 4.2 Factores impulsores
    3. 4.3 Limitaciones
    4. 4.4 Oportunidades
  5. 5 ANÁLISIS DE FACTORES DE MERCADO
    1. 5.1 Análisis de la cadena de valor
    2. 5.2 Análisis de las cinco fuerzas de Porter
      1. 5.2.1 Poder de negociación de los proveedores
      2. 5.2.2 Poder de negociación de los compradores
      3. 5.2.3 Amenaza de nuevos competidores
      4. 5.2.4 Amenaza de sustitutos
      5. 5.2.5 Intensidad de la rivalidad
    3. 5.3 Análisis del impacto de la COVID-19
      1. 5.3.1 Análisis del impacto en el mercado
      2. 5.3.2 Impacto regional
      3. 5.3.3 Análisis de oportunidades y amenazas
  6. 6 MERCADO DE SCADA DE PETRÓLEO Y GAS, POR APLICACIÓN (MILES DE MILLONES DE USD)
    1. 6.1 Monitoreo de ductos
    2. 6.2 Monitoreo de la producción de petróleo y gas
    3. 6.3 Automatización de refinerías
    4. 6.4 Gestión de la distribución
  7. 7 MERCADO DE SCADA DE PETRÓLEO Y GAS, POR TIPO DE IMPLEMENTACIÓN (MILES DE MILLONES DE USD)
    1. 7.1 Local
    2. 7.2 Basado en la nube
  8. 8 MERCADO DE SCADA DE PETRÓLEO Y GAS, POR COMPONENTES (MILES DE MILLONES DE USD)
    1. 8.1 Hardware
    2. 8.2 Software
    3. 8.3 Servicios
  9. 9 MERCADO DE SCADA DE PETRÓLEO Y GAS MERCADO DE SCADA DE GAS, POR USO FINAL (MILES DE USD)
    1. 9.1 Upstream
    2. 9.2 Midstream
    3. 9.3 Downstream
  10. 10 MERCADO DE SCADA DE PETRÓLEO Y GAS, POR REGION (MILES DE USD)
    1. 10.1 Norteamérica
      1. 10.1.1 EE. UU.
      2. 10.1.2 Canadá
    2. 10.2 Europa
      1. 10.2.1 Alemania
      2. 10.2.2 Reino Unido
      3. 10.2.3 Francia
      4. 10.2.4 Rusia
      5. 10.2.5 Italia
      6. 10.2.6 España
      7. 10.2.7 Resto de Europa
    3. 10.3 Asia-Pacífico
      1. 10.3.1 China
      2. 10.3.2 India
      3. 10.3.3 Japón
      4. 10.3.4 Corea del Sur
      5. 10.3.5 Malasia
      6. 10.3.6 Tailandia
      7. 10.3.7 Indonesia
      8. 10.3.8 Resto de Asia-Pacífico
    4. 10.4 Sudamérica
      1. 10.4.1 Brasil
      2. 10.4.2 México
      3. 10.4.3 Argentina
      4. 10.4.4 Resto de Sudamérica
    5. 10.5 Oriente Medio y África
      1. 10.5.1 Países del CCG
      2. 10.5.2 Sudáfrica
      3. 10.5.3 Resto de Oriente Medio y África
  11. 11 PANORAMA COMPETITIVO
    1. 11.1 Visión general
    2. 11.2 Análisis competitivo
    3. 11.3 Análisis de la cuota de mercado
    4. 11.4 Estrategia de crecimiento clave en el mercado SCADA de petróleo y gas
    5. 11.5 Análisis comparativo competitivo
    6. 11.6 Principales actores en términos de número de desarrollos en el mercado SCADA de petróleo y gas
    7. 11.7 Desarrollos clave y estrategias de crecimiento
      1. 11.7.1 Lanzamiento de nuevos productos/implementación de servicios
      2. 11.7.2 Fusiones y adquisiciones
      3. 11.7.3 Empresas conjuntas
    8. 11.8 Matriz financiera de los principales actores
      1. 11.8.1 Ventas e ingresos operativos
      2. 11.8.2 Gasto en I+D de los principales actores. 2023
  12. 12 PERFILES DE EMPRESAS
    1. 12.1 Indra Sistemas
      1. 12.1.1 Resumen financiero
      2. 12.1.2 Productos ofrecidos
      3. 12.1.3 Desarrollos clave
      4. 12.1.4 Análisis FODA
      5. 12.1.5 Estrategias clave
    2. 12.2 Siemens
      1. 12.2.1 Panorama financiero
      2. 12.2.2 Productos ofrecidos
      3. 12.2.3 Desarrollos clave
      4. 12.2.4 Análisis FODA
      5. 12.2.5 Estrategias clave
    3. 12.3 HCL Technologies
      1. 12.3.1 Panorama financiero
      2. 12.3.2 Productos ofrecidos
      3. 12.3.3 Desarrollos clave
      4. 12.3.4 Análisis FODA
      5. 12.3.5 Estrategias clave
    4. 12.4 AeroVironment
      1. 12.4.1 Panorama financiero
      2. 12.4.2 Productos ofrecidos
      3. 12.4.3 Desarrollos clave
      4. 12.4.4 Análisis FODA
      5. 12.4.5 Estrategias clave
    5. 12.5 Rockwell Automation
      1. 12.5.1 Panorama financiero
      2. 12.5.2 Productos ofrecidos
      3. 12.5.3 Desarrollos clave
      4. 12.5.4 Análisis FODA
      5. 12.5.5 Estrategias clave
    6. 12.6 Schneider Electric
      1. 12.6.1 Panorama financiero
      2. 12.6.2 Productos ofrecidos
      3. 12.6.3 Desarrollos clave
      4. 12.6.4 Análisis FODA
      5. 12.6.5 Estrategias clave
    7. 12.7 ABB
      1. 12.7.1 Panorama financiero
      2. 12.7.2 Productos ofrecidos
      3. 12.7.3 Desarrollos clave
      4. 12.7.4 Análisis FODA
      5. 12.7.5 Estrategias clave
    8. 12.8 GE Digital
      1. 12.8.1 Panorama financiero
      2. 12.8.2 Productos ofrecidos
      3. 12.8.3 Desarrollos clave
      4. 12.8.4 Análisis FODA
      5. 12.8.5 Estrategias clave
    9. 12.9 Yokogawa Electric
      1. 12.9.1 Panorama financiero
      2. 12.9.2 Productos ofrecidos
      3. 12.9.3 Desarrollos clave
      4. 12.9.4 Análisis FODA
      5. 12.9.5 Estrategias clave
    10. 12.10 McKinsey and Company
      1. 12.10.1 Panorama financiero
      2. 12.10.2 Productos ofrecidos
      3. 12.10.3 Desarrollos clave
      4. 12.10.4 Análisis FODA
      5. 12.10.5 Estrategias clave
    11. 12.11 KPMG
      1. 12.11.1 Panorama financiero
      2. 12.11.2 Productos ofrecidos
      3. 12.11.3 Desarrollos clave
      4. 12.11.4 Análisis FODA
      5. 12.11.5 Estrategias clave
    12. 12.12 Emerson
      1. 12.12.1 Panorama financiero
      2. 12.12.2 Productos ofrecidos
      3. 12.12.3 Desarrollos clave
      4. 12.12.4 Análisis FODA
      5. 12.12.5 Estrategias clave
    13. 12.13 Endress+Hauser
      1. 12.13.1 Panorama financiero
      2. 12.13.2 Productos ofrecidos
      3. 12.13.3 Desarrollos clave
      4. 12.13.4 Análisis FODA
      5. 12.13.5 Estrategias clave
    14. 12.14 Honeywell
      1. 12.14.1 Panorama financiero
      2. 12.14.2 Productos ofrecidos
      3. 12.14.3 Desarrollos clave
      4. 12.14.4 Análisis FODA
      5. 12.14.5 Estrategias clave
  13. 13 APÉNDICE
    1. 13.1 Referencias
    2. 13.2 Informes relacionados
    3. LISTA DE TABLAS
    4. TABLA 1. LISTA DE SUPUESTOS
    5. TABLA 2. ESTIMACIONES Y PRONÓSTICOS DEL TAMAÑO DEL MERCADO DE PETRÓLEO Y GAS SCADA EN AMÉRICA DEL NORTE, POR APLICACIÓN, 2019-2032 (MILES DE MILLONES DE USD)
    6. TABLA 3. ESTIMACIONES Y PRONÓSTICOS DEL TAMAÑO DEL MERCADO DE PETRÓLEO Y GAS SCADA EN AMÉRICA DEL NORTE PRONÓSTICO, POR TIPO DE IMPLEMENTACIÓN, 2019-2032 (MILES DE MILLONES DE USD)
    7. TABLA 4. ESTIMACIONES Y PRONÓSTICOS DEL TAMAÑO DEL MERCADO SCADA DE PETRÓLEO Y GAS DE AMÉRICA DEL NORTE, POR COMPONENTES, 2019-2032 (MILES DE MILLONES DE USD)
    8. TABLA 5. ESTIMACIONES Y PRONÓSTICOS DEL TAMAÑO DEL MERCADO SCADA DE PETRÓLEO Y GAS DE AMÉRICA DEL NORTE, POR USO FINAL, 2019-2032 (MILES DE MILLONES DE USD)
    9. TABLA 6. ESTIMACIONES Y PRONÓSTICOS DEL TAMAÑO DEL MERCADO SCADA DE PETRÓLEO Y GAS DE AMÉRICA DEL NORTE, POR REGION, 2019-2032 (MILES DE MILLONES DE USD)
    10. TABLA 7. ESTIMACIONES Y PRONÓSTICOS DEL TAMAÑO DEL MERCADO SCADA DE PETRÓLEO Y GAS DE EE. UU. PRONÓSTICO, POR APLICACIÓN, 2019-2032 (MILES DE MILLONES DE USD)
    11. TABLA 8. ESTIMACIONES Y PRONÓSTICOS DEL TAMAÑO DEL MERCADO SCADA DE PETRÓLEO Y GAS DE EE. UU., POR TIPO DE IMPLEMENTACIÓN, 2019-2032 (MILES DE MILLONES DE USD)
    12. TABLA 9. ESTIMACIONES Y PRONÓSTICOS DEL TAMAÑO DEL MERCADO SCADA DE PETRÓLEO Y GAS DE EE. UU., POR COMPONENTES, 2019-2032 (MILES DE MILLONES DE USD)
    13. TABLA 10. ESTIMACIONES Y PRONÓSTICOS DEL TAMAÑO DEL MERCADO SCADA DE PETRÓLEO Y GAS DE EE. UU., POR USO FINAL, 2019-2032 (MILES DE MILLONES DE USD)
    14. TABLA 11. ESTIMACIONES Y PRONÓSTICOS DEL TAMAÑO DEL MERCADO SCADA DE PETRÓLEO Y GAS DE EE. UU. PRONÓSTICO, POR REGION, 2019-2032 (MILES DE MILLONES DE USD)
    15. TABLA 12. ESTIMACIONES Y PRONÓSTICOS DEL TAMAÑO DEL MERCADO SCADA DE PETRÓLEO Y GAS DE CANADÁ, POR APLICACIÓN, 2019-2032 (MILES DE MILLONES DE USD)
    16. TABLA 13. ESTIMACIONES Y PRONÓSTICOS DEL TAMAÑO DEL MERCADO SCADA DE PETRÓLEO Y GAS DE CANADÁ, POR TIPO DE IMPLEMENTACIÓN, 2019-2032 (MILES DE MILLONES DE USD)
    17. TABLA 14. ESTIMACIONES Y PRONÓSTICOS DEL TAMAÑO DEL MERCADO SCADA DE PETRÓLEO Y GAS DE CANADÁ, POR COMPONENTES, 2019-2032 (MILES DE MILLONES DE USD)
    18. TABLA 15. ESTIMACIONES Y PRONÓSTICOS DEL TAMAÑO DEL MERCADO SCADA DE PETRÓLEO Y GAS DE CANADÁ PRONÓSTICO, POR USO FINAL, 2019-2032 (MILES DE MILLONES DE USD)
    19. TABLA 16. ESTIMACIONES Y PRONÓSTICOS DEL TAMAÑO DEL MERCADO SCADA DE PETRÓLEO Y GAS DE CANADÁ, POR REGION, 2019-2032 (MILES DE MILLONES DE USD)
    20. TABLA 17. ESTIMACIONES Y PRONÓSTICOS DEL TAMAÑO DEL MERCADO SCADA DE PETRÓLEO Y GAS DE EUROPA, POR APLICACIÓN, 2019-2032 (MILES DE MILLONES DE USD)
    21. TABLA 18. ESTIMACIONES Y PRONÓSTICOS DEL TAMAÑO DEL MERCADO SCADA DE PETRÓLEO Y GAS DE EUROPA, POR TIPO DE IMPLEMENTACIÓN, 2019-2032 (MILES DE MILLONES DE USD)
    22. TABLA 19. ESTIMACIONES Y PRONÓSTICOS DEL TAMAÑO DEL MERCADO SCADA DE PETRÓLEO Y GAS DE EUROPA PRONÓSTICO, POR COMPONENTES, 2019-2032 (MILES DE MILLONES DE USD)
    23. TABLA 20. ESTIMACIONES Y PRONÓSTICOS DEL TAMAÑO DEL MERCADO SCADA DE PETRÓLEO Y GAS EN EUROPA, POR USO FINAL, 2019-2032 (MILES DE MILLONES DE USD)
    24. TABLA 21. ESTIMACIONES Y PRONÓSTICOS DEL TAMAÑO DEL MERCADO SCADA DE PETRÓLEO Y GAS EN EUROPA, POR REGION, 2019-2032 (MILES DE MILLONES DE USD)
    25. TABLA 22. ESTIMACIONES Y PRONÓSTICOS DEL TAMAÑO DEL MERCADO SCADA DE PETRÓLEO Y GAS EN ALEMANIA, POR APLICACIÓN, 2019-2032 (MILES DE MILLONES DE USD)
    26. TABLA 23. ESTIMACIONES Y PRONÓSTICOS DEL TAMAÑO DEL MERCADO SCADA DE PETRÓLEO Y GAS EN ALEMANIA PRONÓSTICO, POR TIPO DE IMPLEMENTACIÓN, 2019-2032 (MILES DE MILLONES DE USD)
    27. TABLA 24. ESTIMACIONES Y PRONÓSTICOS DEL TAMAÑO DEL MERCADO SCADA DE PETRÓLEO Y GAS DE ALEMANIA, POR COMPONENTES, 2019-2032 (MILES DE MILLONES DE USD)
    28. TABLA 25. ESTIMACIONES Y PRONÓSTICOS DEL TAMAÑO DEL MERCADO SCADA DE PETRÓLEO Y GAS DE ALEMANIA, POR USO FINAL, 2019-2032 (MILES DE MILLONES DE USD)
    29. TABLA 26. ESTIMACIONES Y PRONÓSTICOS DEL TAMAÑO DEL MERCADO SCADA DE PETRÓLEO Y GAS DE ALEMANIA, POR REGION, 2019-2032 (MILES DE MILLONES DE USD)
    30. TABLA 27. ESTIMACIONES Y PRONÓSTICOS DEL TAMAÑO DEL MERCADO SCADA DE PETRÓLEO Y GAS DEL REINO UNIDO PRONÓSTICO, POR APLICACIÓN, 2019-2032 (MILES DE MILLONES DE USD)
    31. TABLA 28. ESTIMACIONES Y PRONÓSTICOS DEL TAMAÑO DEL MERCADO SCADA DE PETRÓLEO Y GAS DEL REINO UNIDO, POR TIPO DE IMPLEMENTACIÓN, 2019-2032 (MILES DE MILLONES DE USD)
    32. TABLA 29. ESTIMACIONES Y PRONÓSTICOS DEL TAMAÑO DEL MERCADO SCADA DE PETRÓLEO Y GAS DEL REINO UNIDO, POR COMPONENTES, 2019-2032 (MILES DE MILLONES DE USD)
    33. TABLA 30. ESTIMACIONES Y PRONÓSTICOS DEL TAMAÑO DEL MERCADO SCADA DE PETRÓLEO Y GAS DEL REINO UNIDO, POR USO FINAL, 2019-2032 (MILES DE MILLONES DE USD)
    34. TABLA 31. ESTIMACIONES Y PRONÓSTICOS DEL TAMAÑO DEL MERCADO SCADA DE PETRÓLEO Y GAS DEL REINO UNIDO PRONÓSTICO, POR REGION, 2019-2032 (MILES DE MILLONES DE USD)
    35. TABLA 32. ESTIMACIONES Y PRONÓSTICOS DEL TAMAÑO DEL MERCADO SCADA DE PETRÓLEO Y GAS DE FRANCIA, POR APLICACIÓN, 2019-2032 (MILES DE MILLONES DE USD)
    36. TABLA 33. ESTIMACIONES Y PRONÓSTICOS DEL TAMAÑO DEL MERCADO SCADA DE PETRÓLEO Y GAS DE FRANCIA, POR TIPO DE IMPLEMENTACIÓN, 2019-2032 (MILES DE MILLONES DE USD)
    37. TABLA 34. ESTIMACIONES Y PRONÓSTICOS DEL TAMAÑO DEL MERCADO SCADA DE PETRÓLEO Y GAS DE FRANCIA, POR COMPONENTES, 2019-2032 (MILES DE MILLONES DE USD)
    38. TABLA 35. ESTIMACIONES Y PRONÓSTICOS DEL TAMAÑO DEL MERCADO SCADA DE PETRÓLEO Y GAS DE FRANCIA PRONÓSTICO, POR USO FINAL, 2019-2032 (MILES DE MILLONES DE USD)
    39. TABLA 36. ESTIMACIONES Y PRONÓSTICOS DEL TAMAÑO DEL MERCADO SCADA DE PETRÓLEO Y GAS DE FRANCIA, POR REGION, 2019-2032 (MILES DE MILLONES DE USD)
    40. TABLA 37. ESTIMACIONES Y PRONÓSTICOS DEL TAMAÑO DEL MERCADO SCADA DE PETRÓLEO Y GAS DE RUSIA, POR APLICACIÓN, 2019-2032 (MILES DE MILLONES DE USD)
    41. TABLA 38. ESTIMACIONES Y PRONÓSTICOS DEL TAMAÑO DEL MERCADO SCADA DE PETRÓLEO Y GAS DE RUSIA, POR TIPO DE IMPLEMENTACIÓN, 2019-2032 (MILES DE MILLONES DE USD)
    42. TABLA 39. ESTIMACIONES Y PRONÓSTICOS DEL TAMAÑO DEL MERCADO SCADA DE PETRÓLEO Y GAS DE RUSIA PRONÓSTICO, POR COMPONENTES, 2019-2032 (MILES DE MILLONES DE USD)
    43. TABLA 40. ESTIMACIONES Y PRONÓSTICOS DEL TAMAÑO DEL MERCADO SCADA DE PETRÓLEO Y GAS DE RUSIA, POR USO FINAL, 2019-2032 (MILES DE MILLONES DE USD)
    44. TABLA 41. ESTIMACIONES Y PRONÓSTICOS DEL TAMAÑO DEL MERCADO SCADA DE PETRÓLEO Y GAS DE RUSIA, POR REGION, 2019-2032 (MILES DE MILLONES DE USD)
    45. TABLA 42. ESTIMACIONES Y PRONÓSTICOS DEL TAMAÑO DEL MERCADO SCADA DE PETRÓLEO Y GAS DE ITALIA, POR APLICACIÓN, 2019-2032 (MILES DE MILLONES DE USD)
    46. TABLA 43. ESTIMACIONES Y PRONÓSTICOS DEL TAMAÑO DEL MERCADO SCADA DE PETRÓLEO Y GAS DE ITALIA, PRONÓSTICO, POR TIPO DE IMPLEMENTACIÓN, 2019-2032 (MILES DE MILLONES DE USD)
    47. TABLA 44. ESTIMACIONES Y PRONÓSTICOS DEL TAMAÑO DEL MERCADO SCADA DE PETRÓLEO Y GAS DE ITALIA, POR COMPONENTES, 2019-2032 (MILES DE MILLONES DE USD)
    48. TABLA 45. ESTIMACIONES Y PRONÓSTICOS DEL TAMAÑO DEL MERCADO SCADA DE PETRÓLEO Y GAS DE ITALIA, POR USO FINAL, 2019-2032 (MILES DE MILLONES DE USD)
    49. TABLA 46. ESTIMACIONES Y PRONÓSTICOS DEL TAMAÑO DEL MERCADO SCADA DE PETRÓLEO Y GAS DE ITALIA, POR REGION, 2019-2032 (MILES DE MILLONES DE USD)
    50. TABLA 47. ESTIMACIONES Y PRONÓSTICOS DEL TAMAÑO DEL MERCADO SCADA DE PETRÓLEO Y GAS DE ESPAÑA PRONÓSTICO, POR APLICACIÓN, 2019-2032 (MILES DE MILLONES DE USD)
    51. TABLA 48. ESTIMACIONES Y PRONÓSTICOS DEL TAMAÑO DEL MERCADO SCADA DE PETRÓLEO Y GAS DE ESPAÑA, POR TIPO DE IMPLEMENTACIÓN, 2019-2032 (MILES DE MILLONES DE USD)
    52. TABLA 49. ESTIMACIONES Y PRONÓSTICOS DEL TAMAÑO DEL MERCADO SCADA DE PETRÓLEO Y GAS DE ESPAÑA, POR COMPONENTES, 2019-2032 (MILES DE MILLONES DE USD)
    53. TABLA 50. ESTIMACIONES Y PRONÓSTICOS DEL TAMAÑO DEL MERCADO SCADA DE PETRÓLEO Y GAS DE ESPAÑA, POR USO FINAL, 2019-2032 (MILES DE MILLONES DE USD)
    54. TABLA 51. ESTIMACIONES Y PRONÓSTICOS DEL TAMAÑO DEL MERCADO SCADA DE PETRÓLEO Y GAS DE ESPAÑA PRONÓSTICO POR REGION, 2019-2032 (MILES DE MILLONES DE USD)
    55. TABLA 52. ESTIMACIONES Y PRONÓSTICOS DEL TAMAÑO DEL MERCADO SCADA DE PETRÓLEO Y GAS EN EL RESTO DE EUROPA, POR APLICACIÓN, 2019-2032 (MILES DE MILLONES DE USD)
    56. TABLA 53. ESTIMACIONES Y PRONÓSTICOS DEL TAMAÑO DEL MERCADO SCADA DE PETRÓLEO Y GAS EN EL RESTO DE EUROPA, POR TIPO DE IMPLEMENTACIÓN, 2019-2032 (MILES DE MILLONES DE USD)
    57. TABLA 54. ESTIMACIONES Y PRONÓSTICOS DEL TAMAÑO DEL MERCADO SCADA DE PETRÓLEO Y GAS EN EL RESTO DE EUROPA, POR COMPONENTES, 2019-2032 (MILES DE MILLONES DE USD)
    58. TABLA 55. ESTIMACIONES Y PRONÓSTICOS DEL TAMAÑO DEL MERCADO SCADA DE PETRÓLEO Y GAS DEL RESTO DE EUROPA, POR USO FINAL, 2019-2032 (MILES DE MILLONES DE USD)
    59. TABLA 56. ESTIMACIONES Y PRONÓSTICOS DEL TAMAÑO DEL MERCADO SCADA DE PETRÓLEO Y GAS DEL RESTO DE EUROPA, POR REGION, 2019-2032 (MILES DE MILLONES DE USD)
    60. TABLA 57. ESTIMACIONES Y PRONÓSTICOS DEL TAMAÑO DEL MERCADO SCADA DE PETRÓLEO Y GAS DE APAC, POR APLICACIÓN, 2019-2032 (MILES DE MILLONES DE USD)
    61. TABLA 58. ESTIMACIONES Y PRONÓSTICOS DEL TAMAÑO DEL MERCADO SCADA DE PETRÓLEO Y GAS DE APAC, PRONÓSTICO, POR TIPO DE IMPLEMENTACIÓN, 2019-2032 (MILES DE MILLONES DE USD)
    62. TABLA 59. ESTIMACIONES Y PRONÓSTICOS DEL TAMAÑO DEL MERCADO SCADA DE PETRÓLEO Y GAS DE APAC, POR COMPONENTES, 2019-2032 (MILES DE MILLONES DE USD)
    63. TABLA 60. ESTIMACIONES Y PRONÓSTICOS DEL TAMAÑO DEL MERCADO SCADA DE PETRÓLEO Y GAS DE APAC, POR USO FINAL, 2019-2032 (MILES DE MILLONES DE USD)
    64. TABLA 61. ESTIMACIONES Y PRONÓSTICOS DEL TAMAÑO DEL MERCADO SCADA DE PETRÓLEO Y GAS DE APAC, POR REGION, 2019-2032 (MILES DE MILLONES DE USD)
    65. TABLA 62. ESTIMACIONES Y PRONÓSTICOS DEL TAMAÑO DEL MERCADO SCADA DE PETRÓLEO Y GAS DE CHINA PRONÓSTICO, POR APLICACIÓN, 2019-2032 (MILES DE MILLONES DE USD)
    66. TABLA 63. ESTIMACIONES Y PRONÓSTICOS DEL TAMAÑO DEL MERCADO SCADA DE PETRÓLEO Y GAS DE CHINA, POR TIPO DE IMPLEMENTACIÓN, 2019-2032 (MILES DE MILLONES DE USD)
    67. TABLA 64. ESTIMACIONES Y PRONÓSTICOS DEL TAMAÑO DEL MERCADO SCADA DE PETRÓLEO Y GAS DE CHINA, POR COMPONENTES, 2019-2032 (MILES DE MILLONES DE USD)
    68. TABLA 65. ESTIMACIONES Y PRONÓSTICOS DEL TAMAÑO DEL MERCADO SCADA DE PETRÓLEO Y GAS DE CHINA, POR USO FINAL, 2019-2032 (MILES DE MILLONES DE USD)
    69. TABLA 66. ESTIMACIONES Y PRONÓSTICOS DEL TAMAÑO DEL MERCADO SCADA DE PETRÓLEO Y GAS DE CHINA PRONÓSTICO, POR REGION, 2019-2032 (MILES DE MILLONES DE USD)
    70. TABLA 67. ESTIMACIONES Y PRONÓSTICOS DEL TAMAÑO DEL MERCADO SCADA DE PETRÓLEO Y GAS DE LA INDIA, POR APLICACIÓN, 2019-2032 (MILES DE MILLONES DE USD)
    71. TABLA 68. ESTIMACIONES Y PRONÓSTICOS DEL TAMAÑO DEL MERCADO SCADA DE PETRÓLEO Y GAS DE LA INDIA, POR TIPO DE IMPLEMENTACIÓN, 2019-2032 (MILES DE MILLONES DE USD)
    72. TABLA 69. ESTIMACIONES Y PRONÓSTICOS DEL TAMAÑO DEL MERCADO SCADA DE PETRÓLEO Y GAS DE LA INDIA, POR COMPONENTES, 2019-2032 (MILES DE MILLONES DE USD)
    73. TABLA 70. ESTIMACIONES Y PRONÓSTICOS DEL TAMAÑO DEL MERCADO SCADA DE PETRÓLEO Y GAS DE LA INDIA PRONÓSTICO, POR USO FINAL, 2019-2032 (MILES DE MILLONES DE USD)
    74. TABLA 71. ESTIMACIONES Y PRONÓSTICOS DEL TAMAÑO DEL MERCADO SCADA DE PETRÓLEO Y GAS DE LA INDIA, POR REGION, 2019-2032 (MILES DE MILLONES DE USD)
    75. TABLA 72. ESTIMACIONES Y PRONÓSTICOS DEL TAMAÑO DEL MERCADO SCADA DE PETRÓLEO Y GAS DE JAPÓN, POR APLICACIÓN, 2019-2032 (MILES DE MILLONES DE USD)
    76. TABLA 73. ESTIMACIONES Y PRONÓSTICOS DEL TAMAÑO DEL MERCADO SCADA DE PETRÓLEO Y GAS DE JAPÓN, POR TIPO DE IMPLEMENTACIÓN, 2019-2032 (MILES DE MILLONES DE USD)
    77. TABLA 74. ESTIMACIONES Y PRONÓSTICOS DEL TAMAÑO DEL MERCADO SCADA DE PETRÓLEO Y GAS DE JAPÓN PRONÓSTICO, POR COMPONENTES, 2019-2032 (MILES DE MILLONES DE USD)
    78. TABLA 75. ESTIMACIONES Y PRONÓSTICOS DEL TAMAÑO DEL MERCADO SCADA DE PETRÓLEO Y GAS DE JAPÓN, POR USO FINAL, 2019-2032 (MILES DE MILLONES DE USD)
    79. TABLA 76. ESTIMACIONES Y PRONÓSTICOS DEL TAMAÑO DEL MERCADO SCADA DE PETRÓLEO Y GAS DE JAPÓN, POR REGION, 2019-2032 (MILES DE MILLONES DE USD)
    80. TABLA 77. ESTIMACIONES Y PRONÓSTICOS DEL TAMAÑO DEL MERCADO SCADA DE PETRÓLEO Y GAS DE COREA DEL SUR, POR APLICACIÓN, 2019-2032 (MILES DE MILLONES DE USD)
    81. TABLA 78. ESTIMACIONES Y PRONÓSTICOS DEL TAMAÑO DEL MERCADO SCADA DE PETRÓLEO Y GAS DE COREA DEL SUR PRONÓSTICO, POR TIPO DE IMPLEMENTACIÓN, 2019-2032 (MILES DE MILLONES DE USD)
    82. TABLA 79. ESTIMACIONES Y PRONÓSTICOS DEL TAMAÑO DEL MERCADO SCADA DE PETRÓLEO Y GAS DE COREA DEL SUR, POR COMPONENTES, 2019-2032 (MILES DE MILLONES DE USD)
    83. TABLA 80. ESTIMACIONES Y PRONÓSTICOS DEL TAMAÑO DEL MERCADO SCADA DE PETRÓLEO Y GAS DE COREA DEL SUR, POR USO FINAL, 2019-2032 (MILES DE MILLONES DE USD)
    84. TABLA 81. ESTIMACIONES Y PRONÓSTICOS DEL TAMAÑO DEL MERCADO SCADA DE PETRÓLEO Y GAS DE COREA DEL SUR, POR REGION, 2019-2032 (MILES DE MILLONES DE USD)
    85. TABLA 82. ESTIMACIONES Y PRONÓSTICOS DEL TAMAÑO DEL MERCADO SCADA DE PETRÓLEO Y GAS DE MALASIA PRONÓSTICO, POR APLICACIÓN, 2019-2032 (MILES DE MILLONES DE USD)
    86. TABLA 83. ESTIMACIONES Y PRONÓSTICOS DEL TAMAÑO DEL MERCADO SCADA DE PETRÓLEO Y GAS DE MALASIA, POR TIPO DE IMPLEMENTACIÓN, 2019-2032 (MILES DE MILLONES DE USD)
    87. TABLA 84. ESTIMACIONES Y PRONÓSTICOS DEL TAMAÑO DEL MERCADO SCADA DE PETRÓLEO Y GAS DE MALASIA, POR COMPONENTES, 2019-2032 (MILES DE MILLONES DE USD)
    88. TABLA 85. ESTIMACIONES Y PRONÓSTICOS DEL TAMAÑO DEL MERCADO SCADA DE PETRÓLEO Y GAS DE MALASIA, POR USO FINAL, 2019-2032 (MILES DE MILLONES DE USD)
    89. TABLA 86. ESTIMACIONES Y PRONÓSTICOS DEL TAMAÑO DEL MERCADO SCADA DE PETRÓLEO Y GAS DE MALASIA, PRONÓSTICO, POR REGION, 2019-2032 (MILES DE MILLONES DE USD)
    90. TABLA 87. ESTIMACIONES Y PRONÓSTICOS DEL TAMAÑO DEL MERCADO SCADA DE PETRÓLEO Y GAS DE TAILANDIA, POR APLICACIÓN, 2019-2032 (MILES DE MILLONES DE USD)
    91. TABLA 88. ESTIMACIONES Y PRONÓSTICOS DEL TAMAÑO DEL MERCADO SCADA DE PETRÓLEO Y GAS DE TAILANDIA, POR TIPO DE IMPLEMENTACIÓN, 2019-2032 (MILES DE MILLONES DE USD)
    92. TABLA 89. ESTIMACIONES Y PRONÓSTICOS DEL TAMAÑO DEL MERCADO SCADA DE PETRÓLEO Y GAS DE TAILANDIA, POR COMPONENTES, 2019-2032 (MILES DE MILLONES DE USD)
    93. TABLA 90. ESTIMACIONES Y PRONÓSTICOS DEL TAMAÑO DEL MERCADO SCADA DE PETRÓLEO Y GAS DE TAILANDIA PRONÓSTICO, POR USO FINAL, 2019-2032 (MILES DE MILLONES DE USD)
    94. TABLA 91. ESTIMACIONES Y PRONÓSTICOS DEL TAMAÑO DEL MERCADO SCADA DE PETRÓLEO Y GAS DE TAILANDIA, POR REGION, 2019-2032 (MILES DE MILLONES DE USD)
    95. TABLA 92. ESTIMACIONES Y PRONÓSTICOS DEL TAMAÑO DEL MERCADO SCADA DE PETRÓLEO Y GAS DE INDONESIA, POR APLICACIÓN, 2019-2032 (MILES DE MILLONES DE USD)
    96. TABLA 93. ESTIMACIONES Y PRONÓSTICOS DEL TAMAÑO DEL MERCADO SCADA DE PETRÓLEO Y GAS DE INDONESIA, POR TIPO DE IMPLEMENTACIÓN, 2019-2032 (MILES DE MILLONES DE USD)
    97. TABLA 94. ESTIMACIONES Y PRONÓSTICOS DEL TAMAÑO DEL MERCADO SCADA DE PETRÓLEO Y GAS DE INDONESIA PRONÓSTICO, POR COMPONENTES, 2019-2032 (MILES DE MILLONES DE USD)
    98. TABLA 95. ESTIMACIONES Y PRONÓSTICOS DEL TAMAÑO DEL MERCADO SCADA DE PETRÓLEO Y GAS DE INDONESIA, POR USO FINAL, 2019-2032 (MILES DE MILLONES DE USD)
    99. TABLA 96. ESTIMACIONES Y PRONÓSTICOS DEL TAMAÑO DEL MERCADO SCADA DE PETRÓLEO Y GAS DE INDONESIA, POR REGION, 2019-2032 (MILES DE MILLONES DE USD)
    100. TABLA 97. ESTIMACIONES Y PRONÓSTICOS DEL TAMAÑO DEL MERCADO SCADA DE PETRÓLEO Y GAS DEL RESTO DE APAC, POR APLICACIÓN, 2019-2032 (MILES DE MILLONES DE USD)
    101. TABLA 98. ESTIMACIONES Y PRONÓSTICOS DEL TAMAÑO DEL MERCADO SCADA DE PETRÓLEO Y GAS DEL RESTO DE APAC PRONÓSTICO, POR TIPO DE IMPLEMENTACIÓN, 2019-2032 (MILES DE MILLONES DE USD)
    102. TABLA 99. RESTO DE LAS ESTIMACIONES Y PRONÓSTICOS DEL TAMAÑO DEL MERCADO SCADA DE PETRÓLEO Y GAS DE APAC, POR COMPONENTES, 2019-2032 (MILES DE MILLONES DE USD)
    103. TABLA 100. RESTO DE LAS ESTIMACIONES Y PRONÓSTICOS DEL TAMAÑO DEL MERCADO SCADA DE PETRÓLEO Y GAS DE APAC, POR USO FINAL, 2019-2032 (MILES DE MILLONES DE USD)
    104. TABLA 101. RESTO DE LAS ESTIMACIONES Y PRONÓSTICOS DEL TAMAÑO DEL MERCADO SCADA DE PETRÓLEO Y GAS DE APAC, POR REGION, 2019-2032 (MILES DE MILLONES DE USD)
    105. TABLA 102. RESTO DE LAS ESTIMACIONES Y PRONÓSTICOS DEL TAMAÑO DEL MERCADO SCADA DE PETRÓLEO Y GAS DE AMÉRICA DEL SUR PRONÓSTICO, POR APLICACIÓN, 2019-2032 (MILES DE MILLONES DE USD)
    106. TABLA 103. ESTIMACIONES Y PRONÓSTICOS DEL TAMAÑO DEL MERCADO SCADA DE PETRÓLEO Y GAS DE SUDAMÉRICA, POR TIPO DE IMPLEMENTACIÓN, 2019-2032 (MILES DE MILLONES DE USD)
    107. TABLA 104. ESTIMACIONES Y PRONÓSTICOS DEL TAMAÑO DEL MERCADO SCADA DE PETRÓLEO Y GAS DE SUDAMÉRICA, POR COMPONENTES, 2019-2032 (MILES DE MILLONES DE USD)
    108. TABLA 105. ESTIMACIONES Y PRONÓSTICOS DEL TAMAÑO DEL MERCADO SCADA DE PETRÓLEO Y GAS DE SUDAMÉRICA, POR USO FINAL, 2019-2032 (MILES DE MILLONES DE USD)
    109. TABLA 106. ESTIMACIONES Y PRONÓSTICOS DEL TAMAÑO DEL MERCADO SCADA DE PETRÓLEO Y GAS DE SUDAMÉRICA, POR USO FINAL, 2019-2032 (MILES DE MILLONES DE USD) ESTIMACIONES Y PRONÓSTICOS DEL TAMAÑO DEL MERCADO SCADA DE GAS, POR REGION, 2019-2032 (MILES DE MILLONES DE USD)
    110. TABLA 107. ESTIMACIONES Y PRONÓSTICOS DEL TAMAÑO DEL MERCADO SCADA DE PETRÓLEO Y GAS DE BRASIL, POR APLICACIÓN, 2019-2032 (MILES DE MILLONES DE USD)
    111. TABLA 108. ESTIMACIONES Y PRONÓSTICOS DEL TAMAÑO DEL MERCADO SCADA DE PETRÓLEO Y GAS DE BRASIL, POR TIPO DE IMPLEMENTACIÓN, 2019-2032 (MILES DE MILLONES DE USD)
    112. TABLA 109. ESTIMACIONES Y PRONÓSTICOS DEL TAMAÑO DEL MERCADO SCADA DE PETRÓLEO Y GAS DE BRASIL, POR COMPONENTES, 2019-2032 (MILES DE MILLONES DE USD)
    113. TABLA 110. ESTIMACIONES Y PRONÓSTICOS DEL TAMAÑO DEL MERCADO SCADA DE PETRÓLEO Y GAS DE BRASIL, POR APLICACIÓN, 2019-2032 (MILES DE MILLONES DE USD) ESTIMACIONES Y PRONÓSTICOS DEL TAMAÑO DEL MERCADO DE SCADA DE GAS, POR USO FINAL, 2019-2032 (MILES DE MILLONES DE USD)
    114. TABLA 111. ESTIMACIONES Y PRONÓSTICOS DEL TAMAÑO DEL MERCADO DE SCADA DE PETRÓLEO Y GAS DE BRASIL, POR REGION, 2019-2032 (MILES DE MILLONES DE USD)
    115. TABLA 112. ESTIMACIONES Y PRONÓSTICOS DEL TAMAÑO DEL MERCADO DE SCADA DE PETRÓLEO Y GAS DE MÉXICO, POR APLICACIÓN, 2019-2032 (MILES DE MILLONES DE USD)
    116. TABLA 113. ESTIMACIONES Y PRONÓSTICOS DEL TAMAÑO DEL MERCADO DE SCADA DE PETRÓLEO Y GAS DE MÉXICO, POR TIPO DE IMPLEMENTACIÓN, 2019-2032 (MILES DE MILLONES DE USD)
    117. TABLA 114. ESTIMACIONES Y PRONÓSTICOS DEL TAMAÑO DEL MERCADO DE SCADA DE GAS, POR COMPONENTES, 2019-2032 (MILES DE MILLONES DE USD)
    118. TABLA 115. ESTIMACIONES Y PRONÓSTICOS DEL TAMAÑO DEL MERCADO DE SCADA DE PETRÓLEO Y GAS DE MÉXICO, POR USO FINAL, 2019-2032 (MILES DE MILLONES DE USD)
    119. TABLA 116. ESTIMACIONES Y PRONÓSTICOS DEL TAMAÑO DEL MERCADO DE SCADA DE PETRÓLEO Y GAS DE MÉXICO, POR REGION, 2019-2032 (MILES DE MILLONES DE USD)
    120. TABLA 117. ESTIMACIONES Y PRONÓSTICOS DEL TAMAÑO DEL MERCADO DE SCADA DE PETRÓLEO Y GAS DE ARGENTINA, POR APLICACIÓN, 2019-2032 (MILES DE MILLONES DE USD)
    121. TABLA 118. ESTIMACIONES Y PRONÓSTICOS DEL TAMAÑO DEL MERCADO DE SCADA DE GAS, POR TIPO DE IMPLEMENTACIÓN, 2019-2032 (MILES DE MILLONES DE USD)
    122. TABLA 119. ESTIMACIONES Y PRONÓSTICOS DEL TAMAÑO DEL MERCADO DE SCADA DE PETRÓLEO Y GAS DE ARGENTINA, POR COMPONENTES, 2019-2032 (MILES DE MILLONES DE USD)
    123. TABLA 120. ESTIMACIONES Y PRONÓSTICOS DEL TAMAÑO DEL MERCADO DE SCADA DE PETRÓLEO Y GAS DE ARGENTINA, POR USO FINAL, 2019-2032 (MILES DE MILLONES DE USD)
    124. TABLA 121. ESTIMACIONES Y PRONÓSTICOS DEL TAMAÑO DEL MERCADO DE SCADA DE PETRÓLEO Y GAS DE ARGENTINA, PRONÓSTICO, POR REGION, 2019-2032 (MILES DE MILLONES DE USD)
    125. TABLA 122. RESTO DE SUDAMÉRICA ESTIMACIONES Y PRONÓSTICOS DEL TAMAÑO DEL MERCADO SCADA DE PETRÓLEO Y GAS, POR APLICACIÓN, 2019-2032 (MILES DE MILLONES DE USD)
    126. TABLA 123. RESTO DE SUDAMÉRICA ESTIMACIONES Y PRONÓSTICOS DEL TAMAÑO DEL MERCADO SCADA DE PETRÓLEO Y GAS, POR TIPO DE IMPLEMENTACIÓN, 2019-2032 (MILES DE MILLONES DE USD)
    127. TABLA 124. RESTO DE SUDAMÉRICA ESTIMACIONES Y PRONÓSTICOS DEL TAMAÑO DEL MERCADO SCADA DE PETRÓLEO Y GAS, POR COMPONENTES, 2019-2032 (MILES DE MILLONES DE USD)
    128. TABLA 125. RESTO DE SUDAMÉRICA ESTIMACIONES Y PRONÓSTICOS DEL TAMAÑO DEL MERCADO SCADA DE PETRÓLEO Y GAS, ESTIMACIONES Y PRONÓSTICOS DEL TAMAÑO DEL MERCADO DE SCADA DE GAS, POR USO FINAL, 2019-2032 (MILES DE MILLONES DE USD)
    129. TABLA 126. RESTO DE AMÉRICA ESTIMACIONES Y PRONÓSTICOS DEL TAMAÑO DEL MERCADO DE SCADA DE PETRÓLEO Y GAS, POR REGION, 2019-2032 (MILES DE MILLONES DE USD)
    130. TABLA 127. ESTIMACIONES Y PRONÓSTICOS DEL TAMAÑO DEL MERCADO DE SCADA DE PETRÓLEO Y GAS DE MEA, POR APLICACIÓN, 2019-2032 (MILES DE MILLONES DE USD)
    131. TABLA 128. ESTIMACIONES Y PRONÓSTICOS DEL TAMAÑO DEL MERCADO DE SCADA DE PETRÓLEO Y GAS DE MEA, POR TIPO DE IMPLEMENTACIÓN, 2019-2032 (MILES DE MILLONES DE USD)
    132. TABLA 129. MEA OIL & ESTIMACIONES Y PRONÓSTICOS DEL TAMAÑO DEL MERCADO DE SCADA DE GAS, POR COMPONENTES, 2019-2032 (MILES DE MILLONES DE USD)
    133. TABLA 130. ESTIMACIONES Y PRONÓSTICOS DEL TAMAÑO DEL MERCADO DE SCADA DE PETRÓLEO Y GAS DE MEA, POR USO FINAL, 2019-2032 (MILES DE MILLONES DE USD)
    134. TABLA 131. ESTIMACIONES Y PRONÓSTICOS DEL TAMAÑO DEL MERCADO DE SCADA DE PETRÓLEO Y GAS DE MEA, POR REGION, 2019-2032 (MILES DE MILLONES DE USD)
    135. TABLA 132. ESTIMACIONES Y PRONÓSTICOS DEL TAMAÑO DEL MERCADO DE SCADA DE PETRÓLEO Y GAS DE LOS PAÍSES DEL CCG, POR APLICACIÓN, 2019-2032 (MILES DE MILLONES DE USD)
    136. TABLA 133. ESTIMACIONES Y PRONÓSTICOS DEL TAMAÑO DEL MERCADO DE SCADA DE PETRÓLEO Y GAS DE LOS PAÍSES DEL CCG ESTIMACIONES Y PRONÓSTICOS DEL TAMAÑO DEL MERCADO DE SCADA DE GAS, POR TIPO DE IMPLEMENTACIÓN, 2019-2032 (MILES DE MILLONES DE USD)
    137. TABLA 134. ESTIMACIONES Y PRONÓSTICOS DEL TAMAÑO DEL MERCADO DE SCADA DE PETRÓLEO Y GAS DE LOS PAÍSES DEL CCG, POR COMPONENTES, 2019-2032 (MILES DE MILLONES DE USD)
    138. TABLA 135. ESTIMACIONES Y PRONÓSTICOS DEL TAMAÑO DEL MERCADO DE SCADA DE PETRÓLEO Y GAS DE LOS PAÍSES DEL CCG, POR USO FINAL, 2019-2032 (MILES DE MILLONES DE USD)
    139. TABLA 136. ESTIMACIONES Y PRONÓSTICOS DEL TAMAÑO DEL MERCADO DE SCADA DE PETRÓLEO Y GAS DE LOS PAÍSES DEL CCG, POR REGION, 2019-2032 (MILES DE MILLONES DE USD)
    140. TABLA 137. SUDÁFRICA PETRÓLEO Y ESTIMACIONES Y PRONÓSTICOS DEL TAMAÑO DEL MERCADO DE SCADA DE GAS, POR APLICACIÓN, 2019-2032 (MILES DE MILLONES DE USD)
    141. TABLA 138. ESTIMACIONES Y PRONÓSTICOS DEL TAMAÑO DEL MERCADO DE SCADA DE PETRÓLEO Y GAS DE SUDÁFRICA, POR TIPO DE IMPLEMENTACIÓN, 2019-2032 (MILES DE MILLONES DE USD)
    142. TABLA 139. ESTIMACIONES Y PRONÓSTICOS DEL TAMAÑO DEL MERCADO DE SCADA DE PETRÓLEO Y GAS DE SUDÁFRICA, POR COMPONENTES, 2019-2032 (MILES DE MILLONES DE USD)
    143. TABLA 140. ESTIMACIONES Y PRONÓSTICOS DEL TAMAÑO DEL MERCADO DE SCADA DE PETRÓLEO Y GAS DE SUDÁFRICA, POR USO FINAL, 2019-2032 (MILES DE MILLONES DE USD)
    144. TABLA 141. ESTIMACIONES Y PRONÓSTICOS DEL TAMAÑO DEL MERCADO DE SCADA DE GAS, POR REGION, 2019-2032 (MILES DE MILLONES DE USD)
    145. TABLA 142. ESTIMACIONES Y PRONÓSTICOS DEL TAMAÑO DEL MERCADO DE SCADA DE PETRÓLEO Y GAS DEL RESTO DE MEA, POR APLICACIÓN, 2019-2032 (MILES DE MILLONES DE USD)
    146. TABLA 143. ESTIMACIONES Y PRONÓSTICOS DEL TAMAÑO DEL MERCADO DE SCADA DE PETRÓLEO Y GAS DEL RESTO DE MEA, POR TIPO DE IMPLEMENTACIÓN, 2019-2032 (MILES DE MILLONES DE USD)
    147. TABLA 144. ESTIMACIONES Y PRONÓSTICOS DEL TAMAÑO DEL MERCADO DE SCADA DE PETRÓLEO Y GAS DEL RESTO DE MEA, POR COMPONENTES, 2019-2032 (MILES DE MILLONES DE USD)
    148. TABLA 145. ESTIMACIONES Y PRONÓSTICOS DEL TAMAÑO DEL MERCADO DE SCADA DE PETRÓLEO Y GAS DEL RESTO DE MEA, POR APLICACIÓN, 2019-2032 (MILES DE MILLONES DE USD) ESTIMACIONES Y PRONÓSTICOS DEL TAMAÑO DEL MERCADO DE SCADA DE GAS, POR USO FINAL, 2019-2032 (MILES DE MILLONES DE USD)
    149. TABLA 146. RESTO DE MERCADO DE PETRÓLEO Y GAS SCADA DE MERCADO DE MEDIO AMBIENTE AUTÉNTICO Y ÁREA ESTIMACIONES Y PRONÓSTICOS, POR REGION, 2019-2032 (MILES DE MILLONES DE USD)
    150. TABLA 147. LANZAMIENTO/DESARROLLO/APROBACIÓN DE PRODUCTOS
    151. TABLA 148. ADQUISICIÓN/ASOCIACIÓN
    152. LISTA DE FIGURAS
    153. FIGURA 1. SINOPSIS DEL MERCADO
    154. FIGURA 2. ANÁLISIS DEL MERCADO DE SCADA DE PETRÓLEO Y GAS DE AMÉRICA DEL NORTE
    155. FIGURA 3. MERCADO DE PETRÓLEO Y GAS DE EE. UU. ANÁLISIS DEL MERCADO DE SCADA DE GAS POR APLICACIÓN
    156. FIGURA 4. ANÁLISIS DEL MERCADO DE SCADA DE PETRÓLEO Y GAS DE EE. UU. POR TIPO DE IMPLEMENTACIÓN
    157. FIGURA 5. ANÁLISIS DEL MERCADO DE SCADA DE PETRÓLEO Y GAS DE EE. UU. POR COMPONENTES
    158. FIGURA 6. ANÁLISIS DEL MERCADO DE SCADA DE PETRÓLEO Y GAS DE EE. UU. POR USO FINAL
    159. FIGURA 7. ANÁLISIS DEL MERCADO DE SCADA DE PETRÓLEO Y GAS DE EE. UU. POR REGIONAL
    160. FIGURA 8. ANÁLISIS DEL MERCADO DE SCADA DE PETRÓLEO Y GAS DE CANADÁ POR APLICACIÓN
    161. FIGURA 9. ANÁLISIS DEL MERCADO DE SCADA DE PETRÓLEO Y GAS DE CANADÁ POR TIPO DE IMPLEMENTACIÓN
    162. FIGURA 10. ANÁLISIS DEL MERCADO DE SCADA DE PETRÓLEO Y GAS DE CANADÁ POR COMPONENTES
    163. FIGURA 11. ANÁLISIS DEL MERCADO DE SCADA DE PETRÓLEO Y GAS DE CANADÁ POR USO FINAL
    164. FIGURA 12. ANÁLISIS DEL MERCADO DE SCADA DE PETRÓLEO Y GAS DE CANADÁ POR REGIONAL
    165. FIGURA 13. ANÁLISIS DEL MERCADO DE SCADA DE PETRÓLEO Y GAS DE EUROPA
    166. FIGURA 14. ANÁLISIS DEL MERCADO DE SCADA DE PETRÓLEO Y GAS DE ALEMANIA POR APLICACIÓN
    167. FIGURA 15. ANÁLISIS DEL MERCADO DE SCADA DE PETRÓLEO Y GAS DE ALEMANIA POR TIPO DE IMPLEMENTACIÓN
    168. FIGURA 16. ANÁLISIS DEL MERCADO DE SCADA DE PETRÓLEO Y GAS DE ALEMANIA POR COMPONENTES
    169. FIGURA 17. ANÁLISIS DEL MERCADO DE SCADA DE PETRÓLEO Y GAS DE ALEMANIA ANÁLISIS DEL MERCADO DE SCADA DE GAS POR USO FINAL
    170. FIGURA 18. ANÁLISIS DEL MERCADO DE SCADA DE PETRÓLEO Y GAS DE ALEMANIA POR REGION
    171. FIGURA 19. ANÁLISIS DEL MERCADO DE SCADA DE PETRÓLEO Y GAS DEL REINO UNIDO POR APLICACIÓN
    172. FIGURA 20. ANÁLISIS DEL MERCADO DE SCADA DE PETRÓLEO Y GAS DEL REINO UNIDO POR TIPO DE IMPLEMENTACIÓN
    173. FIGURA 21. ANÁLISIS DEL MERCADO DE SCADA DE PETRÓLEO Y GAS DEL REINO UNIDO POR COMPONENTES
    174. FIGURA 22. ANÁLISIS DEL MERCADO DE SCADA DE PETRÓLEO Y GAS DEL REINO UNIDO POR USO FINAL
    175. FIGURA 23. ANÁLISIS DEL MERCADO DE SCADA DE PETRÓLEO Y GAS DEL REINO UNIDO POR REGION
    176. FIGURA 24. ANÁLISIS DEL MERCADO DE SCADA DE GAS POR APLICACIÓN
    177. FIGURA 25. ANÁLISIS DEL MERCADO DE SCADA DE PETRÓLEO Y GAS DE FRANCIA POR TIPO DE IMPLEMENTACIÓN
    178. FIGURA 26. ANÁLISIS DEL MERCADO DE SCADA DE PETRÓLEO Y GAS DE FRANCIA POR COMPONENTES
    179. FIGURA 27. ANÁLISIS DEL MERCADO DE SCADA DE PETRÓLEO Y GAS DE FRANCIA POR USO FINAL
    180. FIGURA 28. ANÁLISIS DEL MERCADO DE SCADA DE PETRÓLEO Y GAS DE FRANCIA POR REGIONAL
    181. FIGURA 29. ANÁLISIS DEL MERCADO DE SCADA DE PETRÓLEO Y GAS DE RUSIA POR APLICACIÓN
    182. FIGURA 30. ANÁLISIS DEL MERCADO DE SCADA DE PETRÓLEO Y GAS DE RUSIA POR TIPO DE IMPLEMENTACIÓN
    183. FIGURA 31. ANÁLISIS DEL MERCADO DE SCADA DE PETRÓLEO Y GAS DE RUSIA ANÁLISIS DEL MERCADO DE SCADA DE GAS POR COMPONENTES
    184. FIGURA 32. ANÁLISIS DEL MERCADO DE SCADA DE PETRÓLEO Y GAS DE RUSIA POR USO FINAL
    185. FIGURA 33. ANÁLISIS DEL MERCADO DE SCADA DE PETRÓLEO Y GAS DE RUSIA POR REGION
    186. FIGURA 34. ANÁLISIS DEL MERCADO DE SCADA DE PETRÓLEO Y GAS DE ITALIA POR APLICACIÓN
    187. FIGURA 35. ANÁLISIS DEL MERCADO DE SCADA DE PETRÓLEO Y GAS DE ITALIA POR TIPO DE IMPLEMENTACIÓN
    188. FIGURA 36. ANÁLISIS DEL MERCADO DE SCADA DE PETRÓLEO Y GAS DE ITALIA POR COMPONENTES
    189. FIGURA 37. ANÁLISIS DEL MERCADO DE SCADA DE PETRÓLEO Y GAS DE ITALIA POR USO FINAL
    190. FIGURA 38. ANÁLISIS DEL MERCADO DE SCADA DE PETRÓLEO Y GAS DE ITALIA POR USO FINAL ANÁLISIS DEL MERCADO DE SCADA DE GAS POR REGIÓN
    191. FIGURA 39. ANÁLISIS DEL MERCADO DE SCADA DE PETRÓLEO Y GAS DE ESPAÑA POR APLICACIÓN
    192. FIGURA 40. ANÁLISIS DEL MERCADO DE SCADA DE PETRÓLEO Y GAS DE ESPAÑA POR TIPO DE IMPLEMENTACIÓN
    193. FIGURA 41. ANÁLISIS DEL MERCADO DE SCADA DE PETRÓLEO Y GAS DE ESPAÑA POR COMPONENTES
    194. FIGURA 42. ANÁLISIS DEL MERCADO DE SCADA DE PETRÓLEO Y GAS DE ESPAÑA POR USO FINAL
    195. FIGURA 43. ANÁLISIS DEL MERCADO DE SCADA DE PETRÓLEO Y GAS DE ESPAÑA POR REGIONAL
    196. FIGURA 44. ANÁLISIS DEL MERCADO DE SCADA DE PETRÓLEO Y GAS DEL RESTO DE EUROPA POR APLICACIÓN
    197. FIGURA 45. ANÁLISIS DEL MERCADO DE SCADA DE PETRÓLEO Y GAS DEL RESTO DE EUROPA ANÁLISIS DEL MERCADO DE SCADA DE GAS POR TIPO DE IMPLEMENTACIÓN
    198. FIGURA 46. ANÁLISIS DEL MERCADO DE SCADA DE PETRÓLEO Y GAS DEL RESTO DE EUROPA POR COMPONENTES
    199. FIGURA 47. ANÁLISIS DEL MERCADO DE SCADA DE PETRÓLEO Y GAS DEL RESTO DE EUROPA POR USO FINAL
    200. FIGURA 48. ANÁLISIS DEL MERCADO DE SCADA DE PETRÓLEO Y GAS DEL RESTO DE EUROPA POR REGIONAL
    201. FIGURA 49. ANÁLISIS DEL MERCADO DE SCADA DE PETRÓLEO Y GAS DE APAC
    202. FIGURA 50. ANÁLISIS DEL MERCADO DE SCADA DE PETRÓLEO Y GAS DE CHINA POR APLICACIÓN
    203. FIGURA 51. ANÁLISIS DEL MERCADO DE SCADA DE PETRÓLEO Y GAS DE CHINA POR TIPO DE IMPLEMENTACIÓN
    204. FIGURA 52. ANÁLISIS DEL MERCADO DE SCADA DE PETRÓLEO Y GAS DE CHINA ANÁLISIS DEL MERCADO DE SCADA DE GAS POR COMPONENTES
    205. FIGURA 53. ANÁLISIS DEL MERCADO DE SCADA DE PETRÓLEO Y GAS DE CHINA POR USO FINAL
    206. FIGURA 54. ANÁLISIS DEL MERCADO DE SCADA DE PETRÓLEO Y GAS DE CHINA POR REGIONAL
    207. FIGURA 55. ANÁLISIS DEL MERCADO DE SCADA DE PETRÓLEO Y GAS DE INDIA POR APLICACIÓN
    208. FIGURA 56. ANÁLISIS DEL MERCADO DE SCADA DE PETRÓLEO Y GAS DE INDIA POR TIPO DE IMPLEMENTACIÓN
    209. FIGURA 57. ANÁLISIS DEL MERCADO DE SCADA DE PETRÓLEO Y GAS DE INDIA POR COMPONENTES
    210. FIGURA 58. ANÁLISIS DEL MERCADO DE SCADA DE PETRÓLEO Y GAS DE INDIA POR USO FINAL
    211. FIGURA 59. ANÁLISIS DEL MERCADO DE SCADA DE PETRÓLEO Y GAS DE INDIA ANÁLISIS DEL MERCADO DE SCADA DE GAS POR REGION
    212. FIGURA 60. ANÁLISIS DEL MERCADO DE SCADA DE PETRÓLEO Y GAS DE JAPÓN POR APLICACIÓN
    213. FIGURA 61. ANÁLISIS DEL MERCADO DE SCADA DE PETRÓLEO Y GAS DE JAPÓN POR TIPO DE IMPLEMENTACIÓN
    214. FIGURA 62. ANÁLISIS DEL MERCADO DE SCADA DE PETRÓLEO Y GAS DE JAPÓN POR COMPONENTES
    215. FIGURA 63. ANÁLISIS DEL MERCADO DE SCADA DE PETRÓLEO Y GAS DE JAPÓN POR USO FINAL
    216. FIGURA 64. ANÁLISIS DEL MERCADO DE SCADA DE PETRÓLEO Y GAS DE JAPÓN POR REGION
    217. FIGURA 65. ANÁLISIS DEL MERCADO DE SCADA DE PETRÓLEO Y GAS DE COREA DEL SUR POR APLICACIÓN
    218. FIGURA 66. ANÁLISIS DEL MERCADO DE SCADA DE PETRÓLEO Y GAS DE COREA DEL SUR ANÁLISIS DEL MERCADO DE SCADA DE GAS POR TIPO DE IMPLEMENTACIÓN
    219. FIGURA 67. ANÁLISIS DEL MERCADO DE SCADA DE PETRÓLEO Y GAS DE COREA DEL SUR POR COMPONENTES
    220. FIGURA 68. ANÁLISIS DEL MERCADO DE SCADA DE PETRÓLEO Y GAS DE COREA DEL SUR POR USO FINAL
    221. FIGURA 69. ANÁLISIS DEL MERCADO DE SCADA DE PETRÓLEO Y GAS DE COREA DEL SUR POR REGIONAL
    222. FIGURA 70. ANÁLISIS DEL MERCADO DE SCADA DE PETRÓLEO Y GAS DE MALASIA POR APLICACIÓN
    223. FIGURA 71. ANÁLISIS DEL MERCADO DE SCADA DE PETRÓLEO Y GAS DE MALASIA POR TIPO DE IMPLEMENTACIÓN
    224. FIGURA 72. ANÁLISIS DEL MERCADO DE SCADA DE PETRÓLEO Y GAS DE MALASIA ANÁLISIS DEL MERCADO DE SCADA DE GAS POR COMPONENTES
    225. FIGURA 73. ANÁLISIS DEL MERCADO DE SCADA DE PETRÓLEO Y GAS DE MALASIA POR USO FINAL
    226. FIGURA 74. ANÁLISIS DEL MERCADO DE SCADA DE PETRÓLEO Y GAS DE MALASIA POR REGION
    227. FIGURA 75. ANÁLISIS DEL MERCADO DE SCADA DE PETRÓLEO Y GAS DE TAILANDIA POR APLICACIÓN
    228. FIGURA 76. ANÁLISIS DEL MERCADO DE SCADA DE PETRÓLEO Y GAS DE TAILANDIA POR TIPO DE IMPLEMENTACIÓN
    229. FIGURA 77. ANÁLISIS DEL MERCADO DE SCADA DE PETRÓLEO Y GAS DE TAILANDIA POR COMPONENTES
    230. FIGURA 78. ANÁLISIS DEL MERCADO DE SCADA DE PETRÓLEO Y GAS DE TAILANDIA POR USO FINAL
    231. FIGURA 79. ANÁLISIS DEL MERCADO DE SCADA DE PETRÓLEO Y GAS DE TAILANDIA POR USO FINAL ANÁLISIS DEL MERCADO DE SCADA DE GAS POR REGION
    232. FIGURA 80. ANÁLISIS DEL MERCADO DE SCADA DE PETRÓLEO Y GAS DE INDONESIA POR APLICACIÓN
    233. FIGURA 81. ANÁLISIS DEL MERCADO DE SCADA DE PETRÓLEO Y GAS DE INDONESIA POR TIPO DE IMPLEMENTACIÓN
    234. FIGURA 82. ANÁLISIS DEL MERCADO DE SCADA DE PETRÓLEO Y GAS DE INDONESIA POR COMPONENTES
    235. FIGURA 83. ANÁLISIS DEL MERCADO DE SCADA DE PETRÓLEO Y GAS DE INDONESIA POR USO FINAL
    236. FIGURA 84. ANÁLISIS DEL MERCADO DE SCADA DE PETRÓLEO Y GAS DE INDONESIA POR REGION
    237. FIGURA 85. RESTO DE APAC ANÁLISIS DEL MERCADO DE SCADA DE PETRÓLEO Y GAS POR APLICACIÓN
    238. FIGURA 86. RESTO DE APAC ANÁLISIS DEL MERCADO DE SCADA DE GAS POR TIPO DE IMPLEMENTACIÓN
    239. FIGURA 87. RESTO DEL ANÁLISIS DEL MERCADO DE SCADA DE PETRÓLEO Y GAS DE APAC POR COMPONENTES
    240. FIGURA 88. RESTO DEL ANÁLISIS DEL MERCADO DE SCADA DE PETRÓLEO Y GAS DE APAC POR USO FINAL
    241. FIGURA 89. RESTO DEL ANÁLISIS DEL MERCADO DE SCADA DE PETRÓLEO Y GAS DE APAC POR REGION
    242. FIGURA 90. ANÁLISIS DEL MERCADO DE SCADA DE PETRÓLEO Y GAS DE SUDAMÉRICA
    243. FIGURA 91. ANÁLISIS DEL MERCADO DE SCADA DE PETRÓLEO Y GAS DE BRASIL POR APLICACIÓN
    244. FIGURA 92. ANÁLISIS DEL MERCADO DE SCADA DE PETRÓLEO Y GAS DE BRASIL POR TIPO DE IMPLEMENTACIÓN
    245. FIGURA 93. ANÁLISIS DEL MERCADO DE SCADA DE GAS POR COMPONENTES
    246. FIGURA 94. ANÁLISIS DEL MERCADO DE SCADA DE PETRÓLEO Y GAS DE BRASIL POR USO FINAL
    247. FIGURA 95. ANÁLISIS DEL MERCADO DE SCADA DE PETRÓLEO Y GAS DE BRASIL POR REGIONAL
    248. FIGURA 96. ANÁLISIS DEL MERCADO DE SCADA DE PETRÓLEO Y GAS DE MÉXICO POR APLICACIÓN
    249. FIGURA 97. ANÁLISIS DEL MERCADO DE SCADA DE PETRÓLEO Y GAS DE MÉXICO POR TIPO DE IMPLEMENTACIÓN
    250. FIGURA 98. ANÁLISIS DEL MERCADO DE SCADA DE PETRÓLEO Y GAS DE MÉXICO POR COMPONENTES
    251. FIGURA 99. ANÁLISIS DEL MERCADO DE SCADA DE PETRÓLEO Y GAS DE MÉXICO POR USO FINAL
    252. FIGURA 100. ANÁLISIS DEL MERCADO DE SCADA DE PETRÓLEO Y GAS DE MÉXICO ANÁLISIS DEL MERCADO DE SCADA DE GAS POR REGION
    253. FIGURA 101. ANÁLISIS DEL MERCADO DE SCADA DE PETRÓLEO Y GAS DE ARGENTINA POR APLICACIÓN
    254. FIGURA 102. ANÁLISIS DEL MERCADO DE SCADA DE PETRÓLEO Y GAS DE ARGENTINA POR TIPO DE IMPLEMENTACIÓN
    255. FIGURA 103. ANÁLISIS DEL MERCADO DE SCADA DE PETRÓLEO Y GAS DE ARGENTINA POR COMPONENTES
    256. FIGURA 104. ANÁLISIS DEL MERCADO DE SCADA DE PETRÓLEO Y GAS DE ARGENTINA POR USO FINAL
    257. FIGURA 105. ANÁLISIS DEL MERCADO DE SCADA DE PETRÓLEO Y GAS DE ARGENTINA POR REGION
    258. FIGURA 106. RESTO DE AMÉRICA DEL SUR PETRÓLEO Y ANÁLISIS DEL MERCADO DE SCADA DE GAS POR APLICACIÓN
    259. FIGURA 107. RESTO DE AMÉRICA ANÁLISIS DEL MERCADO DE SCADA DE PETRÓLEO Y GAS POR TIPO DE IMPLEMENTACIÓN
    260. FIGURA 108. RESTO DE AMÉRICA ANÁLISIS DEL MERCADO DE SCADA DE PETRÓLEO Y GAS POR COMPONENTES
    261. FIGURA 109. RESTO DE AMÉRICA ANÁLISIS DEL MERCADO DE SCADA DE PETRÓLEO Y GAS POR USO FINAL
    262. FIGURA 110. RESTO DE AMÉRICA ANÁLISIS DEL MERCADO DE SCADA DE PETRÓLEO Y GAS POR REGION
    263. FIGURA 111. ANÁLISIS DEL MERCADO DE SCADA DE PETRÓLEO Y GAS DE MEA
    264. FIGURA 112. PAÍSES DEL CCG DE PETRÓLEO Y ANÁLISIS DEL MERCADO DE SCADA DE GAS POR APLICACIÓN
    265. FIGURA 113. ANÁLISIS DEL MERCADO DE SCADA DE PETRÓLEO Y GAS DE LOS PAÍSES DEL CCG POR TIPO DE IMPLEMENTACIÓN
    266. FIGURA 114. ANÁLISIS DEL MERCADO DE SCADA DE PETRÓLEO Y GAS DE LOS PAÍSES DEL CCG POR COMPONENTES
    267. FIGURA 115. ANÁLISIS DEL MERCADO DE SCADA DE PETRÓLEO Y GAS DE LOS PAÍSES DEL CCG POR USO FINAL
    268. FIGURA 116. ANÁLISIS DEL MERCADO DE SCADA DE PETRÓLEO Y GAS DE LOS PAÍSES DEL CCG POR REGION
    269. FIGURA 117. ANÁLISIS DEL MERCADO DE SCADA DE PETRÓLEO Y GAS DE SUDÁFRICA POR APLICACIÓN
    270. FIGURA 118. ANÁLISIS DEL MERCADO DE SCADA DE PETRÓLEO Y GAS DE SUDÁFRICA ANÁLISIS DEL MERCADO DE SCADA DE GAS POR TIPO DE IMPLEMENTACIÓN
    271. FIGURA 119. ANÁLISIS DEL MERCADO DE SCADA DE PETRÓLEO Y GAS DE SUDÁFRICA POR COMPONENTES
    272. FIGURA 120. ANÁLISIS DEL MERCADO DE SCADA DE PETRÓLEO Y GAS DE SUDÁFRICA POR USO FINAL
    273. FIGURA 121. ANÁLISIS DEL MERCADO DE SCADA DE PETRÓLEO Y GAS DE SUDÁFRICA POR REGIONAL
    274. FIGURA 122. ANÁLISIS DEL MERCADO DE SCADA DE PETRÓLEO Y GAS DEL RESTO DE MEDIO AMERICA POR APLICACIÓN
    275. FIGURA 123. ANÁLISIS DEL MERCADO DE SCADA DE PETRÓLEO Y GAS DEL RESTO DE MEDIO AMERICA POR TIPO DE IMPLEMENTACIÓN
    276. FIGURA 124. ANÁLISIS DEL MERCADO DE SCADA DE PETRÓLEO Y GAS DEL RESTO DE MEDIO AMERICA ANÁLISIS DEL MERCADO DE SCADA DE GAS POR COMPONENTES
    277. FIGURA 125. RESTO DEL MERCADO DE SCADA DE PETRÓLEO Y GAS DE MEA ANÁLISIS POR USO FINAL
    278. FIGURA 126. RESTO DEL MERCADO DE SCADA DE PETRÓLEO Y GAS DE MEA ANÁLISIS POR REGIONAL
    279. FIGURA 127. CRITERIOS CLAVE DE COMPRA DEL MERCADO DE SCADA DE PETRÓLEO Y GAS
    280. FIGURA 128. PROCESO DE INVESTIGACIÓN DE MRFR
    281. FIGURA 129. ANÁLISIS DRO DEL MERCADO DE SCADA DE PETRÓLEO Y GAS
    282. FIGURA 130. ANÁLISIS DEL IMPACTO DE LOS IMPULSORES: MERCADO DE SCADA DE PETRÓLEO Y GAS
    283. FIGURA 131. ANÁLISIS DEL IMPACTO DE LAS RESTRICCIONES: PETRÓLEO Y MERCADO DE SCADA DE GAS
    284. FIGURA 132. CADENA DE SUMINISTRO/VALOR: MERCADO DE SCADA DE PETRÓLEO Y GAS
    285. FIGURA 133. MERCADO DE SCADA DE PETRÓLEO Y GAS, POR APLICACIÓN, 2024 (% PARTICIPACIÓN)
    286. FIGURA 134. MERCADO DE SCADA DE PETRÓLEO Y GAS, POR APLICACIÓN, 2019 A 2032 (miles de millones de USD)
    287. FIGURA 135. MERCADO DE SCADA DE PETRÓLEO Y GAS, POR TIPO DE IMPLEMENTACIÓN, 2024 (% PARTICIPACIÓN)
    288. FIGURA 136. MERCADO DE SCADA DE PETRÓLEO Y GAS, POR TIPO DE IMPLEMENTACIÓN, 2019 A 2032 (miles de millones de USD)
    289. FIGURA 137. MERCADO DE SCADA DE PETRÓLEO Y GAS, POR APLICACIÓN, 2019 A 2032 (miles de millones de USD) MERCADO DE SCADA DE GAS, POR COMPONENTES, 2024 (% PARTICIPACIÓN)
    290. FIGURA 138. MERCADO DE SCADA DE PETRÓLEO Y GAS, POR COMPONENTES, 2019 A 2032 (miles de millones de USD)
    291. FIGURA 139. MERCADO DE SCADA DE PETRÓLEO Y GAS, POR USO FINAL, 2024 (% PARTICIPACIÓN)
    292. FIGURA 140. MERCADO DE SCADA DE PETRÓLEO Y GAS, POR USO FINAL, 2019 A 2032 (miles de millones de USD)
    293. FIGURA 141. MERCADO DE SCADA DE PETRÓLEO Y GAS, POR REGION, 2024 (% PARTICIPACIÓN)
    294. FIGURA 142. MERCADO DE SCADA DE PETRÓLEO Y GAS, POR REGION, 2024 (% PARTICIPACIÓN)
    295. FIGURA 143. MERCADO DE SCADA DE GAS, POR REGION, 2019 A 2032 (Miles de millones de USD)
    296. FIGURA 143. ANÁLISIS DE REFERENCIA DE LOS PRINCIPALES COMPETIDORES

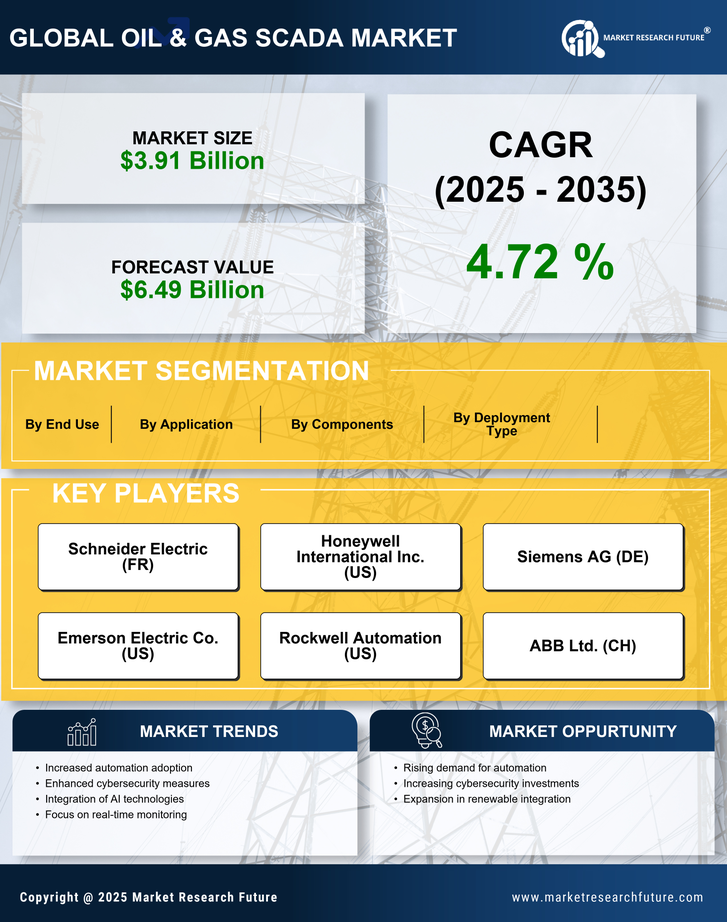
Segmentación del mercado de SCADA de petróleo y gas

  • Mercado de SCADA de petróleo y gas por aplicación (miles de millones de USD, 2019-2032)
    • Monitoreo de ductos
    • Monitoreo de la producción de petróleo y gas
    • Automatización de refinerías
    • Gestión de la distribución
  • Mercado de SCADA de petróleo y gas por tipo de implementación (miles de millones de USD, 2019-2032)
    • Local
    • Basado en la nube
  • Mercado de SCADA de petróleo y gas por aplicación (miles de millones de USD, 2019-2032)
    • En las instalaciones ... Mercado de SCADA de gas por componentes (miles de millones de USD, 2019-2032)
      • Hardware
      • Software
      • Servicios
    • Mercado de SCADA de petróleo y gas por uso final (miles de millones de USD, 2019-2032)
      • Upstream
      • Midstream
      • Downstream
    • Petróleo y Mercado de SCADA de gas por región (miles de millones de USD, 2019-2032)
      • Norteamérica
      • Europa
      • Sudamérica
      • Asia Pacífico
      • Oriente Medio y África

    Perspectiva regional del mercado de SCADA de petróleo y gas (miles de millones de USD, 2019-2032)

    • Perspectivas de Norteamérica (miles de millones de USD, 2019-2032)
      • Mercado de SCADA de petróleo y gas en Norteamérica por tipo de aplicación
        • Monitoreo de oleoductos
        • Monitoreo de la producción de petróleo y gas
        • Automatización de refinerías
        • Gestión de la distribución
      • Mercado de SCADA de petróleo y gas en Norteamérica por tipo de implementación
        • En las instalaciones
        • Basado en la nube
      • Mercado de SCADA de petróleo y gas en Norteamérica por tipo de componente
        • Hardware
        • Software
        • Servicios
      • Petróleo y Mercado de SCADA de gas por tipo de uso final
        • Upstream
        • Midstream
        • Downstream
      • Mercado de SCADA de petróleo y gas de Norteamérica por tipo regional
        • EE. UU.
        • Canadá
      • Perspectivas de EE. UU. (miles de millones de USD, 2019-2032)
      • Mercado de SCADA de petróleo y gas de EE. UU. por tipo de aplicación
        • Monitoreo de ductos
        • Monitoreo de la producción de petróleo y gas
        • Automatización de refinerías
        • Gestión de la distribución
      • Petróleo y Mercado de SCADA de gas por tipo de implementación
        • Local
        • Basado en la nube
      • Mercado de SCADA de petróleo y gas de EE. UU. por tipo de componentes
        • Hardware
        • Software
        • Servicios
      • Mercado de SCADA de petróleo y gas de EE. UU. por tipo de uso final
        • Upstream
        • Midstream
        • Downstream
      • Perspectivas para Canadá (miles de millones de USD, 2019-2032)
      • Canadá Petróleo y Mercado de SCADA de gas por tipo de aplicación
        • Monitoreo de tuberías
        • Monitoreo de la producción de petróleo y gas
        • Automatización de refinerías
        • Gestión de la distribución
      • Canadá Mercado de SCADA de petróleo y gas por tipo de implementación
        • En las instalaciones
        • Basado en la nube
      • Canadá Mercado de SCADA de petróleo y gas por tipo de componente
        • Hardware
        • Software
        • Servicios
      • Canadá Mercado de SCADA de gas por tipo de uso final
        • Upstream
        • Midstream
        • Downstream
      • Perspectivas en Europa (miles de millones de USD, 2019-2032)
        • Mercado de SCADA de petróleo y gas en Europa por tipo de aplicación
          • Monitoreo de oleoductos
          • Monitoreo de la producción de petróleo y gas
          • Automatización de refinerías
          • Gestión de la distribución
        • Mercado de SCADA de petróleo y gas en Europa por tipo de implementación
          • Local
          • Basado en la nube
        • Mercado de petróleo y gas en Europa Mercado de SCADA de gas por tipo de componente
          • Hardware
          • Software
          • Servicios
        • Mercado europeo de SCADA de petróleo y gas por tipo de uso final
          • Upstream
          • Midstream
          • Downstream
        • Mercado europeo de SCADA de petróleo y gas por tipo regional
          • Alemania
          • Reino Unido
          • Francia
          • Rusia
          • Italia
          • España
          • Resto de Europa
        • Perspectivas para ALEMANIA (miles de millones de USD, 2019-2032)
        • ALEMANIA Petróleo y Mercado de SCADA de gas por tipo de aplicación
          • Monitoreo de tuberías
          • Monitoreo de la producción de petróleo y gas
          • Automatización de refinerías
          • Gestión de la distribución
        • ALEMANIA Mercado de SCADA de petróleo y gas por tipo de implementación
          • En las instalaciones
          • Basado en la nube
        • ALEMANIA Mercado de SCADA de petróleo y gas por tipo de componente
          • Hardware
          • Software
          • Servicios
        • ALEMANIA Petróleo y Mercado de SCADA de gas por tipo de uso final
          • Upstream
          • Midstream
          • Downstream
        • Perspectivas para el Reino Unido (miles de millones de USD, 2019-2032)
        • Mercado de SCADA de petróleo y gas del Reino Unido por tipo de aplicación
          • Monitoreo de oleoductos
          • Monitoreo de la producción de petróleo y gas
          • Automatización de refinerías
          • Gestión de la distribución
        • Mercado de SCADA de petróleo y gas del Reino Unido por tipo de implementación
          • Local
          • Basado en la nube
        • Petróleo y Mercado de SCADA de gas por tipo de componente
          • Hardware
          • Software
          • Servicios
        • Mercado de SCADA de petróleo y gas del Reino Unido por tipo de uso final
          • Upstream
          • Midstream
          • Downstream
        • Perspectivas para Francia (miles de millones de USD, 2019-2032)
        • Mercado de SCADA de petróleo y gas en Francia por tipo de aplicación
          • Monitorización de oleoductos
          • Monitorización de la producción de petróleo y gas
          • Automatización de refinerías
          • Gestión de la distribución
        • Francia Petróleo y Mercado de SCADA de gas por tipo de implementación
          • Local
          • Basado en la nube
        • Francia: Mercado de SCADA de petróleo y gas por tipo de componentes
          • Hardware
          • Software
          • Servicios
        • Francia: Mercado de SCADA de petróleo y gas por tipo de uso final
          • Upstream
          • Midstream
          • Downstream
        • Perspectivas para Rusia (miles de millones de USD, 2019-2032)
        • Rusia: Mercado de petróleo y gas Mercado de SCADA de gas por tipo de aplicación
          • Monitoreo de tuberías
          • Monitoreo de la producción de petróleo y gas
          • Automatización de refinerías
          • Gestión de la distribución
        • Mercado de SCADA de petróleo y gas en Rusia por tipo de implementación
          • En las instalaciones
          • Basado en la nube
        • Mercado de SCADA de petróleo y gas en Rusia por tipo de componente
          • Hardware
          • Software
          • Servicios
        • Mercado de petróleo y gas en Rusia Mercado de SCADA de gas por tipo de uso final
          • Upstream
          • Midstream
          • Downstream
        • Perspectivas de ITALIA (miles de millones de USD, 2019-2032)
        • Mercado de SCADA de petróleo y gas en ITALIA por tipo de aplicación
          • Monitoreo de oleoductos
          • Monitoreo de la producción de petróleo y gas
          • Automatización de refinerías
          • Gestión de la distribución
        • Mercado de SCADA de petróleo y gas en ITALIA por tipo de implementación
          • Local
          • Basado en la nube
        • Petróleo y Mercado de SCADA de gas por tipo de componente
          • Hardware
          • Software
          • Servicios
        • ITALIA Mercado de SCADA de petróleo y gas por tipo de uso final
          • Upstream
          • Midstream
          • Downstream
        • ESPAÑA Perspectivas (miles de millones de USD, 2019-2032)
        • ESPAÑA Mercado de SCADA de petróleo y gas por tipo de aplicación
          • Monitorización de oleoductos
          • Monitorización de la producción de petróleo y gas
          • Automatización de refinerías
          • Gestión de la distribución
        • ESPAÑA Petróleo y Mercado de SCADA de gas por tipo de implementación
          • Local
          • En la nube
        • Mercado de SCADA de petróleo y gas en ESPAÑA por tipo de componentes
          • Hardware
          • Software
          • Servicios
        • Mercado de SCADA de petróleo y gas en ESPAÑA por tipo de uso final
          • Upstream
          • Midstream
          • Downstream
        • Perspectivas para el RESTO DE EUROPA (miles de millones de USD, 2019-2032)
        • Resto de EUROPA Petróleo y Mercado de SCADA de gas por tipo de aplicación
          • Monitorización de oleoductos
          • Monitorización de la producción de petróleo y gas
          • Automatización de refinerías
          • Gestión de la distribución
        • RESTO DE EUROPA Mercado de SCADA de petróleo y gas por tipo de implementación
          • En las instalaciones
          • Basado en la nube
        • RESTO DE EUROPA Mercado de SCADA de petróleo y gas por tipo de componente
          • Hardware
          • Software
          • Servicios
        • RESTO DE EUROPA Petróleo y Mercado de SCADA de gas por tipo de uso final
          • Upstream
          • Midstream
          • Downstream
        • Perspectivas de APAC (miles de millones de USD, 2019-2032)
          • Mercado de SCADA de petróleo y gas de APAC por tipo de aplicación
            • Monitoreo de oleoductos
            • Monitoreo de la producción de petróleo y gas
            • Automatización de refinerías
            • Gestión de la distribución
          • Mercado de SCADA de petróleo y gas de APAC por tipo de implementación
            • Local
            • Basado en la nube
          • Petróleo y Mercado de SCADA de gas por tipo de componente
            • Hardware
            • Software
            • Servicios
          • Mercado de SCADA de petróleo y gas de Asia-Pacífico por tipo de uso final
            • Upstream
            • Midstream
            • Downstream
          • Mercado de SCADA de petróleo y gas de Asia-Pacífico por tipo regional
            • China
            • India
            • Japón
            • Corea del Sur
            • Malasia
            • Tailandia
            • Indonesia
            • Resto de Asia-Pacífico
          • Perspectivas de China (miles de millones de USD, 2019-2032)
          • China Petróleo y Mercado de SCADA de gas por tipo de aplicación
            • Monitoreo de tuberías
            • Monitoreo de la producción de petróleo y gas
            • Automatización de refinerías
            • Gestión de la distribución
          • Mercado de SCADA de petróleo y gas en China por tipo de implementación
            • En las instalaciones
            • Basado en la nube
          • Mercado de SCADA de petróleo y gas en China por tipo de componente
            • Hardware
            • Software
            • Servicios
          • Petróleo y Mercado de SCADA de gas por tipo de uso final
            • Upstream
            • Midstream
            • Downstream
          • Perspectivas de INDIA (miles de millones de USD, 2019-2032)
          • Mercado de SCADA de petróleo y gas de INDIA por tipo de aplicación
            • Monitoreo de oleoductos
            • Monitoreo de la producción de petróleo y gas
            • Automatización de refinerías
            • Gestión de la distribución
          • Mercado de SCADA de petróleo y gas de INDIA por tipo de implementación
            • Local
            • Basado en la nube
          • Petróleo y Mercado de SCADA de gas por tipo de componente
            • Hardware
            • Software
            • Servicios
          • INDIA Mercado de SCADA de petróleo y gas por tipo de uso final
            • Upstream
            • Midstream
            • Downstream
          • Perspectivas de Japón (miles de millones de USD, 2019-2032)
          • JAPÓN Mercado de SCADA de petróleo y gas por tipo de aplicación
            • Monitoreo de oleoductos
            • Monitoreo de la producción de petróleo y gas
            • Automatización de refinerías
            • Gestión de la distribución
          • JAPÓN Petróleo y Mercado de SCADA de gas por tipo de implementación
            • Local
            • Basado en la nube
          • Mercado de SCADA de petróleo y gas en Japón por tipo de componentes
            • Hardware
            • Software
            • Servicios
          • Mercado de SCADA de petróleo y gas en Japón por tipo de uso final
            • Upstream
            • Midstream
            • Downstream
          • Perspectivas para COREA DEL SUR (miles de millones de USD, 2019-2032)
          • Corea del Sur Petróleo y Mercado de SCADA de gas por tipo de aplicación
            • Monitoreo de tuberías
            • Monitoreo de la producción de petróleo y gas
            • Automatización de refinerías
            • Gestión de la distribución
          • COREA DEL SUR Mercado de SCADA de petróleo y gas por tipo de implementación
            • En las instalaciones
            • Basado en la nube
          • COREA DEL SUR Mercado de SCADA de petróleo y gas por tipo de componente
            • Hardware
            • Software
            • Servicios
          • COREA DEL SUR Mercado de petróleo y gas Mercado de SCADA de gas por tipo de uso final
            • Upstream
            • Midstream
            • Downstream
          • Perspectivas de MALASIA (miles de millones de USD, 2019-2032)
          • Mercado de SCADA de petróleo y gas de MALASIA por tipo de aplicación
            • Monitoreo de oleoductos
            • Monitoreo de la producción de petróleo y gas
            • Automatización de refinerías
            • Gestión de la distribución
          • Mercado de SCADA de petróleo y gas de MALASIA por tipo de implementación
            • Local
            • Basado en la nube
          • Mercado de petróleo y gas de MALASIA Mercado de SCADA de gas por tipo de componente
            • Hardware
            • Software
            • Servicios
          • Mercado de SCADA de petróleo y gas en MALASIA por tipo de uso final
            • Upstream
            • Midstream
            • Downstream
          • Tailandia Perspectivas (miles de millones de USD, 2019-2032)
          • Tailandia Mercado de SCADA de petróleo y gas por tipo de aplicación
            • Monitoreo de oleoductos
            • Monitoreo de la producción de petróleo y gas
            • Automatización de refinerías
            • Gestión de la distribución
          • Tailandia Petróleo y Mercado de SCADA de gas por tipo de implementación
            • Local
            • Basado en la nube
          • Tailandia Mercado de SCADA de petróleo y gas por tipo de componentes
            • Hardware
            • Software
            • Servicios
          • Tailandia Mercado de SCADA de petróleo y gas por tipo de uso final
            • Upstream
            • Midstream
            • Downstream
          • Perspectivas de INDONESIA (miles de millones de USD, 2019-2032)
          • INDONESIA Petróleo y Mercado de SCADA de gas por tipo de aplicación
            • Monitoreo de tuberías
            • Monitoreo de la producción de petróleo y gas
            • Automatización de refinerías
            • Gestión de la distribución
          • Mercado de SCADA de petróleo y gas de INDONESIA por tipo de implementación
            • En las instalaciones
            • Basado en la nube
          • Mercado de SCADA de petróleo y gas de INDONESIA por tipo de componente
            • Hardware
            • Software
            • Servicios
          • Mercado de petróleo y gas de INDONESIA Mercado de SCADA de gas por tipo de uso final
            • Upstream
            • Midstream
            • Downstream
          • Perspectivas para el RESTO DE APAC (miles de millones de USD, 2019-2032)
          • Mercado de SCADA de petróleo y gas para el RESTO DE APAC por tipo de aplicación
            • Monitoreo de ductos
            • Monitoreo de la producción de petróleo y gas
            • Automatización de refinerías
            • Gestión de la distribución
          • Mercado de SCADA de petróleo y gas para el RESTO DE APAC por tipo de implementación
            • Local
            • Basado en la nube
          • Mercado de SCADA de petróleo y gas para el RESTO DE APAC Mercado de SCADA de gas por tipo de componente
            • Hardware
            • Software
            • Servicios
          • RESTO DEL MERCADO DE SCADA DE PETRÓLEO Y GAS DE APAC POR TIPO DE USO FINAL
            • Upstream
            • Midstream
            • Downstream
          • Panorama de Sudamérica (miles de millones de USD, 2019-2032)
            • Mercado de SCADA de petróleo y gas de Sudamérica por tipo de aplicación
              • Monitoreo de ductos
              • Monitoreo de la producción de petróleo y gas
              • Automatización de refinerías
              • Gestión de la distribución
            • Petróleo y Mercado de SCADA de gas por tipo de implementación
              • Local
              • En la nube
            • Mercado de SCADA de petróleo y gas en Sudamérica por tipo de componentes
              • Hardware
              • Software
              • Servicios
            • Mercado de SCADA de petróleo y gas en Sudamérica por tipo de uso final
              • Upstream
              • Midstream
              • Downstream
            • Petróleo y Mercado de SCADA de gas por tipo regional
              • Brasil
              • México
              • Argentina
              • Resto de Sudamérica
            • Perspectivas de BRASIL (miles de millones de USD, 2019-2032)
            • Mercado de SCADA de petróleo y gas de BRASIL por tipo de aplicación
              • Monitoreo de ductos
              • Monitoreo de la producción de petróleo y gas
              • Automatización de refinerías
              • Gestión de la distribución
            • Mercado de SCADA de petróleo y gas de BRASIL por tipo de implementación
              • Local
              • Basado en la nube
            • Brasil Petróleo y Mercado de SCADA de gas por tipo de componente
              • Hardware
              • Software
              • Servicios
            • BRASIL Mercado de SCADA de petróleo y gas por tipo de uso final
              • Upstream
              • Midstream
              • Downstream
            • Perspectiva de MÉXICO (miles de millones de USD, 2019-2032)
            • Mercado de SCADA de petróleo y gas de MÉXICO por tipo de aplicación
              • Monitoreo de ductos
              • Monitoreo de la producción de petróleo y gas
              • Automatización de refinerías
              • Gestión de la distribución
            • MÉXICO Petróleo y Mercado de SCADA de gas por tipo de implementación
              • Local
              • Basado en la nube
            • Mercado de SCADA de petróleo y gas en MÉXICO por tipo de componentes
              • Hardware
              • Software
              • Servicios
            • Mercado de SCADA de petróleo y gas en MÉXICO por tipo de uso final
              • Upstream
              • Midstream
              • Downstream
            • ARGENTINA Perspectivas (miles de millones de USD, 2019-2032)
            • ARGENTINA Petróleo y Mercado de SCADA de gas por tipo de aplicación
              • Monitoreo de ductos
              • Monitoreo de la producción de petróleo y gas
              • Automatización de refinerías
              • Gestión de la distribución
            • ARGENTINA Mercado de SCADA de petróleo y gas por tipo de implementación
              • En las instalaciones
              • Basado en la nube
            • ARGENTINA Mercado de SCADA de petróleo y gas por tipo de componentes
              • Hardware
              • Software
              • Servicios
            • ARGENTINA Petróleo y Mercado de SCADA de gas por tipo de uso final
              • Upstream
              • Midstream
              • Downstream
            • RESTO DE SUDAMÉRICA Perspectivas (miles de millones de USD, 2019-2032)
            • RESTO DE SUDAMÉRICA Mercado de SCADA de petróleo y gas por tipo de aplicación
              • Monitoreo de ductos
              • Monitoreo de la producción de petróleo y gas
              • Automatización de refinerías
              • Gestión de la distribución
            • RESTO DE SUDAMÉRICA Mercado de SCADA de petróleo y gas por tipo de implementación
              • En las instalaciones
              • Basado en la nube
            • RESTO DE SUDAMÉRICA Petróleo y Mercado de SCADA de gas por tipo de componente
              • Hardware
              • Software
              • Servicios
            • RESTO DE SUDAMÉRICA Mercado de SCADA de petróleo y gas por tipo de uso final
              • Upstream
              • Midstream
              • Downstream
            • Perspectivas de Oriente Medio y África (miles de millones de USD, 2019-2032)
              • Mercado de SCADA de petróleo y gas de Oriente Medio y África por tipo de aplicación
                • Monitoreo de ductos
                • Monitoreo de la producción de petróleo y gas
                • Automatización de refinerías
                • Gestión de la distribución
              • Petróleo y Mercado SCADA de gas por tipo de implementación
                • En las instalaciones
                • Basado en la nube
              • Aceite MEA y aceite Mercado SCADA de gas por tipo de componentes
                • Hardware
                • Software
                • Servicios
              • Aceite MEA y aceite Mercado SCADA de gas por tipo de uso final
                • Ascendente
                • A mitad de camino
                • Abajo
              • Aceite MEA y aceite Mercado de SCADA de gas por tipo regional
                • Países del CCG
                • Sudáfrica
                • Resto de Oriente Medio y África
              • Perspectivas de los países del CCG (miles de millones de USD, 2019-2032)
              • Mercado de SCADA de petróleo y gas de los países del CCG por tipo de aplicación
                • Monitoreo de oleoductos
                • Monitoreo de la producción de petróleo y gas
                • Automatización de refinerías
                • Gestión de la distribución
              • Mercado de SCADA de petróleo y gas de los países del CCG por tipo de implementación
                • En las instalaciones
                • Basado en la nube
              • Países del CCG Petróleo y Mercado de SCADA de gas por tipo de componente
                • Hardware
                • Software
                • Servicios
              • PAÍSES DEL CCG Mercado de SCADA de petróleo y gas por tipo de uso final
                • Upstream
                • Midstream
                • Downstream
              • Perspectivas de SUDÁFRICA (miles de millones de USD, 2019-2032)
              • Mercado de SCADA de petróleo y gas en SUDÁFRICA por tipo de aplicación
                • Monitoreo de oleoductos
                • Monitoreo de la producción de petróleo y gas
                • Automatización de refinerías
                • Gestión de la distribución
              • SUDÁFRICA Petróleo y Mercado de SCADA de gas por tipo de implementación
                • Local
                • Basado en la nube
              • SUDÁFRICA Mercado de SCADA de petróleo y gas por tipo de componentes
                • Hardware
                • Software
                • Servicios
              • SUDÁFRICA Mercado de SCADA de petróleo y gas por tipo de uso final
                • Upstream
                • Midstream
                • Downstream
              • Perspectivas para el RESTO DE MEA (miles de millones de USD, 2019-2032)
              • RESTO DE MEA Petróleo y Mercado de SCADA de gas por tipo de aplicación
                • Monitoreo de tuberías
                • Monitoreo de la producción de petróleo y gas
                • Automatización de refinerías
                • Gestión de la distribución
              • Mercado de SCADA de petróleo y gas en el resto de Oriente Medio y África por tipo de implementación
                • En las instalaciones
                • Basado en la nube
              • Mercado de SCADA de petróleo y gas en el resto de Oriente Medio y África por tipo de componente
                • Hardware
                • Software
                • Servicios
              • Mercado de SCADA de petróleo y gas en el resto de Oriente Medio y África Mercado de SCADA de gas por tipo de uso final
                • Upstream
                • Midstream
                • Downstream