LAN Cable Market

ID: MRFR/SEM/8652-CR 115 Pages Ankit Gupta Last Updated: September 22, 2026
Tamaño del mercado de cables LAN, participación e informe de investigación por tipo (Cobre y Fibra), por forma (Cable Ethernet sólido y Cable Ethernet estándar), y por región (América del Norte, Europa, Asia-Pacífico y Resto del Mundo) – Pronóstico de la industria hasta 2035
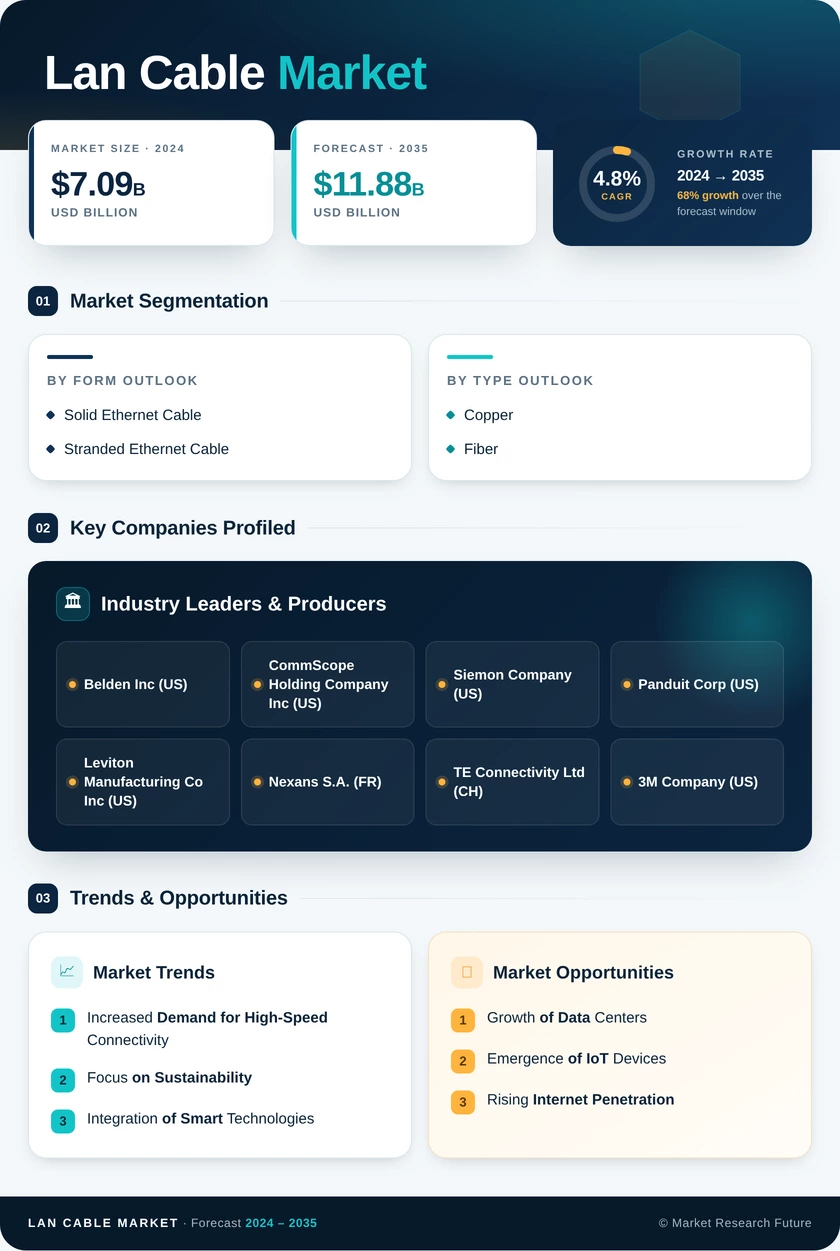
LAN Cable Market
Market Size
Forecast Period2025 - 2035
CAGR (2025 - 2035)4.8%
2024 Market Size$ 7.09 Billion
2025 Market Size$ 7.43 Billion
2035 Market Size$ 11.88 Billion
Key Players
Belden Inc
CommScope Holding Company Inc
Siemon Company
Panduit Corp
Leviton Manufacturing Co Inc
Nexans S.A.
Opportunities
  • Growth of Data Centers
  • Emergence of IoT Devices
  • Rising Internet Penetration
  1. 1 Resumen ejecutivo
    1. 1.1 Panorama general del mercado
  2. 2 Introducción al mercado
    1. 2.1 Panorama general
    2. 2.2 Alcance del estudio
    3. 2.3 Estructura del mercado
  3. 3 Metodología de investigación
  4. 4 Dinámica del mercado
    1. 4.1 Introducción
    2. 4.2 Impulsores
      1. 4.2.1 Creciente número de centros de datos
      2. 4.2.2 Demanda de transferencia de datos de alta velocidad
      3. 4.2.3 Análisis del impacto de los impulsores
    3. 4.3 Restricciones
      1. 4.3.1 Creciente demanda de conectividad inalámbrica
      2. 4.3.2 Uso de 5G en conjunto con LTE privado
    4. 4.4 Oportunidad
      1. 4.4.1 Crecientes proyectos de infraestructura y construcción
    5. 4.5 Tendencias
      1. 4.5.1 Alimentación a través de Ethernet
      2. 4.5.2 Conmutadores Ethernet
  5. 5 Análisis de factores del mercado
    1. 5.1 Cadena de suministro Análisis
      1. 5.1.1 Material y Proveedores de componentes
      2. 5.1.2 Integradores de sistemas
      3. 5.1.3 Distribuidores
      4. 5.1.4 Usuarios finales
    2. 5.2 Modelo de las cinco fuerzas de Porter
      1. 5.2.1 Amenaza de nuevos participantes
      2. 5.2.2 Poder de negociación de los proveedores
      3. 5.2.3 Poder de negociación de los compradores
      4. 5.2.4 Amenaza de sustitutos
      5. 5.2.5 Intensidad de la rivalidad
  6. 6 Mercado global de cables LAN, por tipo
    1. 6.1 Descripción general
    2. 6.2 Cable Cat 6
    3. 6.3 Cable Cat 6a
    4. 6.4 Cable Cat 7
    5. 6.5 Cable Cat 5
    6. 6.6 Cable Cat 5e
  7. 7 Mercado global de cables LAN, por aplicación
    1. 7.1 Descripción general
    2. 7.2 Uso doméstico
    3. 7.3 Uso en oficina
    4. 7.4 Uso industrial Uso
  8. 8 Mercado global de cables LAN por región
    1. 8.1 Descripción general
    2. 8.2 Norteamérica
      1. 8.2.1 Estimaciones y pronósticos del mercado por país
      2. 8.2.2 Estimaciones y pronósticos del mercado por tipo
      3. 8.2.3 Estimaciones y pronósticos del mercado por aplicación
      4. 8.2.4 EE. UU.
        1. 8.2.4.1 Estimaciones y pronósticos del mercado por tipo
        2. 8.2.4.2 Estimaciones y pronósticos del mercado por aplicación
      5. 8.2.5 Canadá
        1. 8.2.5.1 Estimaciones y pronósticos del mercado por tipo
        2. 8.2.5.2 Estimaciones y pronósticos del mercado por aplicación
      6. 8.2.6 México
        1. 8.2.6.1 Estimaciones y pronósticos del mercado por tipo
        2. 8.2.6.2 Estimaciones y pronósticos del mercado por aplicación
    3. 8.3 Europa
      1. 8.3.1 Estimaciones y pronósticos del mercado por país
      2. 8.3.2 Estimaciones del mercado y pronóstico, por tipo
      3. 8.3.3 Estimaciones y pronósticos de mercado, por aplicación
      4. 8.3.4 Reino Unido
        1. 8.3.4.1 Estimaciones y pronósticos de mercado, por tipo
        2. 8.3.4.2 Estimaciones y pronósticos de mercado, por aplicación
      5. 8.3.5 Alemania
        1. 8.3.5.1 Estimaciones y pronósticos de mercado, por tipo
        2. 8.3.5.2 Estimaciones y pronósticos de mercado, por aplicación
      6. 8.3.6 Francia
        1. 8.3.6.1 Estimaciones y pronósticos de mercado, por tipo
        2. 8.3.6.2 Estimaciones y pronósticos de mercado, por aplicación
      7. 8.3.7 Italia
        1. 8.3.7.1 Estimaciones y pronósticos de mercado, por tipo
        2. 8.3.7.2 Estimaciones y pronósticos de mercado, por aplicación
      8. 8.3.8 España
        1. 8.3.8.1 Estimaciones y pronósticos de mercado, por tipo
        2. 8.3.8.2 Estimaciones y pronósticos de mercado, por Aplicación
      9. 8.3.9 Resto de Europa
        1. 8.3.9.1 Estimaciones y pronósticos de mercado, por tipo
        2. 8.3.9.2 Estimaciones y pronósticos de mercado, por aplicación
    4. 8.4 Asia-Pacífico
      1. 8.4.1 Estimaciones y pronósticos de mercado, por país
      2. 8.4.2 Estimaciones y pronósticos de mercado, por tipo
      3. 8.4.3 Estimaciones y pronósticos de mercado, por aplicación
      4. 8.4.4 China
        1. 8.4.3.1 Estimaciones y pronósticos de mercado, por tipo
        2. 8.4.3.2 Estimaciones y pronósticos de mercado, por aplicación
      5. 8.4.5 Japón
        1. 8.4.5.1 Estimaciones y pronósticos de mercado, por tipo
        2. 8.4.5.2 Estimaciones y pronósticos de mercado, por aplicación
      6. 8.4.6 India
        1. 8.4.6.1 Estimaciones y pronósticos de mercado, por tipo
        2. 8.4.6.2 Estimaciones y pronósticos de mercado, por Aplicación
      7. 8.4.7 Resto de Asia y el Pacífico
        1. 8.4.7.1 Estimaciones y pronósticos del mercado, por tipo
        2. 8.4.7.2 Estimaciones y pronósticos del mercado, por aplicación
    5. 8.5 Resto del mundo
      1. 8.5.1 Estimaciones y pronósticos del mercado, por región
      2. 8.5.2 Estimaciones y pronósticos del mercado, por tipo
      3. 8.5.3 Estimaciones y pronósticos del mercado, por aplicación
      4. 8.5.4 Oriente Medio y África
        1. 8.5.4.1 Estimaciones y pronósticos del mercado, por tipo
        2. 8.5.4.2 Estimaciones y pronósticos del mercado, por aplicación
      5. 8.5.5 Sudamérica
        1. 8.5.5.1 Estimaciones y pronósticos del mercado, por tipo
        2. 8.5.5.2 Estimaciones y pronósticos del mercado, por aplicación
  9. 9 Panorama competitivo
    1. 9.1 Descripción general competitiva
    2. 9.2 Desarrollos clave y Estrategias de crecimiento
      1. 9.2.1 Lanzamiento/Implementación de nuevos productos
      2. 9.2.2 Empresas conjuntas/Acuerdos
    3. 9.3 Análisis comparativo competitivo
  10. 10 Perfiles de empresas
    1. 10.1 Black Box Corporation
      1. 10.1.1 Descripción general de la empresa
      2. 10.1.2 Descripción financiera
      3. 10.1.3 Productos ofrecidos
      4. 10.1.4 Desarrollos clave
      5. 10.1.5 Análisis FODA
      6. 10.1.6 Estrategias clave
    2. 10.2 FS.Com Inc
      1. 10.2.1 Descripción general de la empresa
      2. 10.2.2 Descripción financiera
      3. 10.2.3 Productos ofrecidos
      4. 10.2.4 Desarrollos clave
      5. 10.2.5 Análisis FODA
    3. 10.3 Otscable.Com Co.Ltd
      1. 10.3.1 Empresa Descripción general
      2. 10.3.2 Descripción financiera
      3. 10.3.3 Productos ofrecidos
      4. 10.3.4 Desarrollos clave
      5. 10.3.5 Análisis FODA
    4. 10.4 Infinite Electronics International, Inc.
      1. 10.4.1 Descripción general de la empresa
      2. 10.4.2 Descripción financiera
      3. 10.4.3 Productos ofrecidos
      4. 10.4.4 Desarrollos clave
      5. 10.4.5 Análisis FODA
    5. 10.5 Belden Inc.
      1. 10.5.1 Descripción general de la empresa
      2. 10.5.2 Descripción financiera
      3. 10.5.3 Productos ofrecidos
      4. 10.5.4 Desarrollos clave
      5. 10.5.5 Análisis FODA
      6. 10.5.6 Estrategias clave
    6. 10.6 Hitachi, Ltd.
      1. 10.6.1 Descripción general de la empresa
      2. 10.6.2 Información financiera Descripción general
      3. 10.6.3 Productos ofrecidos
      4. 10.6.4 Desarrollos clave
      5. 10.6.5 Análisis FODA
      6. 10.6.6 Estrategias clave
    7. 10.7 Nexans SA
      1. 10.7.1 Descripción general de la empresa
      2. 10.7.2 Descripción financiera
      3. 10.7.3 Productos ofrecidos
      4. 10.7.4 Desarrollos clave
      5. 10.7.5 Análisis FODA
      6. 10.7.6 Estrategias clave
    8. 10.8 DBA Primus Cable
      1. 10.8.1 Descripción general de la empresa
      2. 10.8.2 Descripción financiera
      3. 10.8.3 Productos ofrecidos
      4. 10.8.4 Desarrollos clave
      5. 10.8.5 Análisis FODA
      6. 10.8.6 Estrategias clave
    9. 10.9 Huzhou Shumai Cable Co., Ltd
      1. 10.9.1 Descripción general de la empresa
      2. 10.9.2 Descripción financiera
      3. 10.9.3 Productos ofrecidos
      4. 10.9.4 Desarrollos clave
      5. 10.9.5 Análisis FODA
      6. 10.9.6 Estrategias clave
    10. 10.1 Leoni AG
      1. 10.10.1 Descripción general de la empresa
      2. 10.10.2 Descripción financiera
      3. 10.10.3 Productos ofrecidos
      4. 10.10.4 Desarrollos clave
      5. 10.10.5 Análisis FODA
      6. 10.10.6 Estrategias clave
    11. 10.11 General Cable Technologies Corporation
      1. 10.11.1 Descripción general de la empresa
      2. 10.11.2 Descripción financiera
      3. 10.11.3 Productos ofrecidos
      4. 10.11.4 Desarrollos clave
      5. 10.11.5 Análisis FODA Análisis
      6. 10.11.6 Estrategias clave
  11. 11 LISTA DE TABLAS
    1. TABLA 1 SINOPSIS DEL MERCADO: MERCADO DE CABLE LAN
    2. TABLA 2 MERCADO GLOBAL DE CABLE LAN, POR TIPO, 2024-2032 (MILLONES DE USD)
    3. TABLA 3 MERCADO GLOBAL DE CABLE LAN, POR APLICACIÓN, 2024-2032 (MILLONES DE USD)
    4. TABLA 4 MERCADO GLOBAL DE CABLE LAN, POR REGIÓN, 2024-2032 (MILLONES DE USD)
    5. TABLA 5 MERCADO DE CABLE LAN DE AMÉRICA DEL NORTE, POR PAÍS, 2024-2032 (MILLONES DE USD)
    6. TABLA 6 AMÉRICA DEL NORTE: MERCADO DE CABLE LAN, POR TIPO, 2024-2032 (MILLONES DE USD)
    7. TABLA 7 MERCADO DE LAN DE AMÉRICA DEL NORTE MERCADO DE CABLES, POR APLICACIÓN, 2024-2032 (MILLONES DE USD)
    8. TABLA 8 MERCADO DE CABLES DE LAN DE EE. UU., POR TIPO, 2024-2032 (MILLONES DE USD)
    9. TABLA 9 MERCADO DE CABLES DE LAN DE EE. UU., POR APLICACIÓN, 2024-2032 (MILLONES DE USD)
    10. TABLA 10 MERCADO DE CABLES DE LAN DE CANADÁ, POR TIPO, 2024-2032 (MILLONES DE USD)
    11. TABLA 11 MERCADO DE CABLES DE LAN DE CANADÁ, POR APLICACIÓN, 2024-2032 (MILLONES DE USD)
    12. TABLA 12 MERCADO DE CABLES DE LAN DE MÉXICO, POR TIPO, 2024-2032 (MILLONES DE USD)
    13. TABLA 13 MERCADO DE CABLES DE LAN DE MÉXICO, POR APLICACIÓN, 2024-2032 (MILLONES DE USD)
    14. TABLA 14 EUROPA MERCADO DE CABLES DE LAN POR PAÍS, 2024-2032 (MILLONES DE USD)
    15. TABLA 15 MERCADO DE CABLES DE LAN EN EUROPA, POR TIPO, 2024-2032 (MILLONES DE USD)
    16. TABLA 16 MERCADO DE CABLES DE LAN EN EUROPA, POR APLICACIÓN, 2024-2032 (MILLONES DE USD)
    17. TABLA 17 MERCADO DE CABLES DE LAN EN EL REINO UNIDO, POR TIPO, 2024-2032 (MILLONES DE USD)
    18. TABLA 18 MERCADO DE CABLES DE LAN EN EL REINO UNIDO, POR APLICACIÓN, 2024-2032 (MILLONES DE USD)
    19. TABLA 19 MERCADO DE CABLES DE LAN EN ALEMANIA, POR TIPO, 2024-2032 (MILLONES DE USD)
    20. TABLA 20 MERCADO DE CABLES DE LAN EN ALEMANIA, POR APLICACIÓN, 2024-2032 (MILLONES DE USD)
    21. TABLA 21 MERCADO DE CABLE LAN EN FRANCIA, POR TIPO, 2024-2032 (MILLONES DE USD)
    22. TABLA 22 MERCADO DE CABLE LAN EN FRANCIA, POR APLICACIÓN, 2024-2032 (MILLONES DE USD)
    23. TABLA 23 MERCADO DE CABLE LAN EN ITALIA, POR TIPO, 2024-2032 (MILLONES DE USD)
    24. TABLA 24 MERCADO DE CABLE LAN EN ITALIA, POR APLICACIÓN, 2024-2032 (MILLONES DE USD)
    25. TABLA 25 MERCADO DE CABLE LAN EN ESPAÑA, POR TIPO, 2024-2032 (MILLONES DE USD)
    26. TABLA 26 MERCADO DE CABLE LAN EN ESPAÑA, POR APLICACIÓN, 2024-2032 (MILLONES DE USD)
    27. TABLA 27 MERCADO DE CABLE LAN EN EL RESTO DE EUROPA, POR TIPO, 2024-2032 (MILLONES DE USD) MILLONES)
    28. TABLA 28 RESTO DE EUROPA MERCADO DE CABLE LAN, POR APLICACIÓN, 2024-2032 (MILLONES DE USD)
    29. TABLA 29 MERCADO DE CABLE LAN DE ASIA-PACÍFICO, POR PAÍS, 2024-2032 (MILLONES DE USD)
    30. TABLA 30 MERCADO DE CABLE LAN DE ASIA-PACÍFICO, POR TIPO, 2024-2032 (MILLONES DE USD)
    31. TABLA 31 MERCADO DE CABLE LAN DE ASIA-PACÍFICO, POR APLICACIÓN, 2024-2032 (MILLONES DE USD)
    32. TABLA 32 MERCADO DE CABLE LAN DE CHINA, POR TIPO, 2024-2032 (MILLONES DE USD)
    33. TABLA 33 MERCADO DE CABLE LAN DE CHINA, POR APLICACIÓN, 2024-2032 (MILLONES DE USD)
    34. TABLA 34 MERCADO DE CABLE LAN DE JAPÓN, POR TIPO, 2024-2032 (USD MILLONES)
    35. TABLA 35 MERCADO DE CABLE LAN DE JAPÓN, POR APLICACIÓN, 2024-2032 (USD MILLONES)
    36. TABLA 36 MERCADO DE CABLE LAN DE INDIA, POR TIPO, 2024-2032 (USD MILLONES)
    37. TABLA 37 MERCADO DE CABLE LAN DE INDIA, POR APLICACIÓN, 2024-2032 (USD MILLONES)
    38. TABLA 38 RESTO DEL MERCADO DE CABLE LAN DE ASIA-PACÍFICO, POR TIPO, 2024-2032 (USD MILLONES)
    39. TABLA 39 RESTO DEL MERCADO DE CABLE LAN DE ASIA-PACÍFICO, POR APLICACIÓN, 2024-2032 (USD MILLONES)
    40. TABLA 40 RESTO DEL MERCADO DE CABLE LAN DEL MUNDO, POR REGIÓN, 2024-2032 (USD MILLONES)
    41. TABLA 41 RESTO DEL MERCADO MUNDIAL DE CABLE LAN, POR TIPO, 2024-2032 (MILLONES DE USD)
    42. TABLA 42 RESTO DEL MERCADO MUNDIAL DE CABLE LAN, POR APLICACIÓN, 2024-2032 (MILLONES DE USD)
    43. TABLA 43 MERCADO DE CABLE LAN DE ORIENTE MEDIO Y ÁFRICA, POR TIPO, 2024-2032 (MILLONES DE USD)
    44. TABLA 44 ORIENTE MEDIO Y MERCADO DE CABLES LAN EN ÁFRICA, POR APLICACIÓN, 2024-2032 (MILLONES DE USD)
    45. TABLA 45 MERCADO DE CABLES LAN EN SUDAMÉRICA, POR TIPO, 2024-2032 (MILLONES DE USD)
    46. TABLA 46 MERCADO DE CABLES LAN EN SUDAMÉRICA, POR APLICACIÓN, 2024-2032 (MILLONES DE USD)
    47. TABLA 47 LANZAMIENTO/DESPLIEGUE DE NUEVOS PRODUCTOS
    48. TABLA 48 EMPRESAS CONJUNTAS/ACUERDOS
    49. TABLA 49 CAJA NEGRA: PRODUCTOS OFRECIDOS
    50. TABLA 50 CAJA NEGRA: DESARROLLOS CLAVE
    51. TABLA 51 FS.COM INC: PRODUCTOS OFRECIDOS
    52. TABLA 52 FS.COM INC: DESARROLLOS CLAVE
    53. TABLA 53 OTSCABLE: PRODUCTOS OFRECIDOS
    54. TABLA 54 L-COM: PRODUCTOS OFRECIDOS
    55. TABLA 55 L-COM: DESARROLLOS CLAVE
    56. TABLA 56 BELDEN INC.: PRODUCTOS OFRECIDOS
    57. TABLA 57 BELDEN INC. DESARROLLOS CLAVE
    58. TABLA 58 HITACHI LTD: PRODUCTOS OFRECIDOS
    59. TABLA 59 HITACHI LTD: DESARROLLOS CLAVE
    60. TABLA 60 NEXANS SA: PRODUCTOS OFRECIDOS
    61. TABLA 61 DBA PRIMUS CABLE: PRODUCTOS OFRECIDOS
    62. TABLA 62 HUZHOU SHUMAI CABLE CO., LTD: PRODUCTOS OFRECIDOS
    63. TABLA 63 LEONI AG: PRODUCTOS OFRECIDOS
    64. TABLA 64 GENERAL CABLE TECHNOLOGIES CORPORATION: PRODUCTOS OFRECIDOS
  12. 12 LISTA DE FIGURAS
    1. FIGURA 1 ESTRUCTURA DEL MERCADO: RED DE ALTA WAN GLOBAL MERCADO DE CABLES
    2. FIGURA 2 ENFOQUES DE ABAJO A ARRIBA Y DE ARRIBA A ABAJO
    3. FIGURA 3 ANÁLISIS DE LA DINÁMICA DEL MERCADO GLOBAL DE CABLES DE LAN
    4. FIGURA 4 ANÁLISIS DEL IMPACTO DE LOS IMPULSORES: MERCADO GLOBAL DE CABLES DE LAN
    5. FIGURA 5 ANÁLISIS DEL IMPACTO DE LAS RESTRICCIONES: MERCADO GLOBAL DE CABLES DE LAN
    6. FIGURA 6 ANÁLISIS DE LA CADENA DE SUMINISTRO: MERCADO GLOBAL DE CABLES DE LAN
    7. FIGURA 7 ANÁLISIS DE LAS CINCO FUERZAS DE PORTER: MERCADO GLOBAL DE CABLES DE LAN
    8. FIGURA 8 MERCADO GLOBAL DE CABLES DE LAN, POR TIPO, 2020 (% PARTICIPACIÓN)
    9. FIGURA 9 MERCADO GLOBAL DE CABLES DE LAN, POR TIPO, 2024 VS 2032 (MILLONES DE USD)
    10. FIGURA 10 MERCADO MUNDIAL DE CABLES LAN, POR APLICACIÓN, 2020 (% PARTICIPACIÓN)
    11. FIGURA 11 MERCADO MUNDIAL DE CABLES LAN, POR APLICACIÓN, 2024 VS 2032 (USD MILLONES)
    12. FIGURA 12 MERCADO MUNDIAL DE CABLES LAN, POR REGIÓN, 2020 (%)
    13. FIGURA 13 MERCADO MUNDIAL DE CABLES LAN, POR REGIÓN, 2024 VS 2032 (USD MILLONES)
    14. FIGURA 14 MERCADO DE CABLES LAN EN AMÉRICA DEL NORTE, POR PAÍS, 2024 VS 2032 (USD MILLONES)
    15. FIGURA 15 AMÉRICA DEL NORTE: MERCADO DE CABLES LAN, POR TIPO, 2024 VS 2032 (USD MILLONES)
    16. FIGURA 16 MERCADO DE CABLES LAN EN AMÉRICA DEL NORTE, POR APLICACIÓN, 2024 VS 2032 (USD MILLONES)
    17. FIGURA 17 MERCADO DE CABLE LAN EN EUROPA, POR PAÍS, 2024 VS 2032 (USD MILLONES)
    18. FIGURA 18 MERCADO DE CABLE LAN EN EUROPA, POR TIPO, 2024 VS 2032 (USD MILLONES)
    19. FIGURA 19 MERCADO DE CABLE LAN EN EUROPA, POR APLICACIÓN, 2024 VS 2032 (USD MILLONES)
    20. FIGURA 20 MERCADO DE CABLE LAN EN ASIA-PACÍFICO, POR PAÍS, 2024 VS 2032 (USD MILLONES)
    21. FIGURA 21 MERCADO DE CABLE LAN EN ASIA-PACÍFICO, POR TIPO, 2024 VS 2032 (USD MILLONES)
    22. FIGURA 22 MERCADO DE CABLE LAN EN ASIA-PACÍFICO, POR APLICACIÓN, 2024 VS 2032 (USD MILLONES)
    23. FIGURA 23 RESTO DEL MERCADO MUNDIAL DE CABLE LAN, POR REGIÓN, 2024 VS 2032 (USD MILLONES)
    24. FIGURA 24 RESTO DEL MERCADO MUNDIAL DE CABLE LAN, POR TIPO, 2024 VS 2032 (USD MILLONES)
    25. FIGURA 25 RESTO DEL MERCADO MUNDIAL DE CABLE LAN, POR APLICACIÓN, 2024 VS 2032 (USD MILLONES)
    26. FIGURA 26 ANÁLISIS COMPETITIVO DE LOS PRINCIPALES ACTORES
    27. FIGURA 27 CAJA NEGRA: INSTANTÁNEA DE LA INFORMACIÓN FINANCIERA
    28. FIGURA 28 CAJA NEGRA: ANÁLISIS FODA
    29. FIGURA 29 FS.COM INC: FODA ANÁLISIS
    30. FIGURA 30 OTSCABLE: ANÁLISIS FODA
    31. FIGURA 31 L-COM: ANÁLISIS FODA
    32. FIGURA 32 BELDEN INC.: RESUMEN FINANCIERO
    33. FIGURA 33 BELDEN INC: ANÁLISIS FODA
    34. FIGURA 34 HITACHI LTD: RESUMEN FINANCIERO
    35. FIGURA 35 HITACHI LTD: ANÁLISIS FODA
    36. FIGURA 36 NEXANS SA: RESUMEN FINANCIERO
    37. FIGURA 37 NEXANS SA: ANÁLISIS FODA
    38. FIGURA 38 PRIMUS CABLE: ANÁLISIS FODA
    39. FIGURA 39 HUZHOU SHUMAI CABLE CO., LTD: ANÁLISIS FODA
    40. FIGURA 40 LEONI AG: RESUMEN FINANCIERO
    41. FIGURA 41 LEONI AG: ANÁLISIS FODA
    42. FIGURA 42 GENERAL CABLE TECHNOLOGIES CORPORATION: RESUMEN FINANCIERO
    43. FIGURA 43 GENERAL CABLE TECHNOLOGIES CORPORATION: ANÁLISIS FODA

Segmentación del mercado de cables LAN

Perspectiva del tipo de cable LAN(Miles de millones de USD, 2018-2032)

  • Cobre

  • Fibra

Perspectiva de la forma del cable LAN(Miles de millones de USD, 2018-2032)

  • Cable Ethernet sólido

  • Cable Ethernet trenzado

Perspectiva regional del cable LAN(Miles de millones de USD, 2018-2032)

  • Perspectiva de Norteamérica (Miles de millones de USD, 2018-2032)

    • Cable LAN de Norteaméricapor tipo

      • Cobre

      • Fibra

    • Cable LAN de Norteaméricapor formato

      • Cable Ethernet sólido

      • Cable Ethernet trenzado

    • Perspectivas para EE. UU. (miles de millones de USD, 2018-2032)

    • Cable LAN de EE. UU.por Tipo

      • Cobre

      • Fibra

    • Cable LAN de EE. UU. por formato

      • Cable Ethernet sólido

      • Cable Ethernet trenzado

    • Perspectivas para Canadá (miles de millones de USD, 2018-2032)

    • Cable LAN de Canadá por tipo

      • Cobre

      • Fibra

    • Cable LAN de Canadá por Forma

      • Cable Ethernet sólido

      • Cable Ethernet trenzado

  • Perspectivas en Europa (miles de millones de USD, 2018-2032)

    • Cable LAN en Europa por tipo

      • Cobre

      • Fibra

    • Cable LAN en Europa por forma

      • Cable Ethernet sólido

      • Ethernet trenzado Cable

    • Alemania Perspectivas (miles de millones de USD, 2018-2032)

    • AlemaniaCable LAN por tipo

      • Cobre

      • Fibra

    • AlemaniaCable LAN por formato

      • Cable Ethernet sólido

      • Cable Ethernet trenzado

    • Francia Perspectivas (miles de millones de USD, 2018-2032)

    • Cable LAN de Franciapor tipo

      • Cobre

      • Fibra

    • Cable LAN de Franciapor formato

      • Cable Ethernet sólido

      • Cable Ethernet trenzado

    • Perspectivas para el Reino Unido (miles de millones de USD, 2018-2032)

    • Cable LAN del Reino Unidopor Tipo

      • Cobre

      • Fibra

    • Reino UnidoCable LAN por formato

      • Cable Ethernet sólido

      • Cable Ethernet trenzado

    • Perspectivas para Italia (miles de millones de USD, 2018-2032)

    • ITALIACable LAN por tipo

      • Cobre

      • Fibra

    • ITALIACable LAN por Formulario

      • Cable Ethernet sólido

      • Cable Ethernet trenzado

    • Perspectivas para ESPAÑA (miles de millones de USD, 2018-2032)

    • Cable LAN para España por tipo

      • Cobre

      • Fibra

    • Cable LAN para España por formato

      • Cable Ethernet sólido

      • Cable Ethernet trenzado

    • Perspectivas para el resto de Europa (USD) Miles de millones, 2018-2032)

    • Resto de EuropaCable LAN por tipo

      • Cobre

      • Fibra

    • Resto de EuropaCable LAN por formato

      • Cable Ethernet sólido

      • Cable Ethernet trenzado

  • Perspectivas para Asia-Pacífico (miles de millones de USD, 2018-2032)

    • Asia-PacíficoLAN Cable por tipo

    • Cobre

    • Fibra

  • Cable LAN Asia-Pacífico por formato

    • Cable Ethernet sólido

    • Cable Ethernet trenzado

  • Perspectivas para China (miles de millones de USD, 2018-2032)

  • Cable LAN de Chinapor Tipo

    • Cobre

    • Fibra

  • Cable LAN de China por forma

    • Cable Ethernet sólido

    • Cable Ethernet trenzado

  • Perspectivas para Japón (miles de millones de USD, 2018-2032)

  • Cable LAN de Japón por tipo

    • Cobre

    • Fibra

  • Cable LAN de Japón por Formulario

    • Cable Ethernet sólido

    • Cable Ethernet trenzado

  • Perspectivas para India (miles de millones de USD, 2018-2032)

  • Cable LAN para India por tipo

    • Cobre

    • Fibra

  • Cable LAN para India por formato

    • Cable Ethernet sólido

    • Cable Ethernet trenzado

  • Perspectivas para Australia (USD Miles de millones, 2018-2032)

  • Cable LAN de Australiapor tipo

    • Cobre

    • Fibra

  • Cable LAN de Australiapor forma

    • Cable Ethernet sólido

    • Cable Ethernet trenzado

  • Perspectivas para el resto de Asia-Pacífico (miles de millones de USD, 2018-2032)

  • Cable LAN del resto de Asia-Pacíficopor Tipo

    • Cobre

    • Fibra

  • Cable LAN del resto de Asia-Pacífico por formato

    • Cable Ethernet sólido

    • Cable Ethernet trenzado

Perspectivas para el resto del mundo (miles de millones de USD, 2018-2032)Cable LAN del resto del mundo por formato TipoCobreFibraResto del mundoCable LAN por formatoCable Ethernet sólidoCable Ethernet trenzadoPerspectivas para Oriente Medio (miles de millones de USD, 2018-2032)Cable LAN para Oriente Medio por tipoCobreFibraOriente Medio Cable LAN por formato Cable Ethernet sólidoCable Ethernet trenzadoPerspectivas para África (miles de millones de USD, 2018-2032)Cable LAN en África por tipo CobreFibraCable LAN en África por formatoCable Ethernet sólidoEthernet trenzado CablePanorama de América Latina (miles de millones de USD, 2018-2032)Cable LAN en América Latina por tipoCobreFibraCable LAN en América Latina por formatoCable Ethernet sólidoCable Ethernet trenzado


Download PDF ×

We do not share your information with anyone. However, we may send you emails based on your report interest from time to time. You may contact us at any time to opt-out.