Segmentación del mercado sanitario
Atención médica por aplicación (USD Mil millones, 2025-2035)
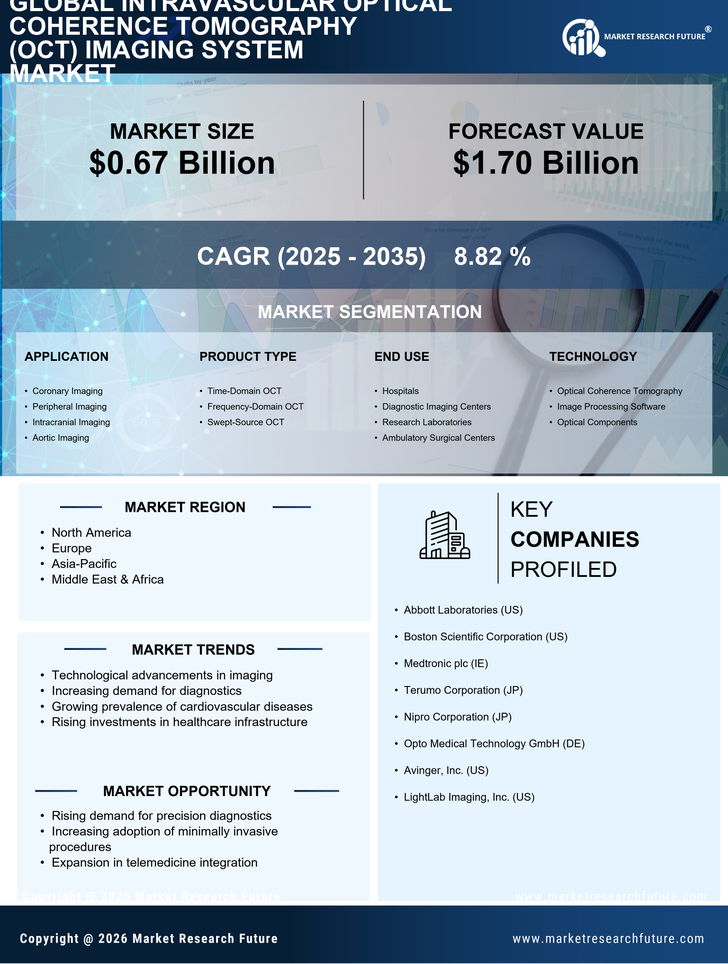
- Imágenes coronarias
- Imágenes periféricas
- Imágenes intracraneales
- Imágenes aórticas
Atención médica por tipo de producto (USD mil millones, 2025-2035)
- OCT en el dominio del tiempo
- OCT en el dominio de la frecuencia
- OCT de fuente barrida
Atención sanitaria por uso final (USD Miles de millones, 2025-2035)
- hospitales
- Centros de Diagnóstico por Imágenes
- Laboratorios de investigación
- Centros de cirugía ambulatoria
Atención sanitaria por tecnología (USD Mil millones, 2025-2035)
- Tomografía de coherencia óptica
- Software de procesamiento de imágenes
- Componentes ópticos