Segmentación del mercado de alimentos, bebidas y nutrición
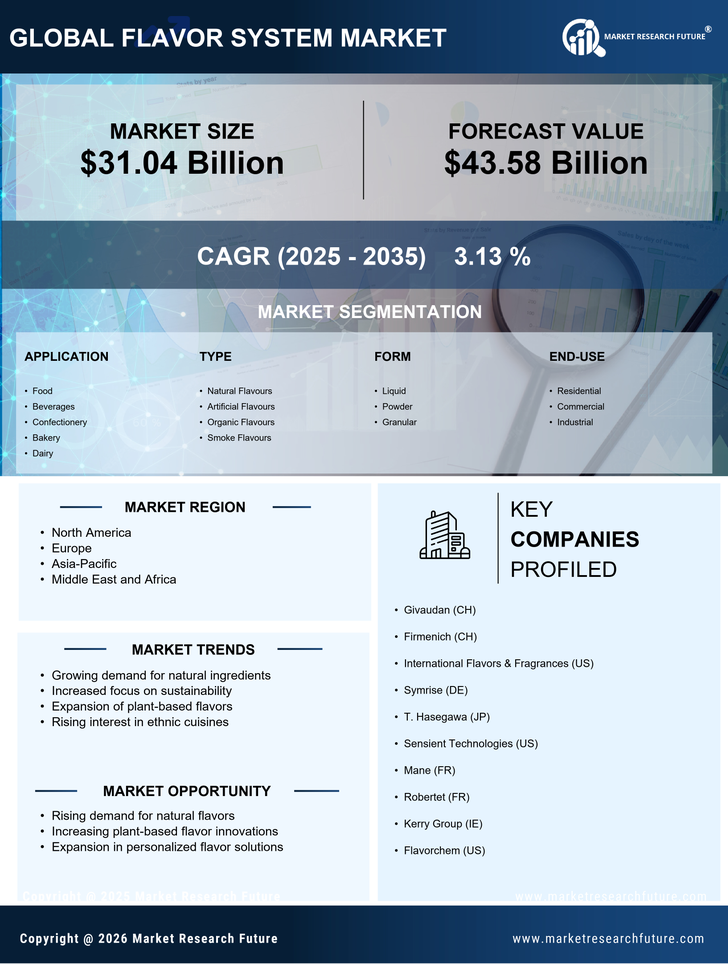
Alimentos, bebidas y nutrición por aplicación (USD mil millones, 2025-2035)
- Alimento
- Bebidas
- Confitería
- Panadería
- Lácteos
Alimentos, bebidas y nutrición por tipo (USD Miles de millones, 2025-2035)
- Sabores naturales
- Sabores artificiales
- Sabores orgánicos
- Sabores de humo
Alimentos, bebidas y nutrición por formulario (USD mil millones, 2025-2035)
- Líquido
- Polvo
- Granular
Alimentos, bebidas y nutrición por uso final (USD mil millones, 2025-2035)
- Residencial
- Comercial
- Industrial