Request Free Sample ×

Kindly complete the form below to receive a free sample of this Report

* Please use a valid business email

Leading companies partner with us for data-driven Insights

clients tt-cursor
Hero Background

Mercado de Adaptadores Ethernet

ID: MRFR/SEM/32746-HCR
100 Pages
Nirmit Biswas
Last Updated: April 06, 2026

Informe de Investigación del Mercado de Adaptadores Ethernet Por Tipo (Adaptadores Ethernet USB, Adaptadores Ethernet PCI Express, Adaptadores Ethernet Thunderbolt, Adaptadores Ethernet Integrados), Por Velocidad de Conexión (10/100 Mbps, 1 Gbps, 10 Gbps, 40 Gbps), Por Uso Final (Residencial, Comercial, Industrial), Por Factor de Forma (Externo, Interno) y Por Regional (América del Norte, Europa, América del Sur, Asia-Pacífico, Medio Oriente y África) - Pronóstico hasta 2035

Compartir
Download PDF ×

We do not share your information with anyone. However, we may send you emails based on your report interest from time to time. You may contact us at any time to opt-out.

Ethernet Adapter Market Infographic
Purchase Options
  1. 1 SECCIÓN I: RESUMEN EJECUTIVO Y PUNTOS CLAVE\n\n
    1. 1.1 RESUMEN EJECUTIVO\n \n
      1. 1.1.1 Visión General del Mercado\n \n
      2. 1.1.2 Hallazgos Clave\n \n
      3. 1.1.3 Segmentación del Mercado\n \n
      4. 1.1.4 Panorama Competitivo\n \n
      5. 1.1.5 Desafíos y Oportunidades\n \n
      6. 1.1.6 Perspectivas Futuras\n2 SECCIÓN II: ALCANCE, METODOLOGÍA Y ESTRUCTURA DEL MERCADO\n
    2. 2.1 INTRODUCCIÓN AL MERCADO\n \n
      1. 2.1.1 Definición\n \n
      2. 2.1.2 Alcance del estudio\n \n \n
        1. 2.1.2.1 Objetivo de la Investigación\n \n \n
        2. 2.1.2.2 Suposición\n \n \n
        3. 2.1.2.3 Limitaciones\n
    3. 2.2 METODOLOGÍA DE INVESTIGACIÓN\n \n
      1. 2.2.1 Visión General\n \n
      2. 2.2.2 Minería de Datos\n \n
      3. 2.2.3 Investigación Secundaria\n \n
      4. 2.2.4 Investigación Primaria\n \n \n
        1. 2.2.4.1 Entrevistas Primarias y Proceso de Recopilación de Información\n \n \n
        2. 2.2.4.2 Desglose de los Respondientes Primarios\n \n
      5. 2.2.5 Modelo de Pronóstico\n \n
      6. 2.2.6 Estimación del Tamaño del Mercado\n \n \n
        1. 2.2.6.1 Enfoque de Arriba Hacia Abajo\n \n \n
        2. 2.2.6.2 Enfoque de Abajo Hacia Arriba\n \n
      7. 2.2.7 Triangulación de Datos\n \n
      8. 2.2.8 Validación\n3 SECCIÓN III: ANÁLISIS CUALITATIVO\n
    4. 3.1 DINÁMICAS DEL MERCADO\n \n
      1. 3.1.1 Visión General\n \n
      2. 3.1.2 Impulsores\n \n
      3. 3.1.3 Restricciones\n \n
      4. 3.1.4 Oportunidades\n
    5. 3.2 ANÁLISIS DE FACTORES DEL MERCADO\n \n
      1. 3.2.1 Análisis de la Cadena de Valor\n \n
      2. 3.2.2 Análisis de las Cinco Fuerzas de Porter\n \n \n
        1. 3.2.2.1 Poder de Negociación de los Proveedores\n \n \n
        2. 3.2.2.2 Poder de Negociación de los Compradores\n \n \n
        3. 3.2.2.3 Amenaza de Nuevos Entrantes\n \n \n
        4. 3.2.2.4 Amenaza de Sustitutos\n \n \n
        5. 3.2.2.5 Intensidad de la Rivalidad\n \n
      3. 3.2.3 Análisis del Impacto del COVID-19\n \n \n
        1. 3.2.3.1 Análisis del Impacto en el Mercado\n \n \n
        2. 3.2.3.2 Impacto Regional\n \n \n
        3. 3.2.3.3 Análisis de Oportunidades y Amenazas\n4 SECCIÓN IV: ANÁLISIS CUANTITATIVO\n
    6. 4.1 Semiconductores y Electrónica, POR Tipo (USD Mil millones)\n \n
      1. 4.1.1 Adaptadores Ethernet USB\n \n
      2. 4.1.2 Adaptadores Ethernet PCI Express\n \n
      3. 4.1.3 Adaptadores Ethernet Thunderbolt\n \n
      4. 4.1.4 Adaptadores Ethernet Integrados\n
    7. 4.2 Semiconductores y Electrónica, POR Velocidad de Conexión (USD Mil millones)\n \n
      1. 4.2.1 10/100 Mbps\n \n
      2. 4.2.2 1 Gbps\n \n
      3. 4.2.3 10 Gbps\n \n
      4. 4.2.4 40 Gbps\n
    8. 4.3 Semiconductores y Electrónica, POR Uso Final (USD Mil millones)\n \n
      1. 4.3.1 Residencial\n \n
      2. 4.3.2 Comercial\n \n
      3. 4.3.3 Industrial\n
    9. 4.4 Semiconductores y Electrónica, POR Factor de Forma (USD Mil millones)\n \n
      1. 4.4.1 Externo\n \n
      2. 4.4.2 Interno\n
    10. 4.5 Semiconductores y Electrónica, POR Región (USD Mil millones)\n \n
      1. 4.5.1 América del Norte\n \n \n
        1. 4.5.1.1 EE. UU.\n \n \n
        2. 4.5.1.2 Canadá\n \n
      2. 4.5.2 Europa\n \n \n
        1. 4.5.2.1 Alemania\n \n \n
        2. 4.5.2.2 Reino Unido\n \n \n
        3. 4.5.2.3 Francia\n \n \n
        4. 4.5.2.4 Rusia\n \n \n
        5. 4.5.2.5 Italia\n \n \n
        6. 4.5.2.6 España\n \n \n
        7. 4.5.2.7 Resto de Europa\n \n
      3. 4.5.3 APAC\n \n \n
        1. 4.5.3.1 China\n \n \n
        2. 4.5.3.2 India\n \n \n
        3. 4.5.3.3 Japón\n \n \n
        4. 4.5.3.4 Corea del Sur\n \n \n
        5. 4.5.3.5 Malasia\n \n \n
        6. 4.5.3.6 Tailandia\n \n \n
        7. 4.5.3.7 Indonesia\n \n \n
        8. 4.5.3.8 Resto de APAC\n \n
      4. 4.5.4 América del Sur\n \n \n
        1. 4.5.4.1 Brasil\n \n \n
        2. 4.5.4.2 México\n \n \n
        3. 4.5.4.3 Argentina\n \n \n
        4. 4.5.4.4 Resto de América del Sur\n \n
      5. 4.5.5 MEA\n \n \n
        1. 4.5.5.1 Países del CCG\n \n \n
        2. 4.5.5.2 Sudáfrica\n \n \n
        3. 4.5.5.3 Resto de MEA\n5 SECCIÓN V: ANÁLISIS COMPETITIVO\n
    11. 5.1 Panorama Competitivo\n \n
      1. 5.1.1 Visión General\n \n
      2. 5.1.2 Análisis Competitivo\n \n
      3. 5.1.3 Análisis de Participación de Mercado\n \n
      4. 5.1.4 Estrategia de Crecimiento Principal en Semiconductores y Electrónica\n \n
      5. 5.1.5 Comparación Competitiva\n \n
      6. 5.1.6 Principales Actores en Términos de Número de Desarrollos en Semiconductores y Electrónica\n \n
      7. 5.1.7 Principales desarrollos y estrategias de crecimiento\n \n \n
        1. 5.1.7.1 Lanzamiento de Nuevos Productos/Implementación de Servicios\n \n \n
        2. 5.1.7.2 Fusiones y Adquisiciones\n \n \n
        3. 5.1.7.3 Empresas Conjuntas\n \n
      8. 5.1.8 Matriz Financiera de los Principales Actores\n \n \n
        1. 5.1.8.1 Ventas e Ingresos Operativos\n \n \n
        2. 5.1.8.2 Gastos de I+D de los Principales Actores. 2023\n
    12. 5.2 Perfiles de Empresas\n \n
      1. 5.2.1 Intel Corporation (EE. UU.)\n \n \n
        1. 5.2.1.1 Visión General Financiera\n \n \n
        2. 5.2.1.2 Productos Ofrecidos\n \n \n
        3. 5.2.1.3 Principales Desarrollos\n \n \n
        4. 5.2.1.4 Análisis FODA\n \n \n
        5. 5.2.1.5 Estrategias Clave\n \n
      2. 5.2.2 TP-Link Technologies Co., Ltd. (CN)\n \n \n
        1. 5.2.2.1 Visión General Financiera\n \n \n
        2. 5.2.2.2 Productos Ofrecidos\n \n \n
        3. 5.2.2.3 Principales Desarrollos\n \n \n
        4. 5.2.2.4 Análisis FODA\n \n \n
        5. 5.2.2.5 Estrategias Clave\n \n
      3. 5.2.3 Netgear, Inc. (EE. UU.)\n \n \n
        1. 5.2.3.1 Visión General Financiera\n \n \n
        2. 5.2.3.2 Productos Ofrecidos\n \n \n
        3. 5.2.3.3 Principales Desarrollos\n \n \n
        4. 5.2.3.4 Análisis FODA\n \n \n
        5. 5.2.3.5 Estrategias Clave\n \n
      4. 5.2.4 D-Link Corporation (TW)\n \n \n
        1. 5.2.4.1 Visión General Financiera\n \n \n
        2. 5.2.4.2 Productos Ofrecidos\n \n \n
        3. 5.2.4.3 Principales Desarrollos\n \n \n
        4. 5.2.4.4 Análisis FODA\n \n \n
        5. 5.2.4.5 Estrategias Clave\n \n
      5. 5.2.5 ASUS Computer International (EE. UU.)\n \n \n
        1. 5.2.5.1 Visión General Financiera\n \n \n
        2. 5.2.5.2 Productos Ofrecidos\n \n \n
        3. 5.2.5.3 Principales Desarrollos\n \n \n
        4. 5.2.5.4 Análisis FODA\n \n \n
        5. 5.2.5.5 Estrategias Clave\n \n
      6. 5.2.6 Zyxel Communications Corp. (TW)\n \n \n
        1. 5.2.6.1 Visión General Financiera\n \n \n
        2. 5.2.6.2 Productos Ofrecidos\n \n \n
        3. 5.2.6.3 Principales Desarrollos\n \n \n
        4. 5.2.6.4 Análisis FODA\n \n \n
        5. 5.2.6.5 Estrategias Clave\n \n
      7. 5.2.7 Belkin International, Inc. (EE. UU.)\n \n \n
        1. 5.2.7.1 Visión General Financiera\n \n \n
        2. 5.2.7.2 Productos Ofrecidos\n \n \n
        3. 5.2.7.3 Principales Desarrollos\n \n \n
        4. 5.2.7.4 Análisis FODA\n \n \n
        5. 5.2.7.5 Estrategias Clave\n \n
      8. 5.2.8 StarTech.com Ltd. (CA)\n \n \n
        1. 5.2.8.1 Visión General Financiera\n \n \n
        2. 5.2.8.2 Productos Ofrecidos\n \n \n
        3. 5.2.8.3 Principales Desarrollos\n \n \n
        4. 5.2.8.4 Análisis FODA\n \n \n
        5. 5.2.8.5 Estrategias Clave\n \n
      9. 5.2.9 Linksys (EE. UU.)\n \n \n
        1. 5.2.9.1 Visión General Financiera\n \n \n
        2. 5.2.9.2 Productos Ofrecidos\n \n \n
        3. 5.2.9.3 Principales Desarrollos\n \n \n
        4. 5.2.9.4 Análisis FODA\n \n \n
        5. 5.2.9.5 Estrategias Clave\n
    13. 5.3 Apéndice\n \n
      1. 5.3.1 Referencias\n \n
      2. 5.3.2 Informes Relacionados\n6 LISTA DE FIGURAS\n
    14. 6.1 SINOPSIS DEL MERCADO\n
    15. 6.2 ANÁLISIS DEL MERCADO DE AMÉRICA DEL NORTE\n
    16. 6.3 ANÁLISIS DEL MERCADO DE EE. UU. POR TIPO\n
    17. 6.4 ANÁLISIS DEL MERCADO DE EE. UU. POR VELOCIDAD DE CONEXIÓN\n
    18. 6.5 ANÁLISIS DEL MERCADO DE EE. UU. POR USO FINAL\n
    19. 6.6 ANÁLISIS DEL MERCADO DE EE. UU. POR FACTOR DE FORMA\n
    20. 6.7 ANÁLISIS DEL MERCADO DE CANADÁ POR TIPO\n
    21. 6.8 ANÁLISIS DEL MERCADO DE CANADÁ POR VELOCIDAD DE CONEXIÓN\n
    22. 6.9 ANÁLISIS DEL MERCADO DE CANADÁ POR USO FINAL\n
    23. 6.10 ANÁLISIS DEL MERCADO DE CANADÁ POR FACTOR DE FORMA\n
    24. 6.11 ANÁLISIS DEL MERCADO DE EUROPA\n
    25. 6.12 ANÁLISIS DEL MERCADO DE ALEMANIA POR TIPO\n
    26. 6.13 ANÁLISIS DEL MERCADO DE ALEMANIA POR VELOCIDAD DE CONEXIÓN\n
    27. 6.14 ANÁLISIS DEL MERCADO DE ALEMANIA POR USO FINAL\n
    28. 6.15 ANÁLISIS DEL MERCADO DE ALEMANIA POR FACTOR DE FORMA\n
    29. 6.16 ANÁLISIS DEL MERCADO DEL REINO UNIDO POR TIPO\n
    30. 6.17 ANÁLISIS DEL MERCADO DEL REINO UNIDO POR VELOCIDAD DE CONEXIÓN\n
    31. 6.18 ANÁLISIS DEL MERCADO DEL REINO UNIDO POR USO FINAL\n
    32. 6.19 ANÁLISIS DEL MERCADO DEL REINO UNIDO POR FACTOR DE FORMA\n
    33. 6.20 ANÁLISIS DEL MERCADO DE FRANCIA POR TIPO\n
    34. 6.21 ANÁLISIS DEL MERCADO DE FRANCIA POR VELOCIDAD DE CONEXIÓN\n
    35. 6.22 ANÁLISIS DEL MERCADO DE FRANCIA POR USO FINAL\n
    36. 6.23 ANÁLISIS DEL MERCADO DE FRANCIA POR FACTOR DE FORMA\n
    37. 6.24 ANÁLISIS DEL MERCADO DE RUSIA POR TIPO\n
    38. 6.25 ANÁLISIS DEL MERCADO DE RUSIA POR VELOCIDAD DE CONEXIÓN\n
    39. 6.26 ANÁLISIS DEL MERCADO DE RUSIA POR USO FINAL\n
    40. 6.27 ANÁLISIS DEL MERCADO DE RUSIA POR FACTOR DE FORMA\n
    41. 6.28 ANÁLISIS DEL MERCADO DE ITALIA POR TIPO\n
    42. 6.29 ANÁLISIS DEL MERCADO DE ITALIA POR VELOCIDAD DE CONEXIÓN\n
    43. 6.30 ANÁLISIS DEL MERCADO DE ITALIA POR USO FINAL\n
    44. 6.31 ANÁLISIS DEL MERCADO DE ITALIA POR FACTOR DE FORMA\n
    45. 6.32 ANÁLISIS DEL MERCADO DE ESPAÑA POR TIPO\n
    46. 6.33 ANÁLISIS DEL MERCADO DE ESPAÑA POR VELOCIDAD DE CONEXIÓN\n
    47. 6.34 ANÁLISIS DEL MERCADO DE ESPAÑA POR USO FINAL\n
    48. 6.35 ANÁLISIS DEL MERCADO DE ESPAÑA POR FACTOR DE FORMA\n
    49. 6.36 ANÁLISIS DEL MERCADO DEL RESTO DE EUROPA POR TIPO\n
    50. 6.37 ANÁLISIS DEL MERCADO DEL RESTO DE EUROPA POR VELOCIDAD DE CONEXIÓN\n
    51. 6.38 ANÁLISIS DEL MERCADO DEL RESTO DE EUROPA POR USO FINAL\n
    52. 6.39 ANÁLISIS DEL MERCADO DEL RESTO DE EUROPA POR FACTOR DE FORMA\n
    53. 6.40 ANÁLISIS DEL MERCADO DE APAC\n
    54. 6.41 ANÁLISIS DEL MERCADO DE CHINA POR TIPO\n
    55. 6.42 ANÁLISIS DEL MERCADO DE CHINA POR VELOCIDAD DE CONEXIÓN\n
    56. 6.43 ANÁLISIS DEL MERCADO DE CHINA POR USO FINAL\n
    57. 6.44 ANÁLISIS DEL MERCADO DE CHINA POR FACTOR DE FORMA\n
    58. 6.45 ANÁLISIS DEL MERCADO DE INDIA POR TIPO\n
    59. 6.46 ANÁLISIS DEL MERCADO DE INDIA POR VELOCIDAD DE CONEXIÓN\n
    60. 6.47 ANÁLISIS DEL MERCADO DE INDIA POR USO FINAL\n
    61. 6.48 ANÁLISIS DEL MERCADO DE INDIA POR FACTOR DE FORMA\n
    62. 6.49 ANÁLISIS DEL MERCADO DE JAPÓN POR TIPO\n
    63. 6.50 ANÁLISIS DEL MERCADO DE JAPÓN POR VELOCIDAD DE CONEXIÓN\n
    64. 6.51 ANÁLISIS DEL MERCADO DE JAPÓN POR USO FINAL\n
    65. 6.52 ANÁLISIS DEL MERCADO DE JAPÓN POR FACTOR DE FORMA\n
    66. 6.53 ANÁLISIS DEL MERCADO DE COREA DEL SUR POR TIPO\n
    67. 6.54 ANÁLISIS DEL MERCADO DE COREA DEL SUR POR VELOCIDAD DE CONEXIÓN\n
    68. 6.55 ANÁLISIS DEL MERCADO DE COREA DEL SUR POR USO FINAL\n
    69. 6.56 ANÁLISIS DEL MERCADO DE COREA DEL SUR POR FACTOR DE FORMA\n
    70. 6.57 ANÁLISIS DEL MERCADO DE MALASIA POR TIPO\n
    71. 6.58 ANÁLISIS DEL MERCADO DE MALASIA POR VELOCIDAD DE CONEXIÓN\n
    72. 6.59 ANÁLISIS DEL MERCADO DE MALASIA POR USO FINAL\n
    73. 6.60 ANÁLISIS DEL MERCADO DE MALASIA POR FACTOR DE FORMA\n
    74. 6.61 ANÁLISIS DEL MERCADO DE TAILANDIA POR TIPO\n
    75. 6.62 ANÁLISIS DEL MERCADO DE TAILANDIA POR VELOCIDAD DE CONEXIÓN\n
    76. 6.63 ANÁLISIS DEL MERCADO DE TAILANDIA POR USO FINAL\n
    77. 6.64 ANÁLISIS DEL MERCADO DE TAILANDIA POR FACTOR DE FORMA\n
    78. 6.65 ANÁLISIS DEL MERCADO DE INDONESIA POR TIPO\n
    79. 6.66 ANÁLISIS DEL MERCADO DE INDONESIA POR VELOCIDAD DE CONEXIÓN\n
    80. 6.67 ANÁLISIS DEL MERCADO DE INDONESIA POR USO FINAL\n
    81. 6.68 ANÁLISIS DEL MERCADO DE INDONESIA POR FACTOR DE FORMA\n
    82. 6.69 ANÁLISIS DEL MERCADO DEL RESTO DE APAC POR TIPO\n
    83. 6.70 ANÁLISIS DEL MERCADO DEL RESTO DE APAC POR VELOCIDAD DE CONEXIÓN\n
    84. 6.71 ANÁLISIS DEL MERCADO DEL RESTO DE APAC POR USO FINAL\n
    85. 6.72 ANÁLISIS DEL MERCADO DEL RESTO DE APAC POR FACTOR DE FORMA\n
    86. 6.73 ANÁLISIS DEL MERCADO DE AMÉRICA DEL SUR\n
    87. 6.74 ANÁLISIS DEL MERCADO DE BRASIL POR TIPO\n
    88. 6.75 ANÁLISIS DEL MERCADO DE BRASIL POR VELOCIDAD DE CONEXIÓN\n
    89. 6.76 ANÁLISIS DEL MERCADO DE BRASIL POR USO FINAL\n
    90. 6.77 ANÁLISIS DEL MERCADO DE BRASIL POR FACTOR DE FORMA\n
    91. 6.78 ANÁLISIS DEL MERCADO DE MÉXICO POR TIPO\n
    92. 6.79 ANÁLISIS DEL MERCADO DE MÉXICO POR VELOCIDAD DE CONEXIÓN\n
    93. 6.80 ANÁLISIS DEL MERCADO DE MÉXICO POR USO FINAL\n
    94. 6.81 ANÁLISIS DEL MERCADO DE MÉXICO POR FACTOR DE FORMA\n
    95. 6.82 ANÁLISIS DEL MERCADO DE ARGENTINA POR TIPO\n
    96. 6.83 ANÁLISIS DEL MERCADO DE ARGENTINA POR VELOCIDAD DE CONEXIÓN\n
    97. 6.84 ANÁLISIS DEL MERCADO DE ARGENTINA POR USO FINAL\n
    98. 6.85 ANÁLISIS DEL MERCADO DE ARGENTINA POR FACTOR DE FORMA\n
    99. 6.86 ANÁLISIS DEL MERCADO DEL RESTO DE AMÉRICA DEL SUR POR TIPO\n
    100. 6.87 ANÁLISIS DEL MERCADO DEL RESTO DE AMÉRICA DEL SUR POR VELOCIDAD DE CONEXIÓN\n
    101. 6.88 ANÁLISIS DEL MERCADO DEL RESTO DE AMÉRICA DEL SUR POR USO FINAL\n
    102. 6.89 ANÁLISIS DEL MERCADO DEL RESTO DE AMÉRICA DEL SUR POR FACTOR DE FORMA\n
    103. 6.90 ANÁLISIS DEL MERCADO DE MEA\n
    104. 6.91 ANÁLISIS DEL MERCADO DE PAÍSES DEL CCG POR TIPO\n
    105. 6.92 ANÁLISIS DEL MERCADO DE PAÍSES DEL CCG POR VELOCIDAD DE CONEXIÓN\n
    106. 6.93 ANÁLISIS DEL MERCADO DE PAÍSES DEL CCG POR USO FINAL\n
    107. 6.94 ANÁLISIS DEL MERCADO DE PAÍSES DEL CCG POR FACTOR DE FORMA\n
    108. 6.95 ANÁLISIS DEL MERCADO DE SUDÁFRICA POR TIPO\n
    109. 6.96 ANÁLISIS DEL MERCADO DE SUDÁFRICA POR VELOCIDAD DE CONEXIÓN\n
    110. 6.97 ANÁLISIS DEL MERCADO DE SUDÁFRICA POR USO FINAL\n
    111. 6.98 ANÁLISIS DEL MERCADO DE SUDÁFRICA POR FACTOR DE FORMA\n
    112. 6.99 ANÁLISIS DEL MERCADO DEL RESTO DE MEA POR TIPO\n
    113. 6.100 ANÁLISIS DEL MERCADO DEL RESTO DE MEA POR VELOCIDAD DE CONEXIÓN\n
    114. 6.101 ANÁLISIS DEL MERCADO DEL RESTO DE MEA POR USO FINAL\n
    115. 6.102 ANÁLISIS DEL MERCADO DEL RESTO DE MEA POR FACTOR DE FORMA\n
    116. 6.103 CRITERIOS CLAVE DE COMPRA DE SEMICONDUCTORES Y ELECTRÓNICA\n
    117. 6.104 PROCESO DE INVESTIGACIÓN DE MRFR\n
    118. 6.105 ANÁLISIS DRO DE SEMICONDUCTORES Y ELECTRÓNICA\n
    119. 6.106 ANÁLISIS DEL IMPACTO DE LOS IMPULSORES: SEMICONDUCTORES Y ELECTRÓNICA\n
    120. 6.107 ANÁLISIS DEL IMPACTO DE LAS RESTRICCIONES: SEMICONDUCTORES Y ELECTRÓNICA\n
    121. 6.108 CADENA DE SUMINISTRO / VALOR: SEMICONDUCTORES Y ELECTRÓNICA\n
    122. 6.109 SEMICONDUCTORES Y ELECTRÓNICA, POR TIPO, 2024 (% DE PARTICIPACIÓN)\n\n
    123. 6.110 SEMICONDUCTORES Y ELECTRÓNICA, POR TIPO, 2024 A 2035 (USD Mil millones)\n\n
    124. 6.111 SEMICONDUCTORES Y ELECTRÓNICA, POR VELOCIDAD DE CONEXIÓN, 2024 (% DE PARTICIPACIÓN)\n\n
    125. 6.112 SEMICONDUCTORES Y ELECTRÓNICA, POR VELOCIDAD DE CONEXIÓN, 2024 A 2035 (USD Mil millones)\n\n
    126. 6.113 SEMICONDUCTORES Y ELECTRÓNICA, POR USO FINAL, 2024 (% DE PARTICIPACIÓN)\n\n
    127. 6.114 SEMICONDUCTORES Y ELECTRÓNICA, POR USO FINAL, 2024 A 2035 (USD Mil millones)\n\n
    128. 6.115 SEMICONDUCTORES Y ELECTRÓNICA, POR FACTOR DE FORMA, 2024 (% DE PARTICIPACIÓN)\n\n
    129. 6.116 SEMICONDUCTORES Y ELECTRÓNICA, POR FACTOR DE FORMA, 2024 A 2035 (USD Mil millones)\n\n
    130. 6.117 COMPARATIVA DE LOS PRINCIPALES COMPETIDORES\n7 LISTA DE TABLAS\n
    131. 7.1 LISTA DE SUPOSICIONES\n \n
      1. 7.1.1 \n \n
    132. 7.2 ESTIMACIONES DEL TAMAÑO DEL MERCADO DE AMÉRICA DEL NORTE; PRONÓSTICO\n \n
      1. 7.2.1 POR TIPO, 2025-2035 (USD Mil millones)\n \n
      2. 7.2.2 POR VELOCIDAD DE CONEXIÓN, 2025-2035 (USD Mil millones)\n \n
      3. 7.2.3 POR USO FINAL, 2025-2035 (USD Mil millones)\n \n
      4. 7.2.4 POR FACTOR DE FORMA, 2025-2035 (USD Mil millones)\n
    133. 7.3 ESTIMACIONES DEL TAMAÑO DEL MERCADO DE EE. UU.; PRONÓSTICO\n \n
      1. 7.3.1 POR TIPO, 2025-2035 (USD Mil millones)\n \n
      2. 7.3.2 POR VELOCIDAD DE CONEXIÓN, 2025-2035 (USD Mil millones)\n \n
      3. 7.3.3 POR USO FINAL, 2025-2035 (USD Mil millones)\n \n
      4. 7.3.4 POR FACTOR DE FORMA, 2025-2035 (USD Mil millones)\n
    134. 7.4 ESTIMACIONES DEL TAMAÑO DEL MERCADO DE CANADÁ; PRONÓSTICO\n \n
      1. 7.4.1 POR TIPO, 2025-2035 (USD Mil millones)\n \n
      2. 7.4.2 POR VELOCIDAD DE CONEXIÓN, 2025-2035 (USD Mil millones)\n \n
      3. 7.4.3 POR USO FINAL, 2025-2035 (USD Mil millones)\n \n
      4. 7.4.4 POR FACTOR DE FORMA, 2025-2035 (USD Mil millones)\n
    135. 7.5 ESTIMACIONES DEL TAMAÑO DEL MERCADO DE EUROPA; PRONÓSTICO\n \n
      1. 7.5.1 POR TIPO, 2025-2035 (USD Mil millones)\n \n
      2. 7.5.2 POR VELOCIDAD DE CONEXIÓN, 2025-2035 (USD Mil millones)\n \n
      3. 7.5.3 POR USO FINAL, 2025-2035 (USD Mil millones)\n \n
      4. 7.5.4 POR FACTOR DE FORMA, 2025-2035 (USD Mil millones)\n
    136. 7.6 ESTIMACIONES DEL TAMAÑO DEL MERCADO DE ALEMANIA; PRONÓSTICO\n \n
      1. 7.6.1 POR TIPO, 2025-2035 (USD Mil millones)\n \n
      2. 7.6.2 POR VELOCIDAD DE CONEXIÓN, 2025-2035 (USD Mil millones)\n \n
      3. 7.6.3 POR USO FINAL, 2025-2035 (USD Mil millones)\n \n
      4. 7.6.4 POR FACTOR DE FORMA, 2025-2035 (USD Mil millones)\n
    137. 7.7 ESTIMACIONES DEL TAMAÑO DEL MERCADO DEL REINO UNIDO; PRONÓSTICO\n \n
      1. 7.7.1 POR TIPO, 2025-2035 (USD Mil millones)\n \n
      2. 7.7.2 POR VELOCIDAD DE CONEXIÓN, 2025-2035 (USD Mil millones)\n \n
      3. 7.7.3 POR USO FINAL, 2025-2035 (USD Mil millones)\n \n
      4. 7.7.4 POR FACTOR DE FORMA, 2025-2035 (USD Mil millones)\n
    138. 7.8 ESTIMACIONES DEL TAMAÑO DEL MERCADO DE FRANCIA; PRONÓSTICO\n \n
      1. 7.8.1 POR TIPO, 2025-2035 (USD Mil millones)\n \n
      2. 7.8.2 POR VELOCIDAD DE CONEXIÓN, 2025-2035 (USD Mil millones)\n \n
      3. 7.8.3 POR USO FINAL, 2025-2035 (USD Mil millones)\n \n
      4. 7.8.4 POR FACTOR DE FORMA, 2025-2035 (USD Mil millones)\n
    139. 7.9 ESTIMACIONES DEL TAMAÑO DEL MERCADO DE RUSIA; PRONÓSTICO\n \n
      1. 7.9.1 POR TIPO, 2025-2035 (USD Mil millones)\n \n
      2. 7.9.2 POR VELOCIDAD DE CONEXIÓN, 2025-2035 (USD Mil millones)\n \n
      3. 7.9.3 POR USO FINAL, 2025-2035 (USD Mil millones)\n \n
      4. 7.9.4 POR FACTOR DE FORMA, 2025-2035 (USD Mil millones)\n
    140. 7.10 ESTIMACIONES DEL TAMAÑO DEL MERCADO DE ITALIA; PRONÓSTICO\n \n
      1. 7.10.1 POR TIPO, 2025-2035 (USD Mil millones)\n \n
      2. 7.10.2 POR VELOCIDAD DE CONEXIÓN, 2025-2035 (USD Mil millones)\n \n
      3. 7.10.3 POR USO FINAL, 2025-2035 (USD Mil millones)\n \n
      4. 7.10.4 POR FACTOR DE FORMA, 2025-2035 (USD Mil millones)\n
    141. 7.11 ESTIMACIONES DEL TAMAÑO DEL MERCADO DE ESPAÑA; PRONÓSTICO\n \n
      1. 7.11.1 POR TIPO, 2025-2035 (USD Mil millones)\n \n
      2. 7.11.2 POR VELOCIDAD DE CONEXIÓN, 2025-2035 (USD Mil millones)\n \n
      3. 7.11.3 POR USO FINAL, 2025-2035 (USD Mil millones)\n \n
      4. 7.11.4 POR FACTOR DE FORMA, 2025-2035 (USD Mil millones)\n
    142. 7.12 ESTIMACIONES DEL TAMAÑO DEL MERCADO DEL RESTO DE EUROPA; PRONÓSTICO\n \n
      1. 7.12.1 POR TIPO, 2025-2035 (USD Mil millones)\n \n
      2. 7.12.2 POR VELOCIDAD DE CONEXIÓN, 2025-2035 (USD Mil millones)\n \n
      3. 7.12.3 POR USO FINAL, 2025-2035 (USD Mil millones)\n \n
      4. 7.12.4 POR FACTOR DE FORMA, 2025-2035 (USD Mil millones)\n
    143. 7.13 ESTIMACIONES DEL TAMAÑO DEL MERCADO DE APAC; PRONÓSTICO\n \n
      1. 7.13.1 POR TIPO, 2025-2035 (USD Mil millones)\n \n
      2. 7.13.2 POR VELOCIDAD DE CONEXIÓN, 2025-2035 (USD Mil millones)\n \n
      3. 7.13.3 POR USO FINAL, 2025-2035 (USD Mil millones)\n \n
      4. 7.13.4 POR FACTOR DE FORMA, 2025-2035 (USD Mil millones)\n
    144. 7.14 ESTIMACIONES DEL TAMAÑO DEL MERCADO DE CHINA; PRONÓSTICO\n \n
      1. 7.14.1 POR TIPO, 2025-2035 (USD Mil millones)\n \n
      2. 7.14.2 POR VELOCIDAD DE CONEXIÓN, 2025-2035 (USD Mil millones)\n \n
      3. 7.14.3 POR USO FINAL, 2025-2035 (USD Mil millones)\n \n
      4. 7.14.4 POR FACTOR DE FORMA, 2025-2035 (USD Mil millones)\n
    145. 7.15 ESTIMACIONES DEL TAMAÑO DEL MERCADO DE INDIA; PRONÓSTICO\n \n
      1. 7.15.1 POR TIPO, 2025-2035 (USD Mil millones)\n \n
      2. 7.15.2 POR VELOCIDAD DE CONEXIÓN, 2025-2035 (USD Mil millones)\n \n
      3. 7.15.3 POR USO FINAL, 2025-2035 (USD Mil millones)\n \n
      4. 7.15.4 POR FACTOR DE FORMA, 2025-2035 (USD Mil millones)\n
    146. 7.16 ESTIMACIONES DEL TAMAÑO DEL MERCADO DE JAPÓN; PRONÓSTICO\n \n
      1. 7.16.1 POR TIPO, 2025-2035 (USD Mil millones)\n \n
      2. 7.16.2 POR VELOCIDAD DE CONEXIÓN, 2025-2035 (USD Mil millones)\n \n
      3. 7.16.3 POR USO FINAL, 2025-2035 (USD Mil millones)\n \n
      4. 7.16.4 POR FACTOR DE FORMA, 2025-2035 (USD Mil millones)\n
    147. 7.17 ESTIMACIONES DEL TAMAÑO DEL MERCADO DE COREA DEL SUR; PRONÓSTICO\n \n
      1. 7.17.1 POR TIPO, 2025-2035 (USD Mil millones)\n \n
      2. 7.17.2 POR VELOCIDAD DE CONEXIÓN, 2025-2035 (USD Mil millones)\n \n
      3. 7.17.3 POR USO FINAL, 2025-2035 (USD Mil millones)\n \n
      4. 7.17.4 POR FACTOR DE FORMA, 2025-2035 (USD Mil millones)\n
    148. 7.18 ESTIMACIONES DEL TAMAÑO DEL MERCADO DE MALASIA; PRONÓSTICO\n \n
      1. 7.18.1 POR TIPO, 2025-2035 (USD Mil millones)\n \n
      2. 7.18.2 POR VELOCIDAD DE CONEXIÓN, 2025-2035 (USD Mil millones)\n \n
      3. 7.18.3 POR USO FINAL, 2025-2035 (USD Mil millones)\n \n
      4. 7.18.4 POR FACTOR DE FORMA, 2025-2035 (USD Mil millones)\n
    149. 7.19 ESTIMACIONES DEL TAMAÑO DEL MERCADO DE TAILANDIA; PRONÓSTICO\n \n
      1. 7.19.1 POR TIPO, 2025-2035 (USD Mil millones)\n \n
      2. 7.19.2 POR VELOCIDAD DE CONEXIÓN, 2025-2035 (USD Mil millones)\n \n
      3. 7.19.3 POR USO FINAL, 2025-2035 (USD Mil millones)\n \n
      4. 7.19.4 POR FACTOR DE FORMA, 2025-2035 (USD Mil millones)\n
    150. 7.20 ESTIMACIONES DEL TAMAÑO DEL MERCADO DE INDONESIA; PRONÓSTICO\n \n
      1. 7.20.1 POR TIPO, 2025-2035 (USD Mil millones)\n \n
      2. 7.20.2 POR VELOCIDAD DE CONEXIÓN, 2025-2035 (USD Mil millones)\n \n
      3. 7.20.3 POR USO FINAL, 2025-2035 (USD Mil millones)\n \n
      4. 7.20.4 POR FACTOR DE FORMA, 2025-2035 (USD Mil millones)\n
    151. 7.21 ESTIMACIONES DEL TAMAÑO DEL MERCADO DEL RESTO DE APAC; PRONÓSTICO\n \n
      1. 7.21.1 POR TIPO, 2025-2035 (USD Mil millones)\n \n
      2. 7.21.2 POR VELOCIDAD DE CONEXIÓN, 2025-2035 (USD Mil millones)\n \n
      3. 7.21.3 POR USO FINAL, 2025-2035 (USD Mil millones)\n \n
      4. 7.21.4 POR FACTOR DE FORMA, 2025-2035 (USD Mil millones)\n
    152. 7.22 ESTIMACIONES DEL TAMAÑO DEL MERCADO DE AMÉRICA DEL SUR; PRONÓSTICO\n \n
      1. 7.22.1 POR TIPO, 2025-2035 (USD Mil millones)\n \n
      2. 7.22.2 POR VELOCIDAD DE CONEXIÓN, 2025-2035 (USD Mil millones)\n \n
      3. 7.22.3 POR USO FINAL, 2025-2035 (USD Mil millones)\n \n
      4. 7.22.4 POR FACTOR DE FORMA, 2025-2035 (USD Mil millones)\n
    153. 7.23 ESTIMACIONES DEL TAMAÑO DEL MERCADO DE BRASIL; PRONÓSTICO\n \n
      1. 7.23.1 POR TIPO, 2025-2035 (USD Mil millones)\n \n
      2. 7.23.2 POR VELOCIDAD DE CONEXIÓN, 2025-2035 (USD Mil millones)\n \n
      3. 7.23.3 POR USO FINAL, 2025-2035 (USD Mil millones)\n \n
      4. 7.23.4 POR FACTOR DE FORMA, 2025-2035 (USD Mil millones)\n
    154. 7.24 ESTIMACIONES DEL TAMAÑO DEL MERCADO DE MÉXICO; PRONÓSTICO\n \n
      1. 7.24.1 POR TIPO, 2025-2035 (USD Mil millones)\n \n
      2. 7.24.2 POR VELOCIDAD DE CONEXIÓN, 2025-2035 (USD Mil millones)\n \n
      3. 7.24.3 POR USO FINAL, 2025-2035 (USD Mil millones)\n \n
      4. 7.24.4 POR FACTOR DE FORMA, 2025-2035 (USD Mil millones)\n
    155. 7.25 ESTIMACIONES DEL TAMAÑO DEL MERCADO DE ARGENTINA; PRONÓSTICO\n \n
      1. 7.25.1 POR TIPO, 2025-2035 (USD Mil millones)\n \n
      2. 7.25.2 POR VELOCIDAD DE CONEXIÓN, 2025-2035 (USD Mil millones)\n \n
      3. 7.25.3 POR USO FINAL, 2025-2035 (USD Mil millones)\n \n
      4. 7.25.4 POR FACTOR DE FORMA, 2025-2035 (USD Mil millones)\n
    156. 7.26 ESTIMACIONES DEL TAMAÑO DEL MERCADO DEL RESTO DE AMÉRICA DEL SUR; PRONÓSTICO\n \n
      1. 7.26.1 POR TIPO, 2025-2035 (USD Mil millones)\n \n
      2. 7.26.2 POR VELOCIDAD DE CONEXIÓN, 2025-2035 (USD Mil millones)\n \n
      3. 7.26.3 POR USO FINAL, 2025-2035 (USD Mil millones)\n \n
      4. 7.26.4 POR FACTOR DE FORMA, 2025-2035 (USD Mil millones)\n
    157. 7.27 ESTIMACIONES DEL TAMAÑO DEL MERCADO DE MEA; PRONÓSTICO\n \n
      1. 7.27.1 POR TIPO, 2025-2035 (USD Mil millones)\n \n
      2. 7.27.2 POR VELOCIDAD DE CONEXIÓN, 2025-2035 (USD Mil millones)\n \n
      3. 7.27.3 POR USO FINAL, 2025-2035 (USD Mil millones)\n \n
      4. 7.27.4 POR FACTOR DE FORMA, 2025-2035 (USD Mil millones)\n
    158. 7.28 ESTIMACIONES DEL TAMAÑO DEL MERCADO DE PAÍSES DEL CCG; PRONÓSTICO\n \n
      1. 7.28.1 POR TIPO, 2025-2035 (USD Mil millones)\n \n
      2. 7.28.2 POR VELOCIDAD DE CONEXIÓN, 2025-2035 (USD Mil millones)\n \n
      3. 7.28.3 POR USO FINAL, 2025-2035 (USD Mil millones)\n \n
      4. 7.28.4 POR FACTOR DE FORMA, 2025-2035 (USD Mil millones)\n
    159. 7.29 ESTIMACIONES DEL TAMAÑO DEL MERCADO DE SUDÁFRICA; PRONÓSTICO\n \n
      1. 7.29.1 POR TIPO, 2025-2035 (USD Mil millones)\n \n
      2. 7.29.2 POR VELOCIDAD DE CONEXIÓN, 2025-2035 (USD Mil millones)\n \n
      3. 7.29.3 POR USO FINAL, 2025-2035 (USD Mil millones)\n \n
      4. 7.29.4 POR FACTOR DE FORMA, 2025-2035 (USD Mil millones)\n
    160. 7.30 ESTIMACIONES DEL TAMAÑO DEL MERCADO DEL RESTO DE MEA; PRONÓSTICO\n \n
      1. 7.30.1 POR TIPO, 2025-2035 (USD Mil millones)\n \n
      2. 7.30.2 POR VELOCIDAD DE CONEXIÓN, 2025-2035 (USD Mil millones)\n \n
      3. 7.30.3 POR USO FINAL, 2025-2035 (USD Mil millones)\n \n
      4. 7.30.4 POR FACTOR DE FORMA, 2025-2035 (USD Mil millones)\n
    161. 7.31 LANZAMIENTO DE PRODUCTO/DESARROLLO/APROBACIÓN\n \n
      1. 7.31.1 \n \n
    162. 7.32 ADQUISICIÓN/PARTNERSHIP\n \n

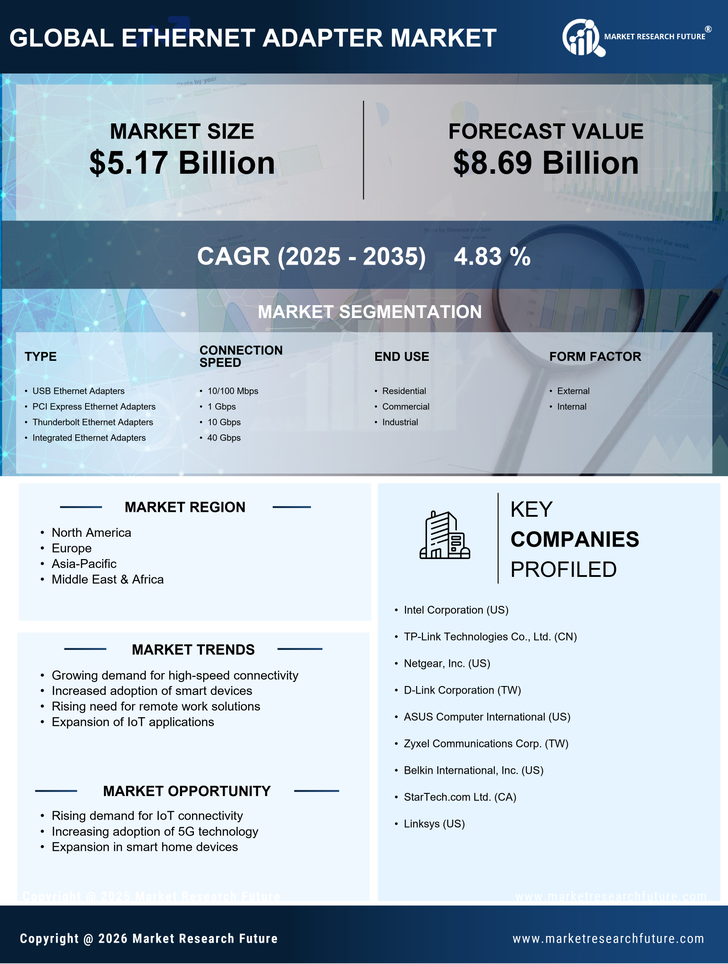
Segmentación del Mercado de Adaptadores Ethernet

  • Mercado de Adaptadores Ethernet por Tipo (USD Mil millones, 2020-2034)
    • Adaptadores Ethernet USB
    • Adaptadores Ethernet PCI Express
    • Adaptadores Ethernet Thunderbolt
    • Adaptadores Ethernet Integrados
  • Mercado de Adaptadores Ethernet por Velocidad de Conexión (USD Mil millones, 2020-2034)
    • 10/100 Mbps
    • 1 Gbps
    • 10 Gbps
    • 40 Gbps
  • Mercado de Adaptadores Ethernet por Uso Final (USD Mil millones, 2020-2034)
    • Residencial
    • Comercial
    • Industrial
  • Mercado de Adaptadores Ethernet por Factor de Forma (USD Mil millones, 2020-2034)
    • Externo
    • Interno
  • Mercado de Adaptadores Ethernet por Región (USD Mil millones, 2020-2034)
    • América del Norte
    • Europa
    • América del Sur
    • Asia-Pacífico
    • Medio Oriente y África

Perspectiva Regional del Mercado de Adaptadores Ethernet (USD Mil millones, 2020-2034)

  • Perspectiva de América del Norte (USD Mil millones, 2020-2034)
    • Mercado de Adaptadores Ethernet de América del Norte por Tipo
      • Adaptadores Ethernet USB
      • Adaptadores Ethernet PCI Express
      • Adaptadores Ethernet Thunderbolt
      • Adaptadores Ethernet Integrados
    • Mercado de Adaptadores Ethernet de América del Norte por Tipo de Velocidad de Conexión
      • 10/100 Mbps
      • 1 Gbps
      • 10 Gbps
      • 40 Gbps
    • Mercado de Adaptadores Ethernet de América del Norte por Tipo de Uso Final
      • Residencial
      • Comercial
      • Industrial
    • Mercado de Adaptadores Ethernet de América del Norte por Tipo de Factor de Forma
      • Externo
      • Interno
    • Mercado de Adaptadores Ethernet de América del Norte por Tipo Regional
      • EE. UU.
      • Canadá
    • Perspectiva de EE. UU. (USD Mil millones, 2020-2034)
    • Mercado de Adaptadores Ethernet de EE. UU. por Tipo
      • Adaptadores Ethernet USB
      • Adaptadores Ethernet PCI Express
      • Adaptadores Ethernet Thunderbolt
      • Adaptadores Ethernet Integrados
    • Mercado de Adaptadores Ethernet de EE. UU. por Tipo de Velocidad de Conexión
      • 10/100 Mbps
      • 1 Gbps
      • 10 Gbps
      • 40 Gbps
    • Mercado de Adaptadores Ethernet de EE. UU. por Tipo de Uso Final
      • Residencial
      • Comercial
      • Industrial
    • Mercado de Adaptadores Ethernet de EE. UU. por Tipo de Factor de Forma
      • Externo
      • Interno
    • Perspectiva de CANADÁ (USD Mil millones, 2020-2034)
    • Mercado de Adaptadores Ethernet de CANADÁ por Tipo
      • Adaptadores Ethernet USB
      • Adaptadores Ethernet PCI Express
      • Adaptadores Ethernet Thunderbolt
      • Adaptadores Ethernet Integrados
    • Mercado de Adaptadores Ethernet de CANADÁ por Tipo de Velocidad de Conexión
      • 10/100 Mbps
      • 1 Gbps
      • 10 Gbps
      • 40 Gbps
    • Mercado de Adaptadores Ethernet de CANADÁ por Tipo de Uso Final
      • Residencial
      • Comercial
      • Industrial
    • Mercado de Adaptadores Ethernet de CANADÁ por Tipo de Factor de Forma
      • Externo
      • Interno
    • Perspectiva de Europa (USD Mil millones, 2020-2034)
      • Mercado de Adaptadores Ethernet de Europa por Tipo
        • Adaptadores Ethernet USB
        • Adaptadores Ethernet PCI Express
        • Adaptadores Ethernet Thunderbolt
        • Adaptadores Ethernet Integrados
      • Mercado de Adaptadores Ethernet de Europa por Tipo de Velocidad de Conexión
        • 10/100 Mbps
        • 1 Gbps
        • 10 Gbps
        • 40 Gbps
      • Mercado de Adaptadores Ethernet de Europa por Tipo de Uso Final
        • Residencial
        • Comercial
        • Industrial
      • Mercado de Adaptadores Ethernet de Europa por Tipo de Factor de Forma
        • Externo
        • Interno
      • Mercado de Adaptadores Ethernet de Europa por Tipo Regional
        • Alemania
        • Reino Unido
        • Francia
        • Rusia
        • Italia
        • España
        • Resto de Europa
      • Perspectiva de ALEMANIA (USD Mil millones, 2020-2034)
      • Mercado de Adaptadores Ethernet de ALEMANIA por Tipo
        • Adaptadores Ethernet USB
        • Adaptadores Ethernet PCI Express
        • Adaptadores Ethernet Thunderbolt
        • Adaptadores Ethernet Integrados
      • Mercado de Adaptadores Ethernet de ALEMANIA por Tipo de Velocidad de Conexión
        • 10/100 Mbps
        • 1 Gbps
        • 10 Gbps
        • 40 Gbps
      • Mercado de Adaptadores Ethernet de ALEMANIA por Tipo de Uso Final
        • Residencial
        • Comercial
        • Industrial
      • Mercado de Adaptadores Ethernet de ALEMANIA por Tipo de Factor de Forma
        • Externo
        • Interno
      • Perspectiva del REINO UNIDO (USD Mil millones, 2020-2034)
      • Mercado de Adaptadores Ethernet del REINO UNIDO por Tipo
        • Adaptadores Ethernet USB
        • Adaptadores Ethernet PCI Express
        • Adaptadores Ethernet Thunderbolt
        • Adaptadores Ethernet Integrados
      • Mercado de Adaptadores Ethernet del REINO UNIDO por Tipo de Velocidad de Conexión
        • 10/100 Mbps
        • 1 Gbps
        • 10 Gbps
        • 40 Gbps
      • Mercado de Adaptadores Ethernet del REINO UNIDO por Tipo de Uso Final
        • Residencial
        • Comercial
        • Industrial
      • Mercado de Adaptadores Ethernet del REINO UNIDO por Tipo de Factor de Forma
        • Externo
        • Interno
      • Perspectiva de FRANCIA (USD Mil millones, 2020-2034)
      • Mercado de Adaptadores Ethernet de FRANCIA por Tipo
        • Adaptadores Ethernet USB
        • Adaptadores Ethernet PCI Express
        • Adaptadores Ethernet Thunderbolt
        • Adaptadores Ethernet Integrados
      • Mercado de Adaptadores Ethernet de FRANCIA por Tipo de Velocidad de Conexión
        • 10/100 Mbps
        • 1 Gbps
        • 10 Gbps
        • 40 Gbps
      • Mercado de Adaptadores Ethernet de FRANCIA por Tipo de Uso Final
        • Residencial
        • Comercial
        • Industrial
      • Mercado de Adaptadores Ethernet de FRANCIA por Tipo de Factor de Forma
        • Externo
        • Interno
      • Perspectiva de RUSIA (USD Mil millones, 2020-2034)
      • Mercado de Adaptadores Ethernet de RUSIA por Tipo
        • Adaptadores Ethernet USB
        • Adaptadores Ethernet PCI Express
        • Adaptadores Ethernet Thunderbolt
        • Adaptadores Ethernet Integrados
      • Mercado de Adaptadores Ethernet de RUSIA por Tipo de Velocidad de Conexión
        • 10/100 Mbps
        • 1 Gbps
        • 10 Gbps
        • 40 Gbps
      • Mercado de Adaptadores Ethernet de RUSIA por Tipo de Uso Final
        • Residencial
        • Comercial
        • Industrial
      • Mercado de Adaptadores Ethernet de RUSIA por Tipo de Factor de Forma
        • Externo
        • Interno
      • Perspectiva de ITALIA (USD Mil millones, 2020-2034)
      • Mercado de Adaptadores Ethernet de ITALIA por Tipo
        • Adaptadores Ethernet USB
        • Adaptadores Ethernet PCI Express
        • Adaptadores Ethernet Thunderbolt
        • Adaptadores Ethernet Integrados
      • Mercado de Adaptadores Ethernet de ITALIA por Tipo de Velocidad de Conexión
        • 10/100 Mbps
        • 1 Gbps
        • 10 Gbps
        • 40 Gbps
      • Mercado de Adaptadores Ethernet de ITALIA por Tipo de Uso Final
        • Residencial
        • Comercial
        • Industrial
      • Mercado de Adaptadores Ethernet de ITALIA por Tipo de Factor de Forma
        • Externo
        • Interno
      • Perspectiva de ESPAÑA (USD Mil millones, 2020-2034)
      • Mercado de Adaptadores Ethernet de ESPAÑA por Tipo
        • Adaptadores Ethernet USB
        • Adaptadores Ethernet PCI Express
        • Adaptadores Ethernet Thunderbolt
        • Adaptadores Ethernet Integrados
      • Mercado de Adaptadores Ethernet de ESPAÑA por Tipo de Velocidad de Conexión
        • 10/100 Mbps
        • 1 Gbps
        • 10 Gbps
        • 40 Gbps
      • Mercado de Adaptadores Ethernet de ESPAÑA por Tipo de Uso Final
        • Residencial
        • Comercial
        • Industrial
      • Mercado de Adaptadores Ethernet de ESPAÑA por Tipo de Factor de Forma
        • Externo
        • Interno
      • Perspectiva del RESTO DE EUROPA (USD Mil millones, 2020-2034)
      • Mercado de Adaptadores Ethernet del RESTO DE EUROPA por Tipo
        • Adaptadores Ethernet USB
        • Adaptadores Ethernet PCI Express
        • Adaptadores Ethernet Thunderbolt
        • Adaptadores Ethernet Integrados
      • Mercado de Adaptadores Ethernet del RESTO DE EUROPA por Tipo de Velocidad de Conexión
        • 10/100 Mbps
        • 1 Gbps
        • 10 Gbps
        • 40 Gbps
      • Mercado de Adaptadores Ethernet del RESTO DE EUROPA por Tipo de Uso Final
        • Residencial
        • Comercial
        • Industrial
      • Mercado de Adaptadores Ethernet del RESTO DE EUROPA por Tipo de Factor de Forma
        • Externo
        • Interno
      • Perspectiva de APAC (USD Mil millones, 2020-2034)
        • Mercado de Adaptadores Ethernet de APAC por Tipo
          • Adaptadores Ethernet USB
          • Adaptadores Ethernet PCI Express
          • Adaptadores Ethernet Thunderbolt
          • Adaptadores Ethernet Integrados
        • Mercado de Adaptadores Ethernet de APAC por Tipo de Velocidad de Conexión
          • 10/100 Mbps
          • 1 Gbps
          • 10 Gbps
          • 40 Gbps
        • Mercado de Adaptadores Ethernet de APAC por Tipo de Uso Final
          • Residencial
          • Comercial
          • Industrial
        • Mercado de Adaptadores Ethernet de APAC por Tipo de Factor de Forma
          • Externo
          • Interno
        • Mercado de Adaptadores Ethernet de APAC por Tipo Regional
          • China
          • India
          • Japón
          • Corea del Sur
          • Malasia
          • Tailandia
          • Indonesia
          • Resto de APAC
        • Perspectiva de CHINA (USD Mil millones, 2020-2034)
        • Mercado de Adaptadores Ethernet de CHINA por Tipo
          • Adaptadores Ethernet USB
          • Adaptadores Ethernet PCI Express
          • Adaptadores Ethernet Thunderbolt
          • Adaptadores Ethernet Integrados
        • Mercado de Adaptadores Ethernet de CHINA por Tipo de Velocidad de Conexión
          • 10/100 Mbps
          • 1 Gbps
          • 10 Gbps
          • 40 Gbps
        • Mercado de Adaptadores Ethernet de CHINA por Tipo de Uso Final
          • Residencial
          • Comercial
          • Industrial
        • Mercado de Adaptadores Ethernet de CHINA por Tipo de Factor de Forma
          • Externo
          • Interno
        • Perspectiva de INDIA (USD Mil millones, 2020-2034)
        • Mercado de Adaptadores Ethernet de INDIA por Tipo
          • Adaptadores Ethernet USB
          • Adaptadores Ethernet PCI Express
          • Adaptadores Ethernet Thunderbolt
          • Adaptadores Ethernet Integrados
        • Mercado de Adaptadores Ethernet de INDIA por Tipo de Velocidad de Conexión
          • 10/100 Mbps
          • 1 Gbps
          • 10 Gbps
          • 40 Gbps
        • Mercado de Adaptadores Ethernet de INDIA por Tipo de Uso Final
          • Residencial
          • Comercial
          • Industrial
        • Mercado de Adaptadores Ethernet de INDIA por Tipo de Factor de Forma
          • Externo
          • Interno
        • Perspectiva de JAPÓN (USD Mil millones, 2020-2034)
        • Mercado de Adaptadores Ethernet de JAPÓN por Tipo
          • Adaptadores Ethernet USB
          • Adaptadores Ethernet PCI Express
          • Adaptadores Ethernet Thunderbolt
          • Adaptadores Ethernet Integrados
        • Mercado de Adaptadores Ethernet de JAPÓN por Tipo de Velocidad de Conexión
          • 10/100 Mbps
          • 1 Gbps
          • 10 Gbps
          • 40 Gbps
        • Mercado de Adaptadores Ethernet de JAPÓN por Tipo de Uso Final
          • Residencial
          • Comercial
          • Industrial
        • Mercado de Adaptadores Ethernet de JAPÓN por Tipo de Factor de Forma
          • Externo
          • Interno
        • Perspectiva de COREA DEL SUR (USD Mil millones, 2020-2034)
        • Mercado de Adaptadores Ethernet de COREA DEL SUR por Tipo
          • Adaptadores Ethernet USB
          • Adaptadores Ethernet PCI Express
          • Adaptadores Ethernet Thunderbolt
          • Adaptadores Ethernet Integrados
        • Mercado de Adaptadores Ethernet de COREA DEL SUR por Tipo de Velocidad de Conexión
          • 10/100 Mbps
          • 1 Gbps
          • 10 Gbps
          • 40 Gbps
        • Mercado de Adaptadores Ethernet de COREA DEL SUR por Tipo de Uso Final
          • Residencial
          • Comercial
          • Industrial
        • Mercado de Adaptadores Ethernet de COREA DEL SUR por Tipo de Factor de Forma
          • Externo
          • Interno
        • Perspectiva de MALASIA (USD Mil millones, 2020-2034)
        • Mercado de Adaptadores Ethernet de MALASIA por Tipo
          • Adaptadores Ethernet USB
          • Adaptadores Ethernet PCI Express
          • Adaptadores Ethernet Thunderbolt
          • Adaptadores Ethernet Integrados
        • Mercado de Adaptadores Ethernet de MALASIA por Tipo de Velocidad de Conexión
          • 10/100 Mbps
          • 1 Gbps
          • 10 Gbps
          • 40 Gbps
        • Mercado de Adaptadores Ethernet de MALASIA por Tipo de Uso Final
          • Residencial
          • Comercial
          • Industrial
        • Mercado de Adaptadores Ethernet de MALASIA por Tipo de Factor de Forma
          • Externo
          • Interno
        • Perspectiva de TAILANDIA (USD Mil millones, 2020-2034)
        • Mercado de Adaptadores Ethernet de TAILANDIA por Tipo
          • Adaptadores Ethernet USB
          • Adaptadores Ethernet PCI Express
          • Adaptadores Ethernet Thunderbolt
          • Adaptadores Ethernet Integrados
        • Mercado de Adaptadores Ethernet de TAILANDIA por Tipo de Velocidad de Conexión
          • 10/100 Mbps
          • 1 Gbps
          • 10 Gbps
          • 40 Gbps
        • Mercado de Adaptadores Ethernet de TAILANDIA por Tipo de Uso Final
          • Residencial
          • Comercial
          • Industrial
        • Mercado de Adaptadores Ethernet de TAILANDIA por Tipo de Factor de Forma
          • Externo
          • Interno
        • Perspectiva de INDONESIA (USD Mil millones, 2020-2034)
        • Mercado de Adaptadores Ethernet de INDONESIA por Tipo
          • Adaptadores Ethernet USB
          • Adaptadores Ethernet PCI Express
          • Adaptadores Ethernet Thunderbolt
          • Adaptadores Ethernet Integrados
        • Mercado de Adaptadores Ethernet de INDONESIA por Tipo de Velocidad de Conexión
          • 10/100 Mbps
          • 1 Gbps
          • 10 Gbps
          • 40 Gbps
        • Mercado de Adaptadores Ethernet de INDONESIA por Tipo de Uso Final
          • Residencial
          • Comercial
          • Industrial
        • Mercado de Adaptadores Ethernet de INDONESIA por Tipo de Factor de Forma
          • Externo
          • Interno
        • Perspectiva del RESTO DE APAC (USD Mil millones, 2020-2034)
        • Mercado de Adaptadores Ethernet del RESTO DE APAC por Tipo
          • Adaptadores Ethernet USB
          • Adaptadores Ethernet PCI Express
          • Adaptadores Ethernet Thunderbolt
          • Adaptadores Ethernet Integrados
        • Mercado de Adaptadores Ethernet del RESTO DE APAC por Tipo de Velocidad de Conexión
          • 10/100 Mbps
          • 1 Gbps
          • 10 Gbps
          • 40 Gbps
        • Mercado de Adaptadores Ethernet del RESTO DE APAC por Tipo de Uso Final
          • Residencial
          • Comercial
          • Industrial
        • Mercado de Adaptadores Ethernet del RESTO DE APAC por Tipo de Factor de Forma
          • Externo
          • Interno
        • Perspectiva de América del Sur (USD Mil millones, 2020-2034)
          • Mercado de Adaptadores Ethernet de América del Sur por Tipo
            • Adaptadores Ethernet USB
            • Adaptadores Ethernet PCI Express
            • Adaptadores Ethernet Thunderbolt
            • Adaptadores Ethernet Integrados
          • Mercado de Adaptadores Ethernet de América del Sur por Tipo de Velocidad de Conexión
            • 10/100 Mbps
            • 1 Gbps
            • 10 Gbps
            • 40 Gbps
          • Mercado de Adaptadores Ethernet de América del Sur por Tipo de Uso Final
            • Residencial
            • Comercial
            • Industrial
          • Mercado de Adaptadores Ethernet de América del Sur por Tipo de Factor de Forma
            • Externo
            • Interno
          • Mercado de Adaptadores Ethernet de América del Sur por Tipo Regional
            • Brasil
            • México
            • Argentina
            • Resto de América del Sur
          • Perspectiva de BRASIL (USD Mil millones, 2020-2034)
          • Mercado de Adaptadores Ethernet de BRASIL por Tipo
            • Adaptadores Ethernet USB
            • Adaptadores Ethernet PCI Express
            • Adaptadores Ethernet Thunderbolt
            • Adaptadores Ethernet Integrados
          • Mercado de Adaptadores Ethernet de BRASIL por Tipo de Velocidad de Conexión
            • 10/100 Mbps
            • 1 Gbps
            • 10 Gbps
            • 40 Gbps
          • Mercado de Adaptadores Ethernet de BRASIL por Tipo de Uso Final
            • Residencial
            • Comercial
            • Industrial
          • Mercado de Adaptadores Ethernet de BRASIL por Tipo de Factor de Forma
            • Externo
            • Interno
          • Perspectiva de MÉXICO (USD Mil millones, 2020-2034)
          • Mercado de Adaptadores Ethernet de MÉXICO por Tipo
            • Adaptadores Ethernet USB
            • Adaptadores Ethernet PCI Express
            • Adaptadores Ethernet Thunderbolt
            • Adaptadores Ethernet Integrados
          • Mercado de Adaptadores Ethernet de MÉXICO por Tipo de Velocidad de Conexión
            • 10/100 Mbps
            • 1 Gbps
            • 10 Gbps
            • 40 Gbps
          • Mercado de Adaptadores Ethernet de MÉXICO por Tipo de Uso Final
            • Residencial
            • Comercial
            • Industrial
          • Mercado de Adaptadores Ethernet de MÉXICO por Tipo de Factor de Forma
            • Externo
            • Interno
          • Perspectiva de ARGENTINA (USD Mil millones, 2020-2034)
          • Mercado de Adaptadores Ethernet de ARGENTINA por Tipo
            • Adaptadores Ethernet USB
            • Adaptadores Ethernet PCI Express
            • Adaptadores Ethernet Thunderbolt
            • Adaptadores Ethernet Integrados
          • Mercado de Adaptadores Ethernet de ARGENTINA por Tipo de Velocidad de Conexión
            • 10/100 Mbps
            • 1 Gbps
            • 10 Gbps
            • 40 Gbps
          • Mercado de Adaptadores Ethernet de ARGENTINA por Tipo de Uso Final
            • Residencial
            • Comercial
            • Industrial
          • Mercado de Adaptadores Ethernet de ARGENTINA por Tipo de Factor de Forma
            • Externo
            • Interno
          • Perspectiva del RESTO DE AMÉRICA DEL SUR (USD Mil millones, 2020-2034)
          • Mercado de Adaptadores Ethernet del RESTO DE AMÉRICA DEL SUR por Tipo
            • Adaptadores Ethernet USB
            • Adaptadores Ethernet PCI Express
            • Adaptadores Ethernet Thunderbolt
            • Adaptadores Ethernet Integrados
          • Mercado de Adaptadores Ethernet del RESTO DE AMÉRICA DEL SUR por Tipo de Velocidad de Conexión
            • 10/100 Mbps
            • 1 Gbps
            • 10 Gbps
            • 40 Gbps
          • Mercado de Adaptadores Ethernet del RESTO DE AMÉRICA DEL SUR por Tipo de Uso Final
            • Residencial
            • Comercial
            • Industrial
          • Mercado de Adaptadores Ethernet del RESTO DE AMÉRICA DEL SUR por Tipo de Factor de Forma
            • Externo
            • Interno
          • Perspectiva de MEA (USD Mil millones, 2020-2034)
            • Mercado de Adaptadores Ethernet de MEA por Tipo
              • Adaptadores Ethernet USB
              • Adaptadores Ethernet PCI Express
              • Adaptadores Ethernet Thunderbolt
              • Adaptadores Ethernet Integrados
            • Mercado de Adaptadores Ethernet de MEA por Tipo de Velocidad de Conexión
              • 10/100 Mbps
              • 1 Gbps
              • 10 Gbps
              • 40 Gbps
            • Mercado de Adaptadores Ethernet de MEA por Tipo de Uso Final
              • Residencial
              • Comercial
              • Industrial
            • Mercado de Adaptadores Ethernet de MEA por Tipo de Factor de Forma
              • Externo
              • Interno
            • Mercado de Adaptadores Ethernet de MEA por Tipo Regional
              • Países del CCG
              • Sudáfrica
              • Resto de MEA
            • Perspectiva de PAÍSES DEL CCG (USD Mil millones, 2020-2034)
            • Mercado de Adaptadores Ethernet de PAÍSES DEL CCG por Tipo
              • Adaptadores Ethernet USB
              • Adaptadores Ethernet PCI Express
              • Adaptadores Ethernet Thunderbolt
              • Adaptadores Ethernet Integrados
            • Mercado de Adaptadores Ethernet de PAÍSES DEL CCG por Tipo de Velocidad de Conexión
              • 10/100 Mbps
              • 1 Gbps
              • 10 Gbps
              • 40 Gbps
            • Mercado de Adaptadores Ethernet de PAÍSES DEL CCG por Tipo de Uso Final
              • Residencial
              • Comercial
              • Industrial
            • Mercado de Adaptadores Ethernet de PAÍSES DEL CCG por Tipo de Factor de Forma
              • Externo
              • Interno
            • Perspectiva de SUDÁFRICA (USD Mil millones, 2020-2034)
            • Mercado de Adaptadores Ethernet de SUDÁFRICA por Tipo
              • Adaptadores Ethernet USB
              • Adaptadores Ethernet PCI Express
              • Adaptadores Ethernet Thunderbolt
              • Adaptadores Ethernet Integrados
            • Mercado de Adaptadores Ethernet de SUDÁFRICA por Tipo de Velocidad de Conexión
              • 10/100 Mbps
              • 1 Gbps
              • 10 Gbps
              • 40 Gbps
            • Mercado de Adaptadores Ethernet de SUDÁFRICA por Tipo de Uso Final
              • Residencial
              • Comercial
              • Industrial
            • Mercado de Adaptadores Ethernet de SUDÁFRICA por Tipo de Factor de Forma
              • Externo
              • Interno
            • Perspectiva del RESTO DE MEA (USD Mil millones, 2020-2034)
            • Mercado de Adaptadores Ethernet del RESTO DE MEA por Tipo
              • Adaptadores Ethernet USB
              • Adaptadores Ethernet PCI Express
              • Adaptadores Ethernet Thunderbolt
              • Adaptadores Ethernet Integrados
            • Mercado de Adaptadores Ethernet del RESTO DE MEA por Tipo de Velocidad de Conexión
              • 10/100 Mbps
              • 1 Gbps
              • 10 Gbps
              • 40 Gbps
            • Mercado de Adaptadores Ethernet del RESTO DE MEA por Tipo de Uso Final
              • Residencial
              • Comercial
              • Industrial
            • Mercado de Adaptadores Ethernet del RESTO DE MEA por Tipo de Factor de Forma
              • Externo
              • Interno


Compare Licence

×
Features License Type
Single User Multiuser License Enterprise User
Price $4,950 $5,950 $7,250
Maximum User Access Limit 1 User Upto 10 Users Unrestricted Access Throughout the Organization
Free Customization
Direct Access to Analyst
Deliverable Format
Platform Access
Discount on Next Purchase 10% 15% 15%
Printable Versions