Request Free Sample ×

Kindly complete the form below to receive a free sample of this Report

* Please use a valid business email

Leading companies partner with us for data-driven Insights

clients tt-cursor
Hero Background

E Transit Metro Ethernet Service Market

ID: MRFR/ICT/33829-HCR
100 Pages
Aarti Dhapte
Last Updated: April 06, 2026

Informe de Investigación del Mercado de Servicio de Ethernet E-Transit Metro por Tipo de Servicio (Ethernet Privado, Ethernet Público, Ethernet Híbrido), por Tipo de Implementación (En las Instalaciones, Basado en la Nube, Híbrido), por Usuario Final (Pequeñas y Medianas Empresas, Grandes Empresas, Gobierno), por Aplicación (Conectividad de Centro de Datos, Acceso a Internet, Conectividad WAN) y por Región (América del Norte, Europa, América del Sur, Asia-Pacífico, Medio Oriente y África) - Pronóstico hasta 2035

Compartir
Download PDF ×

We do not share your information with anyone. However, we may send you emails based on your report interest from time to time. You may contact us at any time to opt-out.

E Transit Metro Ethernet Service Market Infographic
Purchase Options
  1. 1 RESUMEN EJECUTIVO
    1. 1.1 Visión General del Mercado
    2. 1.2 Hallazgos Clave
    3. 1.3 Segmentación del Mercado
    4. 1.4 Panorama Competitivo
    5. 1.5 Desafíos y Oportunidades
    6. 1.6 Perspectivas Futuras
  2. 2 INTRODUCCIÓN AL MERCADO
    1. 2.1 Definición
    2. 2.2 Alcance del estudio
      1. 2.2.1 Objetivo de la Investigación
      2. 2.2.2 Suposición
      3. 2.2.3 Limitaciones
  3. 3 METODOLOGÍA DE INVESTIGACIÓN
    1. 3.1 Visión General
    2. 3.2 Minería de Datos
    3. 3.3 Investigación Secundaria
    4. 3.4 Investigación Primaria
      1. 3.4.1 Entrevistas Primarias y Proceso de Recopilación de Información
      2. 3.4.2 Desglose de los Respondientes Primarios
    5. 3.5 Modelo de Pronóstico
    6. 3.6 Estimación del Tamaño del Mercado
      1. 3.6.1 Enfoque de Arriba hacia Abajo
      2. 3.6.2 Enfoque de Abajo hacia Arriba
    7. 3.7 Triangulación de Datos
    8. 3.8 Validación
  4. 4 DINÁMICAS DEL MERCADO
    1. 4.1 Visión General
    2. 4.2 Impulsores
    3. 4.3 Restricciones
    4. 4.4 Oportunidades
  5. 5 ANÁLISIS DE FACTORES DEL MERCADO
    1. 5.1 Análisis de la Cadena de Valor
    2. 5.2 Análisis de las Cinco Fuerzas de Porter
      1. 5.2.1 Poder de Negociación de los Proveedores
      2. 5.2.2 Poder de Negociación de los Compradores
      3. 5.2.3 Amenaza de Nuevos Entrantes
      4. 5.2.4 Amenaza de Sustitutos
      5. 5.2.5 Intensidad de la Rivalidad
    3. 5.3 Análisis del Impacto del COVID-19
      1. 5.3.1 Análisis del Impacto en el Mercado
      2. 5.3.2 Impacto Regional
      3. 5.3.3 Análisis de Oportunidades y Amenazas
  6. 6 MERCADO DE SERVICIOS DE E-TRANSIT METRO ETHERNET, POR TIPO DE SERVICIO (USD BILLONES)
    1. 6.1 Ethernet Privado
    2. 6.2 Ethernet Público
    3. 6.3 Ethernet Híbrido
  7. 7 MERCADO DE SERVICIOS DE E-TRANSIT METRO ETHERNET, POR TIPO DE DESPLIEGUE (USD BILLONES)
    1. 7.1 En las Instalaciones
    2. 7.2 Basado en la Nube
    3. 7.3 Híbrido
  8. 8 MERCADO DE SERVICIOS DE E-TRANSIT METRO ETHERNET, POR USUARIO FINAL (USD BILLONES)
    1. 8.1 Pequeñas y Medianas Empresas
    2. 8.2 Grandes Empresas
    3. 8.3 Gobierno
  9. 9 MERCADO DE SERVICIOS DE E-TRANSIT METRO ETHERNET, POR APLICACIÓN (USD BILLONES)
    1. 9.1 Conectividad de Centros de Datos
    2. 9.2 Acceso a Internet
    3. 9.3 Conectividad WAN
  10. 10 MERCADO DE SERVICIOS DE E-TRANSIT METRO ETHERNET, POR REGIÓN (USD BILLONES)
    1. 10.1 América del Norte
      1. 10.1.1 EE. UU.
      2. 10.1.2 Canadá
    2. 10.2 Europa
      1. 10.2.1 Alemania
      2. 10.2.2 Reino Unido
      3. 10.2.3 Francia
      4. 10.2.4 Rusia
      5. 10.2.5 Italia
      6. 10.2.6 España
      7. 10.2.7 Resto de Europa
    3. 10.3 APAC
      1. 10.3.1 China
      2. 10.3.2 India
      3. 10.3.3 Japón
      4. 10.3.4 Corea del Sur
      5. 10.3.5 Malasia
      6. 10.3.6 Tailandia
      7. 10.3.7 Indonesia
      8. 10.3.8 Resto de APAC
    4. 10.4 América del Sur
      1. 10.4.1 Brasil
      2. 10.4.2 México
      3. 10.4.3 Argentina
      4. 10.4.4 Resto de América del Sur
    5. 10.5 MEA
      1. 10.5.1 Países del CCG
      2. 10.5.2 Sudáfrica
      3. 10.5.3 Resto de MEA
  11. 11 PANORAMA COMPETITIVO
    1. 11.1 Visión General
    2. 11.2 Análisis Competitivo
    3. 11.3 Análisis de Participación de Mercado
    4. 11.4 Estrategia de Crecimiento Principal en el Mercado de Servicios de E-Transit Metro Ethernet
    5. 11.5 Evaluación Competitiva
    6. 11.6 Principales Actores en Términos de Número de Desarrollos en el Mercado de Servicios de E-Transit Metro Ethernet
    7. 11.7 Principales desarrollos y estrategias de crecimiento
      1. 11.7.1 Lanzamiento de Nuevos Productos/Despliegue de Servicios
      2. 11.7.2 Fusiones y Adquisiciones
      3. 11.7.3 Empresas Conjuntas
    8. 11.8 Matriz Financiera de los Principales Actores
      1. 11.8.1 Ventas e Ingresos Operativos
      2. 11.8.2 Gastos de I+D de los Principales Actores. 2023
  12. 12 PERFILES DE LAS EMPRESAS
    1. 12.1 BT Group
      1. 12.1.1 Visión General Financiera
      2. 12.1.2 Productos Ofrecidos
      3. 12.1.3 Principales Desarrollos
      4. 12.1.4 Análisis FODA
      5. 12.1.5 Estrategias Clave
    2. 12.2 Cisco Systems
      1. 12.2.1 Visión General Financiera
      2. 12.2.2 Productos Ofrecidos
      3. 12.2.3 Principales Desarrollos
      4. 12.2.4 Análisis FODA
      5. 12.2.5 Estrategias Clave
    3. 12.3 Juniper Networks
      1. 12.3.1 Visión General Financiera
      2. 12.3.2 Productos Ofrecidos
      3. 12.3.3 Principales Desarrollos
      4. 12.3.4 Análisis FODA
      5. 12.3.5 Estrategias Clave
    4. 12.4 CenturyLink
      1. 12.4.1 Visión General Financiera
      2. 12.4.2 Productos Ofrecidos
      3. 12.4.3 Principales Desarrollos
      4. 12.4.4 Análisis FODA
      5. 12.4.5 Estrategias Clave
    5. 12.5 HPE
      1. 12.5.1 Visión General Financiera
      2. 12.5.2 Productos Ofrecidos
      3. 12.5.3 Principales Desarrollos
      4. 12.5.4 Análisis FODA
      5. 12.5.5 Estrategias Clave
    6. 12.6 Ciena Corporation
      1. 12.6.1 Visión General Financiera
      2. 12.6.2 Productos Ofrecidos
      3. 12.6.3 Principales Desarrollos
      4. 12.6.4 Análisis FODA
      5. 12.6.5 Estrategias Clave
    7. 12.7 AT and T
      1. 12.7.1 Visión General Financiera
      2. 12.7.2 Productos Ofrecidos
      3. 12.7.3 Principales Desarrollos
      4. 12.7.4 Análisis FODA
      5. 12.7.5 Estrategias Clave
    8. 12.8 Nokia
      1. 12.8.1 Visión General Financiera
      2. 12.8.2 Productos Ofrecidos
      3. 12.8.3 Principales Desarrollos
      4. 12.8.4 Análisis FODA
      5. 12.8.5 Estrategias Clave
    9. 12.9 IBM
      1. 12.9.1 Visión General Financiera
      2. 12.9.2 Productos Ofrecidos
      3. 12.9.3 Principales Desarrollos
      4. 12.9.4 Análisis FODA
      5. 12.9.5 Estrategias Clave
    10. 12.10 Orange S.A.
      1. 12.10.1 Visión General Financiera
      2. 12.10.2 Productos Ofrecidos
      3. 12.10.3 Principales Desarrollos
      4. 12.10.4 Análisis FODA
      5. 12.10.5 Estrategias Clave
    11. 12.11 Mitel Networks
      1. 12.11.1 Visión General Financiera
      2. 12.11.2 Productos Ofrecidos
      3. 12.11.3 Principales Desarrollos
      4. 12.11.4 Análisis FODA
      5. 12.11.5 Estrategias Clave
    12. 12.12 Verizon Communications
      1. 12.12.1 Visión General Financiera
      2. 12.12.2 Productos Ofrecidos
      3. 12.12.3 Principales Desarrollos
      4. 12.12.4 Análisis FODA
      5. 12.12.5 Estrategias Clave
    13. 12.13 Vodafone Group
      1. 12.13.1 Visión General Financiera
      2. 12.13.2 Productos Ofrecidos
      3. 12.13.3 Principales Desarrollos
      4. 12.13.4 Análisis FODA
      5. 12.13.5 Estrategias Clave
    14. 12.14 Tata Communications
      1. 12.14.1 Visión General Financiera
      2. 12.14.2 Productos Ofrecidos
      3. 12.14.3 Principales Desarrollos
      4. 12.14.4 Análisis FODA
      5. 12.14.5 Estrategias Clave
    15. 12.15 Telstra
      1. 12.15.1 Visión General Financiera
      2. 12.15.2 Productos Ofrecidos
      3. 12.15.3 Principales Desarrollos
      4. 12.15.4 Análisis FODA
      5. 12.15.5 Estrategias Clave
  13. 13 APÉNDICE
    1. 13.1 Referencias
    2. 13.2 Informes Relacionados
    3. LISTA DE TABLAS
    4. TABLA 1. LISTA DE SUPOSICIONES
    5. TABLA 2. ESTIMACIONES Y PRONÓSTICO DEL TAMAÑO DEL MERCADO DE SERVICIOS DE E-TRANSIT METRO ETHERNET DE AMÉRICA DEL NORTE, POR TIPO DE SERVICIO, 2019-2032 (USD BILLONES)
    6. TABLA 3. ESTIMACIONES Y PRONÓSTICO DEL TAMAÑO DEL MERCADO DE SERVICIOS DE E-TRANSIT METRO ETHERNET DE AMÉRICA DEL NORTE, POR TIPO DE DESPLIEGUE, 2019-2032 (USD BILLONES)
    7. TABLA 4. ESTIMACIONES Y PRONÓSTICO DEL TAMAÑO DEL MERCADO DE SERVICIOS DE E-TRANSIT METRO ETHERNET DE AMÉRICA DEL NORTE, POR USUARIO FINAL, 2019-2032 (USD BILLONES)
    8. TABLA 5. ESTIMACIONES Y PRONÓSTICO DEL TAMAÑO DEL MERCADO DE SERVICIOS DE E-TRANSIT METRO ETHERNET DE AMÉRICA DEL NORTE, POR APLICACIÓN, 2019-2032 (USD BILLONES)
    9. TABLA 6. ESTIMACIONES Y PRONÓSTICO DEL TAMAÑO DEL MERCADO DE SERVICIOS DE E-TRANSIT METRO ETHERNET DE AMÉRICA DEL NORTE, POR REGIÓN, 2019-2032 (USD BILLONES)
    10. TABLA 7. ESTIMACIONES Y PRONÓSTICO DEL TAMAÑO DEL MERCADO DE SERVICIOS DE E-TRANSIT METRO ETHERNET DE EE. UU., POR TIPO DE SERVICIO, 2019-2032 (USD BILLONES)
    11. TABLA 8. ESTIMACIONES Y PRONÓSTICO DEL TAMAÑO DEL MERCADO DE SERVICIOS DE E-TRANSIT METRO ETHERNET DE EE. UU., POR TIPO DE DESPLIEGUE, 2019-2032 (USD BILLONES)
    12. TABLA 9. ESTIMACIONES Y PRONÓSTICO DEL TAMAÑO DEL MERCADO DE SERVICIOS DE E-TRANSIT METRO ETHERNET DE EE. UU., POR USUARIO FINAL, 2019-2032 (USD BILLONES)
    13. TABLA 10. ESTIMACIONES Y PRONÓSTICO DEL TAMAÑO DEL MERCADO DE SERVICIOS DE E-TRANSIT METRO ETHERNET DE EE. UU., POR APLICACIÓN, 2019-2032 (USD BILLONES)
    14. TABLA 11. ESTIMACIONES Y PRONÓSTICO DEL TAMAÑO DEL MERCADO DE SERVICIOS DE E-TRANSIT METRO ETHERNET DE EE. UU., POR REGIÓN, 2019-2032 (USD BILLONES)
    15. TABLA 12. ESTIMACIONES Y PRONÓSTICO DEL TAMAÑO DEL MERCADO DE SERVICIOS DE E-TRANSIT METRO ETHERNET DE CANADÁ, POR TIPO DE SERVICIO, 2019-2032 (USD BILLONES)
    16. TABLA 13. ESTIMACIONES Y PRONÓSTICO DEL TAMAÑO DEL MERCADO DE SERVICIOS DE E-TRANSIT METRO ETHERNET DE CANADÁ, POR TIPO DE DESPLIEGUE, 2019-2032 (USD BILLONES)
    17. TABLA 14. ESTIMACIONES Y PRONÓSTICO DEL TAMAÑO DEL MERCADO DE SERVICIOS DE E-TRANSIT METRO ETHERNET DE CANADÁ, POR USUARIO FINAL, 2019-2032 (USD BILLONES)
    18. TABLA 15. ESTIMACIONES Y PRONÓSTICO DEL TAMAÑO DEL MERCADO DE SERVICIOS DE E-TRANSIT METRO ETHERNET DE CANADÁ, POR APLICACIÓN, 2019-2032 (USD BILLONES)
    19. TABLA 16. ESTIMACIONES Y PRONÓSTICO DEL TAMAÑO DEL MERCADO DE SERVICIOS DE E-TRANSIT METRO ETHERNET DE CANADÁ, POR REGIÓN, 2019-2032 (USD BILLONES)
    20. TABLA 17. ESTIMACIONES Y PRONÓSTICO DEL TAMAÑO DEL MERCADO DE SERVICIOS DE E-TRANSIT METRO ETHERNET DE EUROPA, POR TIPO DE SERVICIO, 2019-2032 (USD BILLONES)
    21. TABLA 18. ESTIMACIONES Y PRONÓSTICO DEL TAMAÑO DEL MERCADO DE SERVICIOS DE E-TRANSIT METRO ETHERNET DE EUROPA, POR TIPO DE DESPLIEGUE, 2019-2032 (USD BILLONES)
    22. TABLA 19. ESTIMACIONES Y PRONÓSTICO DEL TAMAÑO DEL MERCADO DE SERVICIOS DE E-TRANSIT METRO ETHERNET DE EUROPA, POR USUARIO FINAL, 2019-2032 (USD BILLONES)
    23. TABLA 20. ESTIMACIONES Y PRONÓSTICO DEL TAMAÑO DEL MERCADO DE SERVICIOS DE E-TRANSIT METRO ETHERNET DE EUROPA, POR APLICACIÓN, 2019-2032 (USD BILLONES)
    24. TABLA 21. ESTIMACIONES Y PRONÓSTICO DEL TAMAÑO DEL MERCADO DE SERVICIOS DE E-TRANSIT METRO ETHERNET DE EUROPA, POR REGIÓN, 2019-2032 (USD BILLONES)
    25. TABLA 22. ESTIMACIONES Y PRONÓSTICO DEL TAMAÑO DEL MERCADO DE SERVICIOS DE E-TRANSIT METRO ETHERNET DE ALEMANIA, POR TIPO DE SERVICIO, 2019-2032 (USD BILLONES)
    26. TABLA 23. ESTIMACIONES Y PRONÓSTICO DEL TAMAÑO DEL MERCADO DE SERVICIOS DE E-TRANSIT METRO ETHERNET DE ALEMANIA, POR TIPO DE DESPLIEGUE, 2019-2032 (USD BILLONES)
    27. TABLA 24. ESTIMACIONES Y PRONÓSTICO DEL TAMAÑO DEL MERCADO DE SERVICIOS DE E-TRANSIT METRO ETHERNET DE ALEMANIA, POR USUARIO FINAL, 2019-2032 (USD BILLONES)
    28. TABLA 25. ESTIMACIONES Y PRONÓSTICO DEL TAMAÑO DEL MERCADO DE SERVICIOS DE E-TRANSIT METRO ETHERNET DE ALEMANIA, POR APLICACIÓN, 2019-2032 (USD BILLONES)
    29. TABLA 26. ESTIMACIONES Y PRONÓSTICO DEL TAMAÑO DEL MERCADO DE SERVICIOS DE E-TRANSIT METRO ETHERNET DE ALEMANIA, POR REGIÓN, 2019-2032 (USD BILLONES)
    30. TABLA 27. ESTIMACIONES Y PRONÓSTICO DEL TAMAÑO DEL MERCADO DE SERVICIOS DE E-TRANSIT METRO ETHERNET DEL REINO UNIDO, POR TIPO DE SERVICIO, 2019-2032 (USD BILLONES)
    31. TABLA 28. ESTIMACIONES Y PRONÓSTICO DEL TAMAÑO DEL MERCADO DE SERVICIOS DE E-TRANSIT METRO ETHERNET DEL REINO UNIDO, POR TIPO DE DESPLIEGUE, 2019-2032 (USD BILLONES)
    32. TABLA 29. ESTIMACIONES Y PRONÓSTICO DEL TAMAÑO DEL MERCADO DE SERVICIOS DE E-TRANSIT METRO ETHERNET DEL REINO UNIDO, POR USUARIO FINAL, 2019-2032 (USD BILLONES)
    33. TABLA 30. ESTIMACIONES Y PRONÓSTICO DEL TAMAÑO DEL MERCADO DE SERVICIOS DE E-TRANSIT METRO ETHERNET DEL REINO UNIDO, POR APLICACIÓN, 2019-2032 (USD BILLONES)
    34. TABLA 31. ESTIMACIONES Y PRONÓSTICO DEL TAMAÑO DEL MERCADO DE SERVICIOS DE E-TRANSIT METRO ETHERNET DEL REINO UNIDO, POR REGIÓN, 2019-2032 (USD BILLONES)
    35. TABLA 32. ESTIMACIONES Y PRONÓSTICO DEL TAMAÑO DEL MERCADO DE SERVICIOS DE E-TRANSIT METRO ETHERNET DE FRANCIA, POR TIPO DE SERVICIO, 2019-2032 (USD BILLONES)
    36. TABLA 33. ESTIMACIONES Y PRONÓSTICO DEL TAMAÑO DEL MERCADO DE SERVICIOS DE E-TRANSIT METRO ETHERNET DE FRANCIA, POR TIPO DE DESPLIEGUE, 2019-2032 (USD BILLONES)
    37. TABLA 34. ESTIMACIONES Y PRONÓSTICO DEL TAMAÑO DEL MERCADO DE SERVICIOS DE E-TRANSIT METRO ETHERNET DE FRANCIA, POR USUARIO FINAL, 2019-2032 (USD BILLONES)
    38. TABLA 35. ESTIMACIONES Y PRONÓSTICO DEL TAMAÑO DEL MERCADO DE SERVICIOS DE E-TRANSIT METRO ETHERNET DE FRANCIA, POR APLICACIÓN, 2019-2032 (USD BILLONES)
    39. TABLA 36. ESTIMACIONES Y PRONÓSTICO DEL TAMAÑO DEL MERCADO DE SERVICIOS DE E-TRANSIT METRO ETHERNET DE FRANCIA, POR REGIÓN, 2019-2032 (USD BILLONES)
    40. TABLA 37. ESTIMACIONES Y PRONÓSTICO DEL TAMAÑO DEL MERCADO DE SERVICIOS DE E-TRANSIT METRO ETHERNET DE RUSIA, POR TIPO DE SERVICIO, 2019-2032 (USD BILLONES)
    41. TABLA 38. ESTIMACIONES Y PRONÓSTICO DEL TAMAÑO DEL MERCADO DE SERVICIOS DE E-TRANSIT METRO ETHERNET DE RUSIA, POR TIPO DE DESPLIEGUE, 2019-2032 (USD BILLONES)
    42. TABLA 39. ESTIMACIONES Y PRONÓSTICO DEL TAMAÑO DEL MERCADO DE SERVICIOS DE E-TRANSIT METRO ETHERNET DE RUSIA, POR USUARIO FINAL, 2019-2032 (USD BILLONES)
    43. TABLA 40. ESTIMACIONES Y PRONÓSTICO DEL TAMAÑO DEL MERCADO DE SERVICIOS DE E-TRANSIT METRO ETHERNET DE RUSIA, POR APLICACIÓN, 2019-2032 (USD BILLONES)
    44. TABLA 41. ESTIMACIONES Y PRONÓSTICO DEL TAMAÑO DEL MERCADO DE SERVICIOS DE E-TRANSIT METRO ETHERNET DE RUSIA, POR REGIÓN, 2019-2032 (USD BILLONES)
    45. TABLA 42. ESTIMACIONES Y PRONÓSTICO DEL TAMAÑO DEL MERCADO DE SERVICIOS DE E-TRANSIT METRO ETHERNET DE ITALIA, POR TIPO DE SERVICIO, 2019-2032 (USD BILLONES)
    46. TABLA 43. ESTIMACIONES Y PRONÓSTICO DEL TAMAÑO DEL MERCADO DE SERVICIOS DE E-TRANSIT METRO ETHERNET DE ITALIA, POR TIPO DE DESPLIEGUE, 2019-2032 (USD BILLONES)
    47. TABLA 44. ESTIMACIONES Y PRONÓSTICO DEL TAMAÑO DEL MERCADO DE SERVICIOS DE E-TRANSIT METRO ETHERNET DE ITALIA, POR USUARIO FINAL, 2019-2032 (USD BILLONES)
    48. TABLA 45. ESTIMACIONES Y PRONÓSTICO DEL TAMAÑO DEL MERCADO DE SERVICIOS DE E-TRANSIT METRO ETHERNET DE ITALIA, POR APLICACIÓN, 2019-2032 (USD BILLONES)
    49. TABLA 46. ESTIMACIONES Y PRONÓSTICO DEL TAMAÑO DEL MERCADO DE SERVICIOS DE E-TRANSIT METRO ETHERNET DE ITALIA, POR REGIÓN, 2019-2032 (USD BILLONES)
    50. TABLA 47. ESTIMACIONES Y PRONÓSTICO DEL TAMAÑO DEL MERCADO DE SERVICIOS DE E-TRANSIT METRO ETHERNET DE ESPAÑA, POR TIPO DE SERVICIO, 2019-2032 (USD BILLONES)
    51. TABLA 48. ESTIMACIONES Y PRONÓSTICO DEL TAMAÑO DEL MERCADO DE SERVICIOS DE E-TRANSIT METRO ETHERNET DE ESPAÑA, POR TIPO DE DESPLIEGUE, 2019-2032 (USD BILLONES)
    52. TABLA 49. ESTIMACIONES Y PRONÓSTICO DEL TAMAÑO DEL MERCADO DE SERVICIOS DE E-TRANSIT METRO ETHERNET DE ESPAÑA, POR USUARIO FINAL, 2019-2032 (USD BILLONES)
    53. TABLA 50. ESTIMACIONES Y PRONÓSTICO DEL TAMAÑO DEL MERCADO DE SERVICIOS DE E-TRANSIT METRO ETHERNET DE ESPAÑA, POR APLICACIÓN, 2019-2032 (USD BILLONES)
    54. TABLA 51. ESTIMACIONES Y PRONÓSTICO DEL TAMAÑO DEL MERCADO DE SERVICIOS DE E-TRANSIT METRO ETHERNET DE ESPAÑA, POR REGIÓN, 2019-2032 (USD BILLONES)
    55. TABLA 52. ESTIMACIONES Y PRONÓSTICO DEL TAMAÑO DEL MERCADO DE SERVICIOS DE E-TRANSIT METRO ETHERNET DEL RESTO DE EUROPA, POR TIPO DE SERVICIO, 2019-2032 (USD BILLONES)
    56. TABLA 53. ESTIMACIONES Y PRONÓSTICO DEL TAMAÑO DEL MERCADO DE SERVICIOS DE E-TRANSIT METRO ETHERNET DEL RESTO DE EUROPA, POR TIPO DE DESPLIEGUE, 2019-2032 (USD BILLONES)
    57. TABLA 54. ESTIMACIONES Y PRONÓSTICO DEL TAMAÑO DEL MERCADO DE SERVICIOS DE E-TRANSIT METRO ETHERNET DEL RESTO DE EUROPA, POR USUARIO FINAL, 2019-2032 (USD BILLONES)
    58. TABLA 55. ESTIMACIONES Y PRONÓSTICO DEL TAMAÑO DEL MERCADO DE SERVICIOS DE E-TRANSIT METRO ETHERNET DEL RESTO DE EUROPA, POR APLICACIÓN, 2019-2032 (USD BILLONES)
    59. TABLA 56. ESTIMACIONES Y PRONÓSTICO DEL TAMAÑO DEL MERCADO DE SERVICIOS DE E-TRANSIT METRO ETHERNET DEL RESTO DE EUROPA, POR REGIÓN, 2019-2032 (USD BILLONES)
    60. TABLA 57. ESTIMACIONES Y PRONÓSTICO DEL TAMAÑO DEL MERCADO DE SERVICIOS DE E-TRANSIT METRO ETHERNET DE APAC, POR TIPO DE SERVICIO, 2019-2032 (USD BILLONES)
    61. TABLA 58. ESTIMACIONES Y PRONÓSTICO DEL TAMAÑO DEL MERCADO DE SERVICIOS DE E-TRANSIT METRO ETHERNET DE APAC, POR TIPO DE DESPLIEGUE, 2019-2032 (USD BILLONES)
    62. TABLA 59. ESTIMACIONES Y PRONÓSTICO DEL TAMAÑO DEL MERCADO DE SERVICIOS DE E-TRANSIT METRO ETHERNET DE APAC, POR USUARIO FINAL, 2019-2032 (USD BILLONES)
    63. TABLA 60. ESTIMACIONES Y PRONÓSTICO DEL TAMAÑO DEL MERCADO DE SERVICIOS DE E-TRANSIT METRO ETHERNET DE APAC, POR APLICACIÓN, 2019-2032 (USD BILLONES)
    64. TABLA 61. ESTIMACIONES Y PRONÓSTICO DEL TAMAÑO DEL MERCADO DE SERVICIOS DE E-TRANSIT METRO ETHERNET DE APAC, POR REGIÓN, 2019-2032 (USD BILLONES)
    65. TABLA 62. ESTIMACIONES Y PRONÓSTICO DEL TAMAÑO DEL MERCADO DE SERVICIOS DE E-TRANSIT METRO ETHERNET DE CHINA, POR TIPO DE SERVICIO, 2019-2032 (USD BILLONES)
    66. TABLA 63. ESTIMACIONES Y PRONÓSTICO DEL TAMAÑO DEL MERCADO DE SERVICIOS DE E-TRANSIT METRO ETHERNET DE CHINA, POR TIPO DE DESPLIEGUE, 2019-2032 (USD BILLONES)
    67. TABLA 64. ESTIMACIONES Y PRONÓSTICO DEL TAMAÑO DEL MERCADO DE SERVICIOS DE E-TRANSIT METRO ETHERNET DE CHINA, POR USUARIO FINAL, 2019-2032 (USD BILLONES)
    68. TABLA 65. ESTIMACIONES Y PRONÓSTICO DEL TAMAÑO DEL MERCADO DE SERVICIOS DE E-TRANSIT METRO ETHERNET DE CHINA, POR APLICACIÓN, 2019-2032 (USD BILLONES)
    69. TABLA 66. ESTIMACIONES Y PRONÓSTICO DEL TAMAÑO DEL MERCADO DE SERVICIOS DE E-TRANSIT METRO ETHERNET DE CHINA, POR REGIÓN, 2019-2032 (USD BILLONES)
    70. TABLA 67. ESTIMACIONES Y PRONÓSTICO DEL TAMAÑO DEL MERCADO DE SERVICIOS DE E-TRANSIT METRO ETHERNET DE INDIA, POR TIPO DE SERVICIO, 2019-2032 (USD BILLONES)
    71. TABLA 68. ESTIMACIONES Y PRONÓSTICO DEL TAMAÑO DEL MERCADO DE SERVICIOS DE E-TRANSIT METRO ETHERNET DE INDIA, POR TIPO DE DESPLIEGUE, 2019-2032 (USD BILLONES)
    72. TABLA 69. ESTIMACIONES Y PRONÓSTICO DEL TAMAÑO DEL MERCADO DE SERVICIOS DE E-TRANSIT METRO ETHERNET DE INDIA, POR USUARIO FINAL, 2019-2032 (USD BILLONES)
    73. TABLA 70. ESTIMACIONES Y PRONÓSTICO DEL TAMAÑO DEL MERCADO DE SERVICIOS DE E-TRANSIT METRO ETHERNET DE INDIA, POR APLICACIÓN, 2019-2032 (USD BILLONES)
    74. TABLA 71. ESTIMACIONES Y PRONÓSTICO DEL TAMAÑO DEL MERCADO DE SERVICIOS DE E-TRANSIT METRO ETHERNET DE INDIA, POR REGIÓN, 2019-2032 (USD BILLONES)
    75. TABLA 72. ESTIMACIONES Y PRONÓSTICO DEL TAMAÑO DEL MERCADO DE SERVICIOS DE E-TRANSIT METRO ETHERNET DE JAPÓN, POR TIPO DE SERVICIO, 2019-2032 (USD BILLONES)
    76. TABLA 73. ESTIMACIONES Y PRONÓSTICO DEL TAMAÑO DEL MERCADO DE SERVICIOS DE E-TRANSIT METRO ETHERNET DE JAPÓN, POR TIPO DE DESPLIEGUE, 2019-2032 (USD BILLONES)
    77. TABLA 74. ESTIMACIONES Y PRONÓSTICO DEL TAMAÑO DEL MERCADO DE SERVICIOS DE E-TRANSIT METRO ETHERNET DE JAPÓN, POR USUARIO FINAL, 2019-2032 (USD BILLONES)
    78. TABLA 75. ESTIMACIONES Y PRONÓSTICO DEL TAMAÑO DEL MERCADO DE SERVICIOS DE E-TRANSIT METRO ETHERNET DE JAPÓN, POR APLICACIÓN, 2019-2032 (USD BILLONES)
    79. TABLA 76. ESTIMACIONES Y PRONÓSTICO DEL TAMAÑO DEL MERCADO DE SERVICIOS DE E-TRANSIT METRO ETHERNET DE JAPÓN, POR REGIÓN, 2019-2032 (USD BILLONES)
    80. TABLA 77. ESTIMACIONES Y PRONÓSTICO DEL TAMAÑO DEL MERCADO DE SERVICIOS DE E-TRANSIT METRO ETHERNET DE COREA DEL SUR, POR TIPO DE SERVICIO, 2019-2032 (USD BILLONES)
    81. TABLA 78. ESTIMACIONES Y PRONÓSTICO DEL TAMAÑO DEL MERCADO DE SERVICIOS DE E-TRANSIT METRO ETHERNET DE COREA DEL SUR, POR TIPO DE DESPLIEGUE, 2019-2032 (USD BILLONES)
    82. TABLA 79. ESTIMACIONES Y PRONÓSTICO DEL TAMAÑO DEL MERCADO DE SERVICIOS DE E-TRANSIT METRO ETHERNET DE COREA DEL SUR, POR USUARIO FINAL, 2019-2032 (USD BILLONES)
    83. TABLA 80. ESTIMACIONES Y PRONÓSTICO DEL TAMAÑO DEL MERCADO DE SERVICIOS DE E-TRANSIT METRO ETHERNET DE COREA DEL SUR, POR APLICACIÓN, 2019-2032 (USD BILLONES)
    84. TABLA 81. ESTIMACIONES Y PRONÓSTICO DEL TAMAÑO DEL MERCADO DE SERVICIOS DE E-TRANSIT METRO ETHERNET DE COREA DEL SUR, POR REGIÓN, 2019-2032 (USD BILLONES)
    85. TABLA 82. ESTIMACIONES Y PRONÓSTICO DEL TAMAÑO DEL MERCADO DE SERVICIOS DE E-TRANSIT METRO ETHERNET DE MALASIA, POR TIPO DE SERVICIO, 2019-2032 (USD BILLONES)
    86. TABLA 83. ESTIMACIONES Y PRONÓSTICO DEL TAMAÑO DEL MERCADO DE SERVICIOS DE E-TRANSIT METRO ETHERNET DE MALASIA, POR TIPO DE DESPLIEGUE, 2019-2032 (USD BILLONES)
    87. TABLA 84. ESTIMACIONES Y PRONÓSTICO DEL TAMAÑO DEL MERCADO DE SERVICIOS DE E-TRANSIT METRO ETHERNET DE MALASIA, POR USUARIO FINAL, 2019-2032 (USD BILLONES)
    88. TABLA 85. ESTIMACIONES Y PRONÓSTICO DEL TAMAÑO DEL MERCADO DE SERVICIOS DE E-TRANSIT METRO ETHERNET DE MALASIA, POR APLICACIÓN, 2019-2032 (USD BILLONES)
    89. TABLA 86. ESTIMACIONES Y PRONÓSTICO DEL TAMAÑO DEL MERCADO DE SERVICIOS DE E-TRANSIT METRO ETHERNET DE MALASIA, POR REGIÓN, 2019-2032 (USD BILLONES)
    90. TABLA 87. ESTIMACIONES Y PRONÓSTICO DEL TAMAÑO DEL MERCADO DE SERVICIOS DE E-TRANSIT METRO ETHERNET DE TAILANDIA, POR TIPO DE SERVICIO, 2019-2032 (USD BILLONES)
    91. TABLA 88. ESTIMACIONES Y PRONÓSTICO DEL TAMAÑO DEL MERCADO DE SERVICIOS DE E-TRANSIT METRO ETHERNET DE TAILANDIA, POR TIPO DE DESPLIEGUE, 2019-2032 (USD BILLONES)
    92. TABLA 89. ESTIMACIONES Y PRONÓSTICO DEL TAMAÑO DEL MERCADO DE SERVICIOS DE E-TRANSIT METRO ETHERNET DE TAILANDIA, POR USUARIO FINAL, 2019-2032 (USD BILLONES)
    93. TABLA 90. ESTIMACIONES Y PRONÓSTICO DEL TAMAÑO DEL MERCADO DE SERVICIOS DE E-TRANSIT METRO ETHERNET DE TAILANDIA, POR APLICACIÓN, 2019-2032 (USD BILLONES)
    94. TABLA 91. ESTIMACIONES Y PRONÓSTICO DEL TAMAÑO DEL MERCADO DE SERVICIOS DE E-TRANSIT METRO ETHERNET DE TAILANDIA, POR REGIÓN, 2019-2032 (USD BILLONES)
    95. TABLA 92. ESTIMACIONES Y PRONÓSTICO DEL TAMAÑO DEL MERCADO DE SERVICIOS DE E-TRANSIT METRO ETHERNET DE INDONESIA, POR TIPO DE SERVICIO, 2019-2032 (USD BILLONES)
    96. TABLA 93. ESTIMACIONES Y PRONÓSTICO DEL TAMAÑO DEL MERCADO DE SERVICIOS DE E-TRANSIT METRO ETHERNET DE INDONESIA, POR TIPO DE DESPLIEGUE, 2019-2032 (USD BILLONES)
    97. TABLA 94. ESTIMACIONES Y PRONÓSTICO DEL TAMAÑO DEL MERCADO DE SERVICIOS DE E-TRANSIT METRO ETHERNET DE INDONESIA, POR USUARIO FINAL, 2019-2032 (USD BILLONES)
    98. TABLA 95. ESTIMACIONES Y PRONÓSTICO DEL TAMAÑO DEL MERCADO DE SERVICIOS DE E-TRANSIT METRO ETHERNET DE INDONESIA, POR APLICACIÓN, 2019-2032 (USD BILLONES)
    99. TABLA 96. ESTIMACIONES Y PRONÓSTICO DEL TAMAÑO DEL MERCADO DE SERVICIOS DE E-TRANSIT METRO ETHERNET DE INDONESIA, POR REGIÓN, 2019-2032 (USD BILLONES)
    100. TABLA 97. ESTIMACIONES Y PRONÓSTICO DEL TAMAÑO DEL MERCADO DE SERVICIOS DE E-TRANSIT METRO ETHERNET DEL RESTO DE APAC, POR TIPO DE SERVICIO, 2019-2032 (USD BILLONES)
    101. TABLA 98. ESTIMACIONES Y PRONÓSTICO DEL TAMAÑO DEL MERCADO DE SERVICIOS DE E-TRANSIT METRO ETHERNET DEL RESTO DE APAC, POR TIPO DE DESPLIEGUE, 2019-2032 (USD BILLONES)
    102. TABLA 99. ESTIMACIONES Y PRONÓSTICO DEL TAMAÑO DEL MERCADO DE SERVICIOS DE E-TRANSIT METRO ETHERNET DEL RESTO DE APAC, POR USUARIO FINAL, 2019-2032 (USD BILLONES)
    103. TABLA 100. ESTIMACIONES Y PRONÓSTICO DEL TAMAÑO DEL MERCADO DE SERVICIOS DE E-TRANSIT METRO ETHERNET DEL RESTO DE APAC, POR APLICACIÓN, 2019-2032 (USD BILLONES)
    104. TABLA 101. ESTIMACIONES Y PRONÓSTICO DEL TAMAÑO DEL MERCADO DE SERVICIOS DE E-TRANSIT METRO ETHERNET DEL RESTO DE APAC, POR REGIÓN, 2019-2032 (USD BILLONES)
    105. TABLA 102. ESTIMACIONES Y PRONÓSTICO DEL TAMAÑO DEL MERCADO DE SERVICIOS DE E-TRANSIT METRO ETHERNET DE AMÉRICA DEL SUR, POR TIPO DE SERVICIO, 2019-2032 (USD BILLONES)
    106. TABLA 103. ESTIMACIONES Y PRONÓSTICO DEL TAMAÑO DEL MERCADO DE SERVICIOS DE E-TRANSIT METRO ETHERNET DE AMÉRICA DEL SUR, POR TIPO DE DESPLIEGUE, 2019-2032 (USD BILLONES)
    107. TABLA 104. ESTIMACIONES Y PRONÓSTICO DEL TAMAÑO DEL MERCADO DE SERVICIOS DE E-TRANSIT METRO ETHERNET DE AMÉRICA DEL SUR, POR USUARIO FINAL, 2019-2032 (USD BILLONES)
    108. TABLA 105. ESTIMACIONES Y PRONÓSTICO DEL TAMAÑO DEL MERCADO DE SERVICIOS DE E-TRANSIT METRO ETHERNET DE AMÉRICA DEL SUR, POR APLICACIÓN, 2019-2032 (USD BILLONES)
    109. TABLA 106. ESTIMACIONES Y PRONÓSTICO DEL TAMAÑO DEL MERCADO DE SERVICIOS DE E-TRANSIT METRO ETHERNET DE AMÉRICA DEL SUR, POR REGIÓN, 2019-2032 (USD BILLONES)
    110. TABLA 107. ESTIMACIONES Y PRONÓSTICO DEL TAMAÑO DEL MERCADO DE SERVICIOS DE E-TRANSIT METRO ETHERNET DE BRASIL, POR TIPO DE SERVICIO, 2019-2032 (USD BILLONES)
    111. TABLA 108. ESTIMACIONES Y PRONÓSTICO DEL TAMAÑO DEL MERCADO DE SERVICIOS DE E-TRANSIT METRO ETHERNET DE BRASIL, POR TIPO DE DESPLIEGUE, 2019-2032 (USD BILLONES)
    112. TABLA 109. ESTIMACIONES Y PRONÓSTICO DEL TAMAÑO DEL MERCADO DE SERVICIOS DE E-TRANSIT METRO ETHERNET DE BRASIL, POR USUARIO FINAL, 2019-2032 (USD BILLONES)
    113. TABLA 110. ESTIMACIONES Y PRONÓSTICO DEL TAMAÑO DEL MERCADO DE SERVICIOS DE E-TRANSIT METRO ETHERNET DE BRASIL, POR APLICACIÓN, 2019-2032 (USD BILLONES)
    114. TABLA 111. ESTIMACIONES Y PRONÓSTICO DEL TAMAÑO DEL MERCADO DE SERVICIOS DE E-TRANSIT METRO ETHERNET DE BRASIL, POR REGIÓN, 2019-2032 (USD BILLONES)
    115. TABLA 112. ESTIMACIONES Y PRONÓSTICO DEL TAMAÑO DEL MERCADO DE SERVICIOS DE E-TRANSIT METRO ETHERNET DE MÉXICO, POR TIPO DE SERVICIO, 2019-2032 (USD BILLONES)
    116. TABLA 113. ESTIMACIONES Y PRONÓSTICO DEL TAMAÑO DEL MERCADO DE SERVICIOS DE E-TRANSIT METRO ETHERNET DE MÉXICO, POR TIPO DE DESPLIEGUE, 2019-2032 (USD BILLONES)
    117. TABLA 114. ESTIMACIONES Y PRONÓSTICO DEL TAMAÑO DEL MERCADO DE SERVICIOS DE E-TRANSIT METRO ETHERNET DE MÉXICO, POR USUARIO FINAL, 2019-2032 (USD BILLONES)
    118. TABLA 115. ESTIMACIONES Y PRONÓSTICO DEL TAMAÑO DEL MERCADO DE SERVICIOS DE E-TRANSIT METRO ETHERNET DE MÉXICO, POR APLICACIÓN, 2019-2032 (USD BILLONES)
    119. TABLA 116. ESTIMACIONES Y PRONÓSTICO DEL TAMAÑO DEL MERCADO DE SERVICIOS DE E-TRANSIT METRO ETHERNET DE MÉXICO, POR REGIÓN, 2019-2032 (USD BILLONES)
    120. TABLA 117. ESTIMACIONES Y PRONÓSTICO DEL TAMAÑO DEL MERCADO DE SERVICIOS DE E-TRANSIT METRO ETHERNET DE ARGENTINA, POR TIPO DE SERVICIO, 2019-2032 (USD BILLONES)
    121. TABLA 118. ESTIMACIONES Y PRONÓSTICO DEL TAMAÑO DEL MERCADO DE SERVICIOS DE E-TRANSIT METRO ETHERNET DE ARGENTINA, POR TIPO DE DESPLIEGUE, 2019-2032 (USD BILLONES)
    122. TABLA 119. ESTIMACIONES Y PRONÓSTICO DEL TAMAÑO DEL MERCADO DE SERVICIOS DE E-TRANSIT METRO ETHERNET DE ARGENTINA, POR USUARIO FINAL, 2019-2032 (USD BILLONES)
    123. TABLA 120. ESTIMACIONES Y PRONÓSTICO DEL TAMAÑO DEL MERCADO DE SERVICIOS DE E-TRANSIT METRO ETHERNET DE ARGENTINA, POR APLICACIÓN, 2019-2032 (USD BILLONES)
    124. TABLA 121. ESTIMACIONES Y PRONÓSTICO DEL TAMAÑO DEL MERCADO DE SERVICIOS DE E-TRANSIT METRO ETHERNET DE ARGENTINA, POR REGIÓN, 2019-2032 (USD BILLONES)
    125. TABLA 122. ESTIMACIONES Y PRONÓSTICO DEL TAMAÑO DEL MERCADO DE SERVICIOS DE E-TRANSIT METRO ETHERNET DEL RESTO DE AMÉRICA DEL SUR, POR TIPO DE SERVICIO, 2019-2032 (USD BILLONES)
    126. TABLA 123. ESTIMACIONES Y PRONÓSTICO DEL TAMAÑO DEL MERCADO DE SERVICIOS DE E-TRANSIT METRO ETHERNET DEL RESTO DE AMÉRICA DEL SUR, POR TIPO DE DESPLIEGUE, 2019-2032 (USD BILLONES)
    127. TABLA 124. ESTIMACIONES Y PRONÓSTICO DEL TAMAÑO DEL MERCADO DE SERVICIOS DE E-TRANSIT METRO ETHERNET DEL RESTO DE AMÉRICA DEL SUR, POR USUARIO FINAL, 2019-2032 (USD BILLONES)
    128. TABLA 125. ESTIMACIONES Y PRONÓSTICO DEL TAMAÑO DEL MERCADO DE SERVICIOS DE E-TRANSIT METRO ETHERNET DEL RESTO DE AMÉRICA DEL SUR, POR APLICACIÓN, 2019-2032 (USD BILLONES)
    129. TABLA 126. ESTIMACIONES Y PRONÓSTICO DEL TAMAÑO DEL MERCADO DE SERVICIOS DE E-TRANSIT METRO ETHERNET DEL RESTO DE AMÉRICA DEL SUR, POR REGIÓN, 2019-2032 (USD BILLONES)
    130. TABLA 127. ESTIMACIONES Y PRONÓSTICO DEL TAMAÑO DEL MERCADO DE SERVICIOS DE E-TRANSIT METRO ETHERNET DE MEA, POR TIPO DE SERVICIO, 2019-2032 (USD BILLONES)
    131. TABLA 128. ESTIMACIONES Y PRONÓSTICO DEL TAMAÑO DEL MERCADO DE SERVICIOS DE E-TRANSIT METRO ETHERNET DE MEA, POR TIPO DE DESPLIEGUE, 2019-2032 (USD BILLONES)
    132. TABLA 129. ESTIMACIONES Y PRONÓSTICO DEL TAMAÑO DEL MERCADO DE SERVICIOS DE E-TRANSIT METRO ETHERNET DE MEA, POR USUARIO FINAL, 2019-2032 (USD BILLONES)
    133. TABLA 130. ESTIMACIONES Y PRONÓSTICO DEL TAMAÑO DEL MERCADO DE SERVICIOS DE E-TRANSIT METRO ETHERNET DE MEA, POR APLICACIÓN, 2019-2032 (USD BILLONES)
    134. TABLA 131. ESTIMACIONES Y PRONÓSTICO DEL TAMAÑO DEL MERCADO DE SERVICIOS DE E-TRANSIT METRO ETHERNET DE MEA, POR REGIÓN, 2019-2032 (USD BILLONES)
    135. TABLA 132. ESTIMACIONES Y PRONÓSTICO DEL TAMAÑO DEL MERCADO DE SERVICIOS DE E-TRANSIT METRO ETHERNET DE LOS PAÍSES DEL CCG, POR TIPO DE SERVICIO, 2019-2032 (USD BILLONES)
    136. TABLA 133. ESTIMACIONES Y PRONÓSTICO DEL TAMAÑO DEL MERCADO DE SERVICIOS DE E-TRANSIT METRO ETHERNET DE LOS PAÍSES DEL CCG, POR TIPO DE DESPLIEGUE, 2019-2032 (USD BILLONES)
    137. TABLA 134. ESTIMACIONES Y PRONÓSTICO DEL TAMAÑO DEL MERCADO DE SERVICIOS DE E-TRANSIT METRO ETHERNET DE LOS PAÍSES DEL CCG, POR USUARIO FINAL, 2019-2032 (USD BILLONES)
    138. TABLA 135. ESTIMACIONES Y PRONÓSTICO DEL TAMAÑO DEL MERCADO DE SERVICIOS DE E-TRANSIT METRO ETHERNET DE LOS PAÍSES DEL CCG, POR APLICACIÓN, 2019-2032 (USD BILLONES)
    139. TABLA 136. ESTIMACIONES Y PRONÓSTICO DEL TAMAÑO DEL MERCADO DE SERVICIOS DE E-TRANSIT METRO ETHERNET DE LOS PAÍSES DEL CCG, POR REGIÓN, 2019-2032 (USD BILLONES)
    140. TABLA 137. ESTIMACIONES Y PRONÓSTICO DEL TAMAÑO DEL MERCADO DE SERVICIOS DE E-TRANSIT METRO ETHERNET DE SUDÁFRICA, POR TIPO DE SERVICIO, 2019-2032 (USD BILLONES)

Segmentación del Mercado de Servicios de Ethernet Metro E-Transit

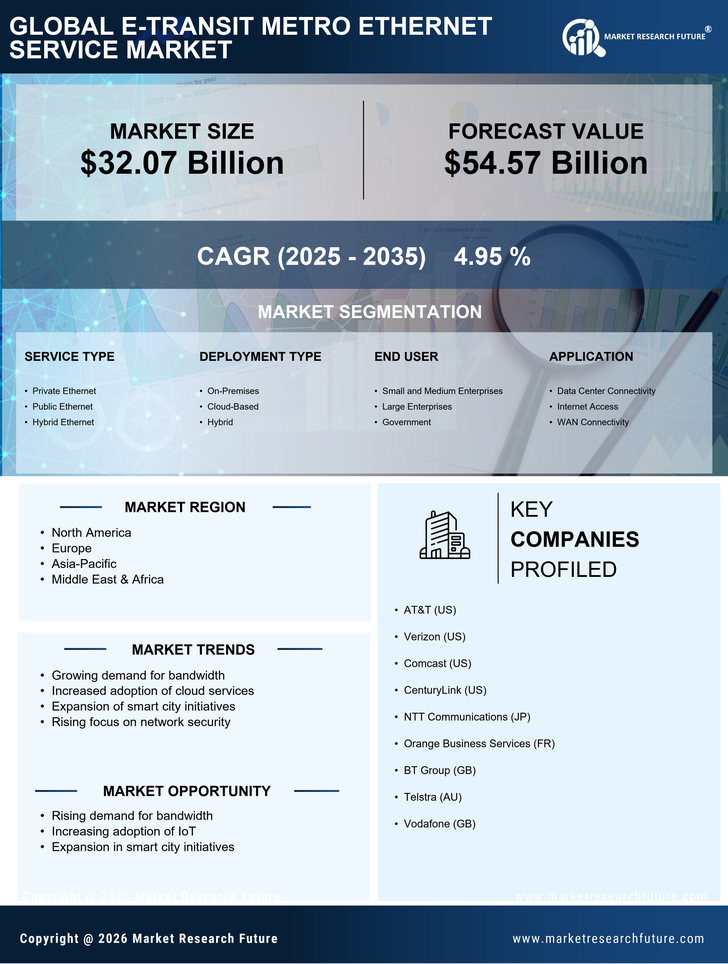
  • Mercado de Servicios de Ethernet Metro E-Transit por Tipo de Servicio (USD Mil millones, 2019-2032)

    • Ethernet Privado

    • Ethernet Público

    • Ethernet Híbrido

  • Mercado de Servicios de Ethernet Metro E-Transit por Tipo de Despliegue (USD Mil millones, 2019-2032)

    • En las Instalaciones

    • Basado en la Nube

    • Híbrido

  • Mercado de Servicios de Ethernet Metro E-Transit por Usuario Final (USD Mil millones, 2019-2032)

    • Pequeñas y Medianas Empresas

    • Grandes Empresas

    • Gobierno

  • Mercado de Servicios de Ethernet Metro E-Transit por Aplicación (USD Mil millones, 2019-2032)

    • Conectividad de Centros de Datos

    • Acceso a Internet

    • Conectividad WAN

  • Mercado de Servicios de Ethernet Metro E-Transit por Región (USD Mil millones, 2019-2032)

    • América del Norte

    • Europa

    • América del Sur

    • Asia-Pacífico

    • Medio Oriente y África

Perspectiva Regional del Mercado de Servicios de Ethernet Metro E-Transit (USD Mil millones, 2019-2032)

  • Perspectiva de América del Norte (USD Mil millones, 2019-2032)

    • Mercado de Servicios de Ethernet Metro E-Transit en América del Norte por Tipo de Servicio

      • Ethernet Privado

      • Ethernet Público

      • Ethernet Híbrido

    • Mercado de Servicios de Ethernet Metro E-Transit en América del Norte por Tipo de Despliegue

      • En las Instalaciones

      • Basado en la Nube

      • Híbrido

    • Mercado de Servicios de Ethernet Metro E-Transit en América del Norte por Tipo de Usuario Final

      • Pequeñas y Medianas Empresas

      • Grandes Empresas

      • Gobierno

    • Mercado de Servicios de Ethernet Metro E-Transit en América del Norte por Tipo de Aplicación

      • Conectividad de Centros de Datos

      • Acceso a Internet

      • Conectividad WAN

    • Mercado de Servicios de Ethernet Metro E-Transit en América del Norte por Tipo Regional

      • EE. UU.

      • Canadá

    • Perspectiva de EE. UU. (USD Mil millones, 2019-2032)

    • Mercado de Servicios de Ethernet Metro E-Transit en EE. UU. por Tipo de Servicio

      • Ethernet Privado

      • Ethernet Público

      • Ethernet Híbrido

    • Mercado de Servicios de Ethernet Metro E-Transit en EE. UU. por Tipo de Despliegue

      • En las Instalaciones

      • Basado en la Nube

      • Híbrido

    • Mercado de Servicios de Ethernet Metro E-Transit en EE. UU. por Tipo de Usuario Final

      • Pequeñas y Medianas Empresas

      • Grandes Empresas

      • Gobierno

    • Mercado de Servicios de Ethernet Metro E-Transit en EE. UU. por Tipo de Aplicación

      • Conectividad de Centros de Datos

      • Acceso a Internet

      • Conectividad WAN

    • Perspectiva de CANADÁ (USD Mil millones, 2019-2032)

    • Mercado de Servicios de Ethernet Metro E-Transit en CANADÁ por Tipo de Servicio

      • Ethernet Privado

      • Ethernet Público

      • Ethernet Híbrido

    • Mercado de Servicios de Ethernet Metro E-Transit en CANADÁ por Tipo de Despliegue

      • En las Instalaciones

      • Basado en la Nube

      • Híbrido

    • Mercado de Servicios de Ethernet Metro E-Transit en CANADÁ por Tipo de Usuario Final

      • Pequeñas y Medianas Empresas

      • Grandes Empresas

      • Gobierno

    • Mercado de Servicios de Ethernet Metro E-Transit en CANADÁ por Tipo de Aplicación

      • Conectividad de Centros de Datos

      • Acceso a Internet

      • Conectividad WAN

  • Perspectiva de Europa (USD Mil millones, 2019-2032)

    • Mercado de Servicios de Ethernet Metro E-Transit en Europa por Tipo de Servicio

      • Ethernet Privado

      • Ethernet Público

      • Ethernet Híbrido

    • Mercado de Servicios de Ethernet Metro E-Transit en Europa por Tipo de Despliegue

      • En las Instalaciones

      • Basado en la Nube

      • Híbrido

    • Mercado de Servicios de Ethernet Metro E-Transit en Europa por Tipo de Usuario Final

      • Pequeñas y Medianas Empresas

      • Grandes Empresas

      • Gobierno

    • Mercado de Servicios de Ethernet Metro E-Transit en Europa por Tipo de Aplicación

      • Conectividad de Centros de Datos

      • Acceso a Internet

      • Conectividad WAN

    • Mercado de Servicios de Ethernet Metro E-Transit en Europa por Tipo Regional

      • Alemania

      • Reino Unido

      • Francia

      • Rusia

      • Italia

      • España

      • Resto de Europa

    • Perspectiva de ALEMANIA (USD Mil millones, 2019-2032)

    • Mercado de Servicios de Ethernet Metro E-Transit en ALEMANIA por Tipo de Servicio

      • Ethernet Privado

      • Ethernet Público

      • Ethernet Híbrido

    • Mercado de Servicios de Ethernet Metro E-Transit en ALEMANIA por Tipo de Despliegue

      • En las Instalaciones

      • Basado en la Nube

      • Híbrido

    • Mercado de Servicios de Ethernet Metro E-Transit en ALEMANIA por Tipo de Usuario Final

      • Pequeñas y Medianas Empresas

      • Grandes Empresas

      • Gobierno

    • Mercado de Servicios de Ethernet Metro E-Transit en ALEMANIA por Tipo de Aplicación

      • Conectividad de Centros de Datos

      • Acceso a Internet

      • Conectividad WAN

    • Perspectiva del REINO UNIDO (USD Mil millones, 2019-2032)

    • Mercado de Servicios de Ethernet Metro E-Transit en el REINO UNIDO por Tipo de Servicio

      • Ethernet Privado

      • Ethernet Público

      • Ethernet Híbrido

    • Mercado de Servicios de Ethernet Metro E-Transit en el REINO UNIDO por Tipo de Despliegue

      • En las Instalaciones

      • Basado en la Nube

      • Híbrido

    • Mercado de Servicios de Ethernet Metro E-Transit en el REINO UNIDO por Tipo de Usuario Final

      • Pequeñas y Medianas Empresas

      • Grandes Empresas

      • Gobierno

    • Mercado de Servicios de Ethernet Metro E-Transit en el REINO UNIDO por Tipo de Aplicación

      • Conectividad de Centros de Datos

      • Acceso a Internet

      • Conectividad WAN

    • Perspectiva de FRANCIA (USD Mil millones, 2019-2032)

    • Mercado de Servicios de Ethernet Metro E-Transit en FRANCIA por Tipo de Servicio

      • Ethernet Privado

      • Ethernet Público

      • Ethernet Híbrido

    • Mercado de Servicios de Ethernet Metro E-Transit en FRANCIA por Tipo de Despliegue

      • En las Instalaciones

      • Basado en la Nube

      • Híbrido

    • Mercado de Servicios de Ethernet Metro E-Transit en FRANCIA por Tipo de Usuario Final

      • Pequeñas y Medianas Empresas

      • Grandes Empresas

      • Gobierno

    • Mercado de Servicios de Ethernet Metro E-Transit en FRANCIA por Tipo de Aplicación

      • Conectividad de Centros de Datos

      • Acceso a Internet

      • Conectividad WAN

    • Perspectiva de RUSIA (USD Mil millones, 2019-2032)

    • Mercado de Servicios de Ethernet Metro E-Transit en RUSIA por Tipo de Servicio

      • Ethernet Privado

      • Ethernet Público

      • Ethernet Híbrido

    • Mercado de Servicios de Ethernet Metro E-Transit en RUSIA por Tipo de Despliegue

      • En las Instalaciones

      • Basado en la Nube

      • Híbrido

    • Mercado de Servicios de Ethernet Metro E-Transit en RUSIA por Tipo de Usuario Final

      • Pequeñas y Medianas Empresas

      • Grandes Empresas

      • Gobierno

    • Mercado de Servicios de Ethernet Metro E-Transit en RUSIA por Tipo de Aplicación

      • Conectividad de Centros de Datos

      • Acceso a Internet

      • Conectividad WAN

    • Perspectiva de ITALIA (USD Mil millones, 2019-2032)

    • Mercado de Servicios de Ethernet Metro E-Transit en ITALIA por Tipo de Servicio

      • Ethernet Privado

      • Ethernet Público

      • Ethernet Híbrido

    • Mercado de Servicios de Ethernet Metro E-Transit en ITALIA por Tipo de Despliegue

      • En las Instalaciones

      • Basado en la Nube

      • Híbrido

    • Mercado de Servicios de Ethernet Metro E-Transit en ITALIA por Tipo de Usuario Final

      • Pequeñas y Medianas Empresas

      • Grandes Empresas

      • Gobierno

    • Mercado de Servicios de Ethernet Metro E-Transit en ITALIA por Tipo de Aplicación

      • Conectividad de Centros de Datos

      • Acceso a Internet

      • Conectividad WAN

    • Perspectiva de ESPAÑA (USD Mil millones, 2019-2032)

    • Mercado de Servicios de Ethernet Metro E-Transit en ESPAÑA por Tipo de Servicio

      • Ethernet Privado

      • Ethernet Público

      • Ethernet Híbrido

    • Mercado de Servicios de Ethernet Metro E-Transit en ESPAÑA por Tipo de Despliegue

      • En las Instalaciones

      • Basado en la Nube

      • Híbrido

    • Mercado de Servicios de Ethernet Metro E-Transit en ESPAÑA por Tipo de Usuario Final

      • Pequeñas y Medianas Empresas

      • Grandes Empresas

      • Gobierno

    • Mercado de Servicios de Ethernet Metro E-Transit en ESPAÑA por Tipo de Aplicación

      • Conectividad de Centros de Datos

      • Acceso a Internet

      • Conectividad WAN

    • Perspectiva del RESTO DE EUROPA (USD Mil millones, 2019-2032)

    • Mercado de Servicios de Ethernet Metro E-Transit en el RESTO DE EUROPA por Tipo de Servicio

      • Ethernet Privado

      • Ethernet Público

      • Ethernet Híbrido

    • Mercado de Servicios de Ethernet Metro E-Transit en el RESTO DE EUROPA por Tipo de Despliegue

      • En las Instalaciones

      • Basado en la Nube

      • Híbrido

    • Mercado de Servicios de Ethernet Metro E-Transit en el RESTO DE EUROPA por Tipo de Usuario Final

      • Pequeñas y Medianas Empresas

      • Grandes Empresas

      • Gobierno

    • Mercado de Servicios de Ethernet Metro E-Transit en el RESTO DE EUROPA por Tipo de Aplicación

      • Conectividad de Centros de Datos

      • Acceso a Internet

      • Conectividad WAN

  • Perspectiva de APAC (USD Mil millones, 2019-2032)

    • Mercado de Servicios de Ethernet Metro E-Transit en APAC por Tipo de Servicio

      • Ethernet Privado

      • Ethernet Público

      • Ethernet Híbrido

    • Mercado de Servicios de Ethernet Metro E-Transit en APAC por Tipo de Despliegue

      • En las Instalaciones

      • Basado en la Nube

      • Híbrido

    • Mercado de Servicios de Ethernet Metro E-Transit en APAC por Tipo de Usuario Final

      • Pequeñas y Medianas Empresas

      • Grandes Empresas

      • Gobierno

    • Mercado de Servicios de Ethernet Metro E-Transit en APAC por Tipo de Aplicación

      • Conectividad de Centros de Datos

      • Acceso a Internet

      • Conectividad WAN

    • Mercado de Servicios de Ethernet Metro E-Transit en APAC por Tipo Regional

      • China

      • India

      • Japón

      • Corea del Sur

      • Malasia

      • Tailandia

      • Indonesia

      • Resto de APAC

    • Perspectiva de CHINA (USD Mil millones, 2019-2032)

    • Mercado de Servicios de Ethernet Metro E-Transit en CHINA por Tipo de Servicio

      • Ethernet Privado

      • Ethernet Público

      • Ethernet Híbrido

    • Mercado de Servicios de Ethernet Metro E-Transit en CHINA por Tipo de Despliegue

      • En las Instalaciones

      • Basado en la Nube

      • Híbrido

    • Mercado de Servicios de Ethernet Metro E-Transit en CHINA por Tipo de Usuario Final

      • Pequeñas y Medianas Empresas

      • Grandes Empresas

      • Gobierno

    • Mercado de Servicios de Ethernet Metro E-Transit en CHINA por Tipo de Aplicación

      • Conectividad de Centros de Datos

      • Acceso a Internet

      • Conectividad WAN

    • Perspectiva de INDIA (USD Mil millones, 2019-2032)

    • Mercado de Servicios de Ethernet Metro E-Transit en INDIA por Tipo de Servicio

      • Ethernet Privado

      • Ethernet Público

      • Ethernet Híbrido

    • Mercado de Servicios de Ethernet Metro E-Transit en INDIA por Tipo de Despliegue

      • En las Instalaciones

      • Basado en la Nube

      • Híbrido

    • Mercado de Servicios de Ethernet Metro E-Transit en INDIA por Tipo de Usuario Final

      • Pequeñas y Medianas Empresas

      • Grandes Empresas

      • Gobierno

    • Mercado de Servicios de Ethernet Metro E-Transit en INDIA por Tipo de Aplicación

      • Conectividad de Centros de Datos

      • Acceso a Internet

      • Conectividad WAN

    • Perspectiva de JAPÓN (USD Mil millones, 2019-2032)

    • Mercado de Servicios de Ethernet Metro E-Transit en JAPÓN por Tipo de Servicio

      • Ethernet Privado

      • Ethernet Público

      • Ethernet Híbrido

    • Mercado de Servicios de Ethernet Metro E-Transit en JAPÓN por Tipo de Despliegue

      • En las Instalaciones

      • Basado en la Nube

      • Híbrido

    • Mercado de Servicios de Ethernet Metro E-Transit en JAPÓN por Tipo de Usuario Final

      • Pequeñas y Medianas Empresas

      • Grandes Empresas

      • Gobierno

    • Mercado de Servicios de Ethernet Metro E-Transit en JAPÓN por Tipo de Aplicación

      • Conectividad de Centros de Datos

      • Acceso a Internet

      • Conectividad WAN

    • Perspectiva de COREA DEL SUR (USD Mil millones, 2019-2032)

    • Mercado de Servicios de Ethernet Metro E-Transit en COREA DEL SUR por Tipo de Servicio

      • Ethernet Privado

      • Ethernet Público

      • Ethernet Híbrido

    • Mercado de Servicios de Ethernet Metro E-Transit en COREA DEL SUR por Tipo de Despliegue

      • En las Instalaciones

      • Basado en la Nube

      • Híbrido

    • Mercado de Servicios de Ethernet Metro E-Transit en COREA DEL SUR por Tipo de Usuario Final

      • Pequeñas y Medianas Empresas

      • Grandes Empresas

      • Gobierno

    • Mercado de Servicios de Ethernet Metro E-Transit en COREA DEL SUR por Tipo de Aplicación

      • Conectividad de Centros de Datos

      • Acceso a Internet

      • Conectividad WAN

    • Perspectiva de MALASIA (USD Mil millones, 2019-2032)

    • Mercado de Servicios de Ethernet Metro E-Transit en MALASIA por Tipo de Servicio

      • Ethernet Privado

      • Ethernet Público

      • Ethernet Híbrido

    • Mercado de Servicios de Ethernet Metro E-Transit en MALASIA por Tipo de Despliegue

      • En las Instalaciones

      • Basado en la Nube

      • Híbrido

    • Mercado de Servicios de Ethernet Metro E-Transit en MALASIA por Tipo de Usuario Final

      • Pequeñas y Medianas Empresas

      • Grandes Empresas

      • Gobierno

    • Mercado de Servicios de Ethernet Metro E-Transit en MALASIA por Tipo de Aplicación

      • Conectividad de Centros de Datos

      • Acceso a Internet

      • Conectividad WAN

    • Perspectiva de TAILANDIA (USD Mil millones, 2019-2032)

    • Mercado de Servicios de Ethernet Metro E-Transit en TAILANDIA por Tipo de Servicio

      • Ethernet Privado

      • Ethernet Público

      • Ethernet Híbrido

    • Mercado de Servicios de Ethernet Metro E-Transit en TAILANDIA por Tipo de Despliegue

      • En las Instalaciones

      • Basado en la Nube

      • Híbrido

    • Mercado de Servicios de Ethernet Metro E-Transit en TAILANDIA por Tipo de Usuario Final

      • Pequeñas y Medianas Empresas

      • Grandes Empresas

      • Gobierno

    • Mercado de Servicios de Ethernet Metro E-Transit en TAILANDIA por Tipo de Aplicación

      • Conectividad de Centros de Datos

      • Acceso a Internet

      • Conectividad WAN

    • Perspectiva de INDONESIA (USD Mil millones, 2019-2032)

    • Mercado de Servicios de Ethernet Metro E-Transit en INDONESIA por Tipo de Servicio

      • Ethernet Privado

      • Ethernet Público

      • Ethernet Híbrido

    • Mercado de Servicios de Ethernet Metro E-Transit en INDONESIA por Tipo de Despliegue

      • En las Instalaciones

      • Basado en la Nube

      • Híbrido

    • Mercado de Servicios de Ethernet Metro E-Transit en INDONESIA por Tipo de Usuario Final

      • Pequeñas y Medianas Empresas

      • Grandes Empresas

      • Gobierno

    • Mercado de Servicios de Ethernet Metro E-Transit en INDONESIA por Tipo de Aplicación

      • Conectividad de Centros de Datos

      • Acceso a Internet

      • Conectividad WAN

    • Perspectiva del RESTO DE APAC (USD Mil millones, 2019-2032)

    • Mercado de Servicios de Ethernet Metro E-Transit en el RESTO DE APAC por Tipo de Servicio

      • Ethernet Privado

      • Ethernet Público

      • Ethernet Híbrido

    • Mercado de Servicios de Ethernet Metro E-Transit en el RESTO DE APAC por Tipo de Despliegue

      • En las Instalaciones

      • Basado en la Nube

      • Híbrido

    • Mercado de Servicios de Ethernet Metro E-Transit en el RESTO DE APAC por Tipo de Usuario Final

      • Pequeñas y Medianas Empresas

      • Grandes Empresas

      • Gobierno

    • Mercado de Servicios de Ethernet Metro E-Transit en el RESTO DE APAC por Tipo de Aplicación

      • Conectividad de Centros de Datos

      • Acceso a Internet

      • Conectividad WAN

  • Perspectiva de América del Sur (USD Mil millones, 2019-2032)

    • Mercado de Servicios de Ethernet Metro E-Transit en América del Sur por Tipo de Servicio

      • Ethernet Privado

      • Ethernet Público

      • Ethernet Híbrido

    • Mercado de Servicios de Ethernet Metro E-Transit en América del Sur por Tipo de Despliegue

      • En las Instalaciones

      • Basado en la Nube

      • Híbrido

    • Mercado de Servicios de Ethernet Metro E-Transit en América del Sur por Tipo de Usuario Final

      • Pequeñas y Medianas Empresas

      • Grandes Empresas

      • Gobierno

    • Mercado de Servicios de Ethernet Metro E-Transit en América del Sur por Tipo de Aplicación

      • Conectividad de Centros de Datos

      • Acceso a Internet

      • Conectividad WAN

    • Mercado de Servicios de Ethernet Metro E-Transit en América del Sur por Tipo Regional

      • Brasil

      • México

      • Argentina

      • Resto de América del Sur

    • Perspectiva de BRASIL (USD Mil millones, 2019-2032)

    • Mercado de Servicios de Ethernet Metro E-Transit en BRASIL por Tipo de Servicio

      • Ethernet Privado

      • Ethernet Público

      • Ethernet Híbrido

    • Mercado de Servicios de Ethernet Metro E-Transit en BRASIL por Tipo de Despliegue

      • En las Instalaciones

      • Basado en la Nube

      • Híbrido

    • Mercado de Servicios de Ethernet Metro E-Transit en BRASIL por Tipo de Usuario Final

      • Pequeñas y Medianas Empresas

      • Grandes Empresas

      • Gobierno

    • Mercado de Servicios de Ethernet Metro E-Transit en BRASIL por Tipo de Aplicación

      • Conectividad de Centros de Datos

      • Acceso a Internet

      • Conectividad WAN

    • Perspectiva de MÉXICO (USD Mil millones, 2019-2032)

    • Mercado de Servicios de Ethernet Metro E-Transit en MÉXICO por Tipo de Servicio

      • Ethernet Privado

      • Ethernet Público

      • Ethernet Híbrido

    • Mercado de Servicios de Ethernet Metro E-Transit en MÉXICO por Tipo de Despliegue

      • En las Instalaciones

      • Basado en la Nube

      • Híbrido

    • Mercado de Servicios de Ethernet Metro E-Transit en MÉXICO por Tipo de Usuario Final

      • Pequeñas y Medianas Empresas

      • Grandes Empresas

      • Gobierno

    • Mercado de Servicios de Ethernet Metro E-Transit en MÉXICO por Tipo de Aplicación

      • Conectividad de Centros de Datos

      • Acceso a Internet

      • Conectividad WAN

    • Perspectiva de ARGENTINA (USD Mil millones, 2019-2032)

    • Mercado de Servicios de Ethernet Metro E-Transit en ARGENTINA por Tipo de Servicio

      • Ethernet Privado

      • Ethernet Público

      • Ethernet Híbrido

    • Mercado de Servicios de Ethernet Metro E-Transit en ARGENTINA por Tipo de Despliegue

      • En las Instalaciones

      • Basado en la Nube

      • Híbrido

    • Mercado de Servicios de Ethernet Metro E-Transit en ARGENTINA por Tipo de Usuario Final

      • Pequeñas y Medianas Empresas

      • Grandes Empresas

      • Gobierno

    • Mercado de Servicios de Ethernet Metro E-Transit en ARGENTINA por Tipo de Aplicación

      • Conectividad de Centros de Datos

      • Acceso a Internet

      • Conectividad WAN

    • Perspectiva del RESTO DE AMÉRICA DEL SUR (USD Mil millones, 2019-2032)

    • Mercado de Servicios de Ethernet Metro E-Transit en el RESTO DE AMÉRICA DEL SUR por Tipo de Servicio

      • Ethernet Privado

      • Ethernet Público

      • Ethernet Híbrido

    • Mercado de Servicios de Ethernet Metro E-Transit en el RESTO DE AMÉRICA DEL SUR por Tipo de Despliegue

      • En las Instalaciones

      • Basado en la Nube

      • Híbrido

    • Mercado de Servicios de Ethernet Metro E-Transit en el RESTO DE AMÉRICA DEL SUR por Tipo de Usuario Final

      • Pequeñas y Medianas Empresas

      • Grandes Empresas

      • Gobierno

    • Mercado de Servicios de Ethernet Metro E-Transit en el RESTO DE AMÉRICA DEL SUR por Tipo de Aplicación

      • Conectividad de Centros de Datos

      • Acceso a Internet

      • Conectividad WAN

  • Perspectiva de MEA (USD Mil millones, 2019-2032)

    • Mercado de Servicios de Ethernet Metro E-Transit en MEA por Tipo de Servicio

      • Ethernet Privado

      • Ethernet Público

      • Ethernet Híbrido

    • Mercado de Servicios de Ethernet Metro E-Transit en MEA por Tipo de Despliegue

      • En las Instalaciones

      • Basado en la Nube

      • Híbrido

    • Mercado de Servicios de Ethernet Metro E-Transit en MEA por Tipo de Usuario Final

      • Pequeñas y Medianas Empresas

      • Grandes Empresas

      • Gobierno

    • Mercado de Servicios de Ethernet Metro E-Transit en MEA por Tipo de Aplicación

      • Conectividad de Centros de Datos

      • Acceso a Internet

      • Conectividad WAN

    • Mercado de Servicios de Ethernet Metro E-Transit en MEA por Tipo Regional

      • Países del CCG

      • Sudáfrica

      • Resto de MEA

    • Perspectiva de PAÍSES DEL CCG (USD Mil millones, 2019-2032)

    • Mercado de Servicios de Ethernet Metro E-Transit en PAÍSES DEL CCG por Tipo de Servicio

      • Ethernet Privado

      • Ethernet Público

      • Ethernet Híbrido

    • Mercado de Servicios de Ethernet Metro E-Transit en PAÍSES DEL CCG por Tipo de Despliegue

      • En las Instalaciones

      • Basado en la Nube

      • Híbrido

    • Mercado de Servicios de Ethernet Metro E-Transit en PAÍSES DEL CCG por Tipo de Usuario Final

      • Pequeñas y Medianas Empresas

      • Grandes Empresas

      • Gobierno

    • Mercado de Servicios de Ethernet Metro E-Transit en PAÍSES DEL CCG por Tipo de Aplicación

      • Conectividad de Centros de Datos

      • Acceso a Internet

      • Conectividad WAN

    • Perspectiva de SUDÁFRICA (USD Mil millones, 2019-2032)

    • Mercado de Servicios de Ethernet Metro E-Transit en SUDÁFRICA por Tipo de Servicio

      • Ethernet Privado

      • Ethernet Público

      • Ethernet Híbrido

    • Mercado de Servicios de Ethernet Metro E-Transit en SUDÁFRICA por Tipo de Despliegue

      • En las Instalaciones

      • Basado en la Nube

      • Híbrido

    • Mercado de Servicios de Ethernet Metro E-Transit en SUDÁFRICA por Tipo de Usuario Final

      • Pequeñas y Medianas Empresas

      • Grandes Empresas

      • Gobierno

    • Mercado de Servicios de Ethernet Metro E-Transit en SUDÁFRICA por Tipo de Aplicación

      • Conectividad de Centros de Datos

      • Acceso a Internet

      • Conectividad WAN

    • Perspectiva del RESTO DE MEA (USD Mil millones, 2019-2032)

    • Mercado de Servicios de Ethernet Metro E-Transit en el RESTO DE MEA por Tipo de Servicio

      • Ethernet Privado

      • Ethernet Público

      • Ethernet Híbrido

    • Mercado de Servicios de Ethernet Metro E-Transit en el RESTO DE MEA por Tipo de Despliegue

      • En las Instalaciones

      • Basado en la Nube

      • Híbrido

    • Mercado de Servicios de Ethernet Metro E-Transit en el RESTO DE MEA por Tipo de Usuario Final

      • Pequeñas y Medianas Empresas

      • Grandes Empresas

      • Gobierno

    • Mercado de Servicios de Ethernet Metro E-Transit en el RESTO DE MEA por Tipo de Aplicación

      • Conectividad de Centros de Datos

      • Acceso a Internet

      • Conectividad WAN

Compare Licence

×
Features License Type
Single User Multiuser License Enterprise User
Price $4,950 $5,950 $7,250
Maximum User Access Limit 1 User Upto 10 Users Unrestricted Access Throughout the Organization
Free Customization
Direct Access to Analyst
Deliverable Format
Platform Access
Discount on Next Purchase 10% 15% 15%
Printable Versions