Request Free Sample ×

Kindly complete the form below to receive a free sample of this Report

* Please use a valid business email

Leading companies partner with us for data-driven Insights

clients tt-cursor
Hero Background

Intumeszentes Graphit-Markt

ID: MRFR/CnM/34633-HCR
111 Pages
Chitranshi Jaiswal
Last Updated: April 06, 2026

Marktforschungsbericht über intumeszierendes Graphit nach Anwendung (Brandschutzsysteme, Isoliermaterialien, Beschichtungen), nach Form (flexibles Graphit, starres Graphit, Graphitfolie), nach Endverbraucherindustrie (Bau, Automobil, Luft- und Raumfahrt), nach Typ (natürliches Graphit, synthetisches Graphit) und nach Region (Nordamerika, Europa, Südamerika, Asien-Pazifik, Naher Osten und Afrika) - Prognose bis 2035

Teilen
Download PDF ×

We do not share your information with anyone. However, we may send you emails based on your report interest from time to time. You may contact us at any time to opt-out.

Intumescent Graphite Market Infographic
Purchase Options
  1. 1 ABSCHNITT I: ZUSAMMENFASSUNG UND WICHTIGE HIGHLIGHTS
    1. 1.1 ZUSAMMENFASSUNG
      1. 1.1.1 MARKTÜBERSICHT
      2. 1.1.2 WICHTIGE ERGEBNISSE
      3. 1.1.3 MARKTSEGMENTIERUNG
      4. 1.1.4 WETTBEWERBSLANDSCHAFT
      5. 1.1.5 HERAUSFORDERUNGEN UND CHANCEN
      6. 1.1.6 ZUKUNFTSAUSSICHTEN
  2. 2 ABSCHNITT II: ABGRENZUNG, METHODOLOGIE UND MARKTSTRUKTUR
    1. 2.1 MARKTEINFÜHRUNG
      1. 2.1.1 DEFINITION
      2. 2.1.2 UMFANG DER STUDIE
        1. 2.1.2.1 FORSCHUNGSZIEL
        2. 2.1.2.2 ANNAHMEN
        3. 2.1.2.3 EINSCHRÄNKUNGEN
    2. 2.2 FORSCHUNGSMETHODOLOGIE
      1. 2.2.1 ÜBERBLICK
      2. 2.2.2 DATENABBAU
      3. 2.2.3 SEKUNDÄRFORSCHUNG
      4. 2.2.4 PRIMÄRFORSCHUNG
        1. 2.2.4.1 PROZESS DER PRIMÄRINTERVIEWS UND INFORMATIONSSAMMLUNG
        2. 2.2.4.2 AUFTEILUNG DER PRIMÄRANTWORTGEBER
      5. 2.2.5 PROGNOSEMODELL
      6. 2.2.6 MARKTGROßENBESCHÄTZUNG
        1. 2.2.6.1 UNTERE ANSATZ
        2. 2.2.6.2 OBERE ANSATZ
      7. 2.2.7 DATENTRIANGULATION
      8. 2.2.8 VALIDIERUNG
  3. 3 ABSCHNITT III: QUALITATIVE ANALYSE
    1. 3.1 MARKTDYNAMIK
      1. 3.1.1 ÜBERBLICK
      2. 3.1.2 TREIBER
      3. 3.1.3 EINSCHRÄNKUNGEN
      4. 3.1.4 CHANCEN
    2. 3.2 MARKTFACHTANALYSE
      1. 3.2.1 WERTSCHÖPFUNGSKETTENANALYSE
      2. 3.2.2 PORTER'S FIVE FORCES ANALYSE
        1. 3.2.2.1 VERHANDLUNGSMACHT DER LIEFERANTEN
        2. 3.2.2.2 VERHANDLUNGSMACHT DER KÄUFER
        3. 3.2.2.3 BEDROHUNG DURCH NEUEINSTEIGER
        4. 3.2.2.4 BEDROHUNG DURCH SUBSTITUTE
        5. 3.2.2.5 INTENSITÄT DES WETTBEWERBS
      3. 3.2.3 COVID-19 IMPAKTANALYSE
        1. 3.2.3.1 MARKTAUSWIRKUNGSANALYSE
        2. 3.2.3.2 REGIONALE AUSWIRKUNGEN
        3. 3.2.3.3 CHANCEN- UND BEDROHUNGSANALYSE
  4. 4 ABSCHNITT IV: QUANTITATIVE ANALYSE
    1. 4.1 CHEMIKALIEN UND MATERIALIEN, NACH ANWENDUNG (MILLIARDEN USD)
      1. 4.1.1 BRANDSCHUTZSYSTEME
      2. 4.1.2 DÄMMMATERIALIEN
      3. 4.1.3 BESCHICHTUNGEN
    2. 4.2 CHEMIKALIEN UND MATERIALIEN, NACH FORM (MILLIARDEN USD)
      1. 4.2.1 FLEXIBLES GRAPHIT
      2. 4.2.2 STARRES GRAPHIT
      3. 4.2.3 GRAPHITFOLIE
    3. 4.3 CHEMIKALIEN UND MATERIALIEN, NACH ENDVERWENDUNGSINDUSTRIE (MILLIARDEN USD)
      1. 4.3.1 BAU
      2. 4.3.2 AUTOMOBIL
      3. 4.3.3 LUFT- UND RAUMFAHRT
    4. 4.4 CHEMIKALIEN UND MATERIALIEN, NACH TYP (MILLIARDEN USD)
      1. 4.4.1 NATÜRLICHES GRAPHIT
      2. 4.4.2 SINTETISCHES GRAPHIT
    5. 4.5 CHEMIKALIEN UND MATERIALIEN, NACH REGION (MILLIARDEN USD)
      1. 4.5.1 NORDAMERIKA
        1. 4.5.1.1 USA
        2. 4.5.1.2 KANADA
      2. 4.5.2 EUROPA
        1. 4.5.2.1 DEUTSCHLAND
        2. 4.5.2.2 VEREINIGTES KÖNIGREICH
        3. 4.5.2.3 FRANKREICH
        4. 4.5.2.4 RUSSLAND
        5. 4.5.2.5 ITALIEN
        6. 4.5.2.6 SPANIEN
        7. 4.5.2.7 RESTEUROPA
      3. 4.5.3 APAC
        1. 4.5.3.1 CHINA
        2. 4.5.3.2 INDIEN
        3. 4.5.3.3 JAPAN
        4. 4.5.3.4 SÜDKOREA
        5. 4.5.3.5 MALAYSIA
        6. 4.5.3.6 THAILAND
        7. 4.5.3.7 INDONESIEN
        8. 4.5.3.8 REST APAC
      4. 4.5.4 SÜDAMERIKA
        1. 4.5.4.1 BRASILIEN
        2. 4.5.4.2 MEXIKO
        3. 4.5.4.3 ARGENTINIEN
        4. 4.5.4.4 REST SÜDAMERIKA
      5. 4.5.5 MEA
        1. 4.5.5.1 GCC-LÄNDER
        2. 4.5.5.2 SÜDAFRIKA
        3. 4.5.5.3 REST MEA
  5. 5 ABSCHNITT V: WETTBEWERBSANALYSE
    1. 5.1 WETTBEWERBSLANDSCHAFT
      1. 5.1.1 ÜBERBLICK
      2. 5.1.2 WETTBEWERBSANALYSE
      3. 5.1.3 MARKTANTEILSANALYSE
      4. 5.1.4 WICHTIGSTE WACHSTUMSTRATEGIE IM BEREICH CHEMIKALIEN UND MATERIALIEN
      5. 5.1.5 WETTBEWERBSBENCHMARKING
      6. 5.1.6 FÜHRENDE UNTERNEHMEN IN BEZUG AUF ANZAHL DER ENTWICKLUNGEN IM BEREICH CHEMIKALIEN UND MATERIALIEN
      7. 5.1.7 WICHTIGE ENTWICKLUNGEN UND WACHSTUMSTRATEGIEN
        1. 5.1.7.1 NEUE PRODUKTEINFÜHRUNG/SERVICEBEREITSTELLUNG
        2. 5.1.7.2 FUSIONEN & AKQUISITIONEN
        3. 5.1.7.3 GEMEINSAME UNTERNEHMEN
      8. 5.1.8 WICHTIGE FINANZMATRIK DER SPIELER
        1. 5.1.8.1 UMSATZ UND BETRIEBSGEWINN
        2. 5.1.8.2 WICHTIGE F&E-AUSGABEN. 2023
    2. 5.2 UNTERNEHMENSPROFILE
      1. 5.2.1 GrafTech International (USA)
        1. 5.2.1.1 FINANZÜBERBLICK
        2. 5.2.1.2 ANGEBOTENE PRODUKTE
        3. 5.2.1.3 WICHTIGE ENTWICKLUNGEN
        4. 5.2.1.4 SWOT-ANALYSE
        5. 5.2.1.5 WICHTIGE STRATEGIEN
      2. 5.2.2 SGL Carbon (DE)
        1. 5.2.2.1 FINANZÜBERBLICK
        2. 5.2.2.2 ANGEBOTENE PRODUKTE
        3. 5.2.2.3 WICHTIGE ENTWICKLUNGEN
        4. 5.2.2.4 SWOT-ANALYSE
        5. 5.2.2.5 WICHTIGE STRATEGIEN
      3. 5.2.3 Toyo Tanso Co., Ltd. (JP)
        1. 5.2.3.1 FINANZÜBERBLICK
        2. 5.2.3.2 ANGEBOTENE PRODUKTE
        3. 5.2.3.3 WICHTIGE ENTWICKLUNGEN
        4. 5.2.3.4 SWOT-ANALYSE
        5. 5.2.3.5 WICHTIGE STRATEGIEN
      4. 5.2.4 Morgan Advanced Materials (GB)
        1. 5.2.4.1 FINANZÜBERBLICK
        2. 5.2.4.2 ANGEBOTENE PRODUKTE
        3. 5.2.4.3 WICHTIGE ENTWICKLUNGEN
        4. 5.2.4.4 SWOT-ANALYSE
        5. 5.2.4.5 WICHTIGE STRATEGIEN
      5. 5.2.5 Schunk Carbon Technology (DE)
        1. 5.2.5.1 FINANZÜBERBLICK
        2. 5.2.5.2 ANGEBOTENE PRODUKTE
        3. 5.2.5.3 WICHTIGE ENTWICKLUNGEN
        4. 5.2.5.4 SWOT-ANALYSE
        5. 5.2.5.5 WICHTIGE STRATEGIEN
      6. 5.2.6 Mersen (FR)
        1. 5.2.6.1 FINANZÜBERBLICK
        2. 5.2.6.2 ANGEBOTENE PRODUKTE
        3. 5.2.6.3 WICHTIGE ENTWICKLUNGEN
        4. 5.2.6.4 SWOT-ANALYSE
        5. 5.2.6.5 WICHTIGE STRATEGIEN
      7. 5.2.7 Nippon Carbon Co., Ltd. (JP)
        1. 5.2.7.1 FINANZÜBERBLICK
        2. 5.2.7.2 ANGEBOTENE PRODUKTE
        3. 5.2.7.3 WICHTIGE ENTWICKLUNGEN
        4. 5.2.7.4 SWOT-ANALYSE
        5. 5.2.7.5 WICHTIGE STRATEGIEN
      8. 5.2.8 Carbodeon Ltd (FI)
        1. 5.2.8.1 FINANZÜBERBLICK
        2. 5.2.8.2 ANGEBOTENE PRODUKTE
        3. 5.2.8.3 WICHTIGE ENTWICKLUNGEN
        4. 5.2.8.4 SWOT-ANALYSE
        5. 5.2.8.5 WICHTIGE STRATEGIEN
    3. 5.3 ANHANG
      1. 5.3.1 QUELLEN
      2. 5.3.2 VERWANDTE BERICHTE
  6. 6 LISTE DER ABBILDUNGEN
    1. 6.1 MARKTSYNOPSIS
    2. 6.2 ANALYSE DES MARKTES NORDAMERIKA
    3. 6.3 ANALYSE DES MARKTES USA NACH ANWENDUNG
    4. 6.4 ANALYSE DES MARKTES USA NACH FORM
    5. 6.5 ANALYSE DES MARKTES USA NACH ENDVERWENDUNGSINDUSTRIE
    6. 6.6 ANALYSE DES MARKTES USA NACH TYP
    7. 6.7 ANALYSE DES MARKTES KANADA NACH ANWENDUNG
    8. 6.8 ANALYSE DES MARKTES KANADA NACH FORM
    9. 6.9 ANALYSE DES MARKTES KANADA NACH ENDVERWENDUNGSINDUSTRIE
    10. 6.10 ANALYSE DES MARKTES KANADA NACH TYP
    11. 6.11 ANALYSE DES MARKTES EUROPA
    12. 6.12 ANALYSE DES MARKTES DEUTSCHLAND NACH ANWENDUNG
    13. 6.13 ANALYSE DES MARKTES DEUTSCHLAND NACH FORM
    14. 6.14 ANALYSE DES MARKTES DEUTSCHLAND NACH ENDVERWENDUNGSINDUSTRIE
    15. 6.15 ANALYSE DES MARKTES DEUTSCHLAND NACH TYP
    16. 6.16 ANALYSE DES MARKTES VEREINIGTES KÖNIGREICH NACH ANWENDUNG
    17. 6.17 ANALYSE DES MARKTES VEREINIGTES KÖNIGREICH NACH FORM
    18. 6.18 ANALYSE DES MARKTES VEREINIGTES KÖNIGREICH NACH ENDVERWENDUNGSINDUSTRIE
    19. 6.19 ANALYSE DES MARKTES VEREINIGTES KÖNIGREICH NACH TYP
    20. 6.20 ANALYSE DES MARKTES FRANKREICH NACH ANWENDUNG
    21. 6.21 ANALYSE DES MARKTES FRANKREICH NACH FORM
    22. 6.22 ANALYSE DES MARKTES FRANKREICH NACH ENDVERWENDUNGSINDUSTRIE
    23. 6.23 ANALYSE DES MARKTES FRANKREICH NACH TYP
    24. 6.24 ANALYSE DES MARKTES RUSSLAND NACH ANWENDUNG
    25. 6.25 ANALYSE DES MARKTES RUSSLAND NACH FORM
    26. 6.26 ANALYSE DES MARKTES RUSSLAND NACH ENDVERWENDUNGSINDUSTRIE
    27. 6.27 ANALYSE DES MARKTES RUSSLAND NACH TYP
    28. 6.28 ANALYSE DES MARKTES ITALIEN NACH ANWENDUNG
    29. 6.29 ANALYSE DES MARKTES ITALIEN NACH FORM
    30. 6.30 ANALYSE DES MARKTES ITALIEN NACH ENDVERWENDUNGSINDUSTRIE
    31. 6.31 ANALYSE DES MARKTES ITALIEN NACH TYP
    32. 6.32 ANALYSE DES MARKTES SPANIEN NACH ANWENDUNG
    33. 6.33 ANALYSE DES MARKTES SPANIEN NACH FORM
    34. 6.34 ANALYSE DES MARKTES SPANIEN NACH ENDVERWENDUNGSINDUSTRIE
    35. 6.35 ANALYSE DES MARKTES SPANIEN NACH TYP
    36. 6.36 ANALYSE DES MARKTES RESTEUROPA NACH ANWENDUNG
    37. 6.37 ANALYSE DES MARKTES RESTEUROPA NACH FORM
    38. 6.38 ANALYSE DES MARKTES RESTEUROPA NACH ENDVERWENDUNGSINDUSTRIE
    39. 6.39 ANALYSE DES MARKTES RESTEUROPA NACH TYP
    40. 6.40 ANALYSE DES MARKTES APAC
    41. 6.41 ANALYSE DES MARKTES CHINA NACH ANWENDUNG
    42. 6.42 ANALYSE DES MARKTES CHINA NACH FORM
    43. 6.43 ANALYSE DES MARKTES CHINA NACH ENDVERWENDUNGSINDUSTRIE
    44. 6.44 ANALYSE DES MARKTES CHINA NACH TYP
    45. 6.45 ANALYSE DES MARKTES INDIEN NACH ANWENDUNG
    46. 6.46 ANALYSE DES MARKTES INDIEN NACH FORM
    47. 6.47 ANALYSE DES MARKTES INDIEN NACH ENDVERWENDUNGSINDUSTRIE
    48. 6.48 ANALYSE DES MARKTES INDIEN NACH TYP
    49. 6.49 ANALYSE DES MARKTES JAPAN NACH ANWENDUNG
    50. 6.50 ANALYSE DES MARKTES JAPAN NACH FORM
    51. 6.51 ANALYSE DES MARKTES JAPAN NACH ENDVERWENDUNGSINDUSTRIE
    52. 6.52 ANALYSE DES MARKTES JAPAN NACH TYP
    53. 6.53 ANALYSE DES MARKTES SÜDKOREA NACH ANWENDUNG
    54. 6.54 ANALYSE DES MARKTES SÜDKOREA NACH FORM
    55. 6.55 ANALYSE DES MARKTES SÜDKOREA NACH ENDVERWENDUNGSINDUSTRIE
    56. 6.56 ANALYSE DES MARKTES SÜDKOREA NACH TYP
    57. 6.57 ANALYSE DES MARKTES MALAYSIA NACH ANWENDUNG
    58. 6.58 ANALYSE DES MARKTES MALAYSIA NACH FORM
    59. 6.59 ANALYSE DES MARKTES MALAYSIA NACH ENDVERWENDUNGSINDUSTRIE
    60. 6.60 ANALYSE DES MARKTES MALAYSIA NACH TYP
    61. 6.61 ANALYSE DES MARKTES THAILAND NACH ANWENDUNG
    62. 6.62 ANALYSE DES MARKTES THAILAND NACH FORM
    63. 6.63 ANALYSE DES MARKTES THAILAND NACH ENDVERWENDUNGSINDUSTRIE
    64. 6.64 ANALYSE DES MARKTES THAILAND NACH TYP
    65. 6.65 ANALYSE DES MARKTES INDONESIEN NACH ANWENDUNG
    66. 6.66 ANALYSE DES MARKTES INDONESIEN NACH FORM
    67. 6.67 ANALYSE DES MARKTES INDONESIEN NACH ENDVERWENDUNGSINDUSTRIE
    68. 6.68 ANALYSE DES MARKTES INDONESIEN NACH TYP
    69. 6.69 ANALYSE DES MARKTES REST APAC NACH ANWENDUNG
    70. 6.70 ANALYSE DES MARKTES REST APAC NACH FORM
    71. 6.71 ANALYSE DES MARKTES REST APAC NACH ENDVERWENDUNGSINDUSTRIE
    72. 6.72 ANALYSE DES MARKTES REST APAC NACH TYP
    73. 6.73 ANALYSE DES MARKTES SÜDAMERIKA
    74. 6.74 ANALYSE DES MARKTES BRASILIEN NACH ANWENDUNG
    75. 6.75 ANALYSE DES MARKTES BRASILIEN NACH FORM
    76. 6.76 ANALYSE DES MARKTES BRASILIEN NACH ENDVERWENDUNGSINDUSTRIE
    77. 6.77 ANALYSE DES MARKTES BRASILIEN NACH TYP
    78. 6.78 ANALYSE DES MARKTES MEXIKO NACH ANWENDUNG
    79. 6.79 ANALYSE DES MARKTES MEXIKO NACH FORM
    80. 6.80 ANALYSE DES MARKTES MEXIKO NACH ENDVERWENDUNGSINDUSTRIE
    81. 6.81 ANALYSE DES MARKTES MEXIKO NACH TYP
    82. 6.82 ANALYSE DES MARKTES ARGENTINIEN NACH ANWENDUNG
    83. 6.83 ANALYSE DES MARKTES ARGENTINIEN NACH FORM
    84. 6.84 ANALYSE DES MARKTES ARGENTINIEN NACH ENDVERWENDUNGSINDUSTRIE
    85. 6.85 ANALYSE DES MARKTES ARGENTINIEN NACH TYP
    86. 6.86 ANALYSE DES MARKTES REST SÜDAMERIKA NACH ANWENDUNG
    87. 6.87 ANALYSE DES MARKTES REST SÜDAMERIKA NACH FORM
    88. 6.88 ANALYSE DES MARKTES REST SÜDAMERIKA NACH ENDVERWENDUNGSINDUSTRIE
    89. 6.89 ANALYSE DES MARKTES REST SÜDAMERIKA NACH TYP
    90. 6.90 ANALYSE DES MARKTES MEA
    91. 6.91 ANALYSE DES MARKTES GCC-LÄNDER NACH ANWENDUNG
    92. 6.92 ANALYSE DES MARKTES GCC-LÄNDER NACH FORM
    93. 6.93 ANALYSE DES MARKTES GCC-LÄNDER NACH ENDVERWENDUNGSINDUSTRIE
    94. 6.94 ANALYSE DES MARKTES GCC-LÄNDER NACH TYP
    95. 6.95 ANALYSE DES MARKTES SÜDAFRIKA NACH ANWENDUNG
    96. 6.96 ANALYSE DES MARKTES SÜDAFRIKA NACH FORM
    97. 6.97 ANALYSE DES MARKTES SÜDAFRIKA NACH ENDVERWENDUNGSINDUSTRIE
    98. 6.98 ANALYSE DES MARKTES SÜDAFRIKA NACH TYP
    99. 6.99 ANALYSE DES MARKTES REST MEA NACH ANWENDUNG
    100. 6.100 ANALYSE DES MARKTES REST MEA NACH FORM
    101. 6.101 ANALYSE DES MARKTES REST MEA NACH ENDVERWENDUNGSINDUSTRIE
    102. 6.102 ANALYSE DES MARKTES REST MEA NACH TYP
    103. 6.103 WICHTIGE KAUFKRITERIEN FÜR CHEMIKALIEN UND MATERIALIEN
    104. 6.104 FORSCHUNGSPROZESS VON MRFR
    105. 6.105 DRO-ANALYSE FÜR CHEMIKALIEN UND MATERIALIEN
    106. 6.106 TREIBERWIRKUNGSANALYSE: CHEMIKALIEN UND MATERIALIEN
    107. 6.107 EINSCHRÄNKUNGENWIRKUNGSANALYSE: CHEMIKALIEN UND MATERIALIEN
    108. 6.108 LIEFER-/WERTSCHÖPFUNGSKETTE: CHEMIKALIEN UND MATERIALIEN
    109. 6.109 CHEMIKALIEN UND MATERIALIEN, NACH ANWENDUNG, 2024 (% ANTEIL)
    110. 6.110 CHEMIKALIEN UND MATERIALIEN, NACH ANWENDUNG, 2024 BIS 2035 (MILLIARDEN USD)
    111. 6.111 CHEMIKALIEN UND MATERIALIEN, NACH FORM, 2024 (% ANTEIL)
    112. 6.112 CHEMIKALIEN UND MATERIALIEN, NACH FORM, 2024 BIS 2035 (MILLIARDEN USD)
    113. 6.113 CHEMIKALIEN UND MATERIALIEN, NACH ENDVERWENDUNGSINDUSTRIE, 2024 (% ANTEIL)
    114. 6.114 CHEMIKALIEN UND MATERIALIEN, NACH ENDVERWENDUNGSINDUSTRIE, 2024 BIS 2035 (MILLIARDEN USD)
    115. 6.115 CHEMIKALIEN UND MATERIALIEN, NACH TYP, 2024 (% ANTEIL)
    116. 6.116 CHEMIKALIEN UND MATERIALIEN, NACH TYP, 2024 BIS 2035 (MILLIARDEN USD)
    117. 6.117 BENCHMARKING DER WICHTIGSTEN WETTBEWERBER
  7. 7 LISTE DER TABELLEN
    1. 7.1 LISTE DER ANNAHMEN
    2. 7.2 MARKTGROßENBESCHÄTZUNGEN NORDAMERIKA; PROGNOSE
      1. 7.2.1 NACH ANWENDUNG, 2025-2035 (MILLIARDEN USD)
      2. 7.2.2 NACH FORM, 2025-2035 (MILLIARDEN USD)
      3. 7.2.3 NACH ENDVERWENDUNGSINDUSTRIE, 2025-2035 (MILLIARDEN USD)
      4. 7.2.4 NACH TYP, 2025-2035 (MILLIARDEN USD)
    3. 7.3 MARKTGROßENBESCHÄTZUNGEN USA; PROGNOSE
      1. 7.3.1 NACH ANWENDUNG, 2025-2035 (MILLIARDEN USD)
      2. 7.3.2 NACH FORM, 2025-2035 (MILLIARDEN USD)
      3. 7.3.3 NACH ENDVERWENDUNGSINDUSTRIE, 2025-2035 (MILLIARDEN USD)
      4. 7.3.4 NACH TYP, 2025-2035 (MILLIARDEN USD)
    4. 7.4 MARKTGROßENBESCHÄTZUNGEN KANADA; PROGNOSE
      1. 7.4.1 NACH ANWENDUNG, 2025-2035 (MILLIARDEN USD)
      2. 7.4.2 NACH FORM, 2025-2035 (MILLIARDEN USD)
      3. 7.4.3 NACH ENDVERWENDUNGSINDUSTRIE, 2025-2035 (MILLIARDEN USD)
      4. 7.4.4 NACH TYP, 2025-2035 (MILLIARDEN USD)
    5. 7.5 MARKTGROßENBESCHÄTZUNGEN EUROPA; PROGNOSE
      1. 7.5.1 NACH ANWENDUNG, 2025-2035 (MILLIARDEN USD)
      2. 7.5.2 NACH FORM, 2025-2035 (MILLIARDEN USD)
      3. 7.5.3 NACH ENDVERWENDUNGSINDUSTRIE, 2025-2035 (MILLIARDEN USD)
      4. 7.5.4 NACH TYP, 2025-2035 (MILLIARDEN USD)
    6. 7.6 MARKTGROßENBESCHÄTZUNGEN DEUTSCHLAND; PROGNOSE
      1. 7.6.1 NACH ANWENDUNG, 2025-2035 (MILLIARDEN USD)
      2. 7.6.2 NACH FORM, 2025-2035 (MILLIARDEN USD)
      3. 7.6.3 NACH ENDVERWENDUNGSINDUSTRIE, 2025-2035 (MILLIARDEN USD)
      4. 7.6.4 NACH TYP, 2025-2035 (MILLIARDEN USD)
    7. 7.7 MARKTGROßENBESCHÄTZUNGEN VEREINIGTES KÖNIGREICH; PROGNOSE
      1. 7.7.1 NACH ANWENDUNG, 2025-2035 (MILLIARDEN USD)
      2. 7.7.2 NACH FORM, 2025-2035 (MILLIARDEN USD)
      3. 7.7.3 NACH ENDVERWENDUNGSINDUSTRIE, 2025-2035 (MILLIARDEN USD)
      4. 7.7.4 NACH TYP, 2025-2035 (MILLIARDEN USD)
    8. 7.8 MARKTGROßENBESCHÄTZUNGEN FRANKREICH; PROGNOSE
      1. 7.8.1 NACH ANWENDUNG, 2025-2035 (MILLIARDEN USD)
      2. 7.8.2 NACH FORM, 2025-2035 (MILLIARDEN USD)
      3. 7.8.3 NACH ENDVERWENDUNGSINDUSTRIE, 2025-2035 (MILLIARDEN USD)
      4. 7.8.4 NACH TYP, 2025-2035 (MILLIARDEN USD)
    9. 7.9 MARKTGROßENBESCHÄTZUNGEN RUSSLAND; PROGNOSE
      1. 7.9.1 NACH ANWENDUNG, 2025-2035 (MILLIARDEN USD)
      2. 7.9.2 NACH FORM, 2025-2035 (MILLIARDEN USD)
      3. 7.9.3 NACH ENDVERWENDUNGSINDUSTRIE, 2025-2035 (MILLIARDEN USD)
      4. 7.9.4 NACH TYP, 2025-2035 (MILLIARDEN USD)
    10. 7.10 MARKTGROßENBESCHÄTZUNGEN ITALIEN; PROGNOSE
      1. 7.10.1 NACH ANWENDUNG, 2025-2035 (MILLIARDEN USD)
      2. 7.10.2 NACH FORM, 2025-2035 (MILLIARDEN USD)
      3. 7.10.3 NACH ENDVERWENDUNGSINDUSTRIE, 2025-2035 (MILLIARDEN USD)
      4. 7.10.4 NACH TYP, 2025-2035 (MILLIARDEN USD)
    11. 7.11 MARKTGROßENBESCHÄTZUNGEN SPANIEN; PROGNOSE
      1. 7.11.1 NACH ANWENDUNG, 2025-2035 (MILLIARDEN USD)
      2. 7.11.2 NACH FORM, 2025-2035 (MILLIARDEN USD)
      3. 7.11.3 NACH ENDVERWENDUNGSINDUSTRIE, 2025-2035 (MILLIARDEN USD)
      4. 7.11.4 NACH TYP, 2025-2035 (MILLIARDEN USD)
    12. 7.12 MARKTGROßENBESCHÄTZUNGEN RESTEUROPA; PROGNOSE
      1. 7.12.1 NACH ANWENDUNG, 2025-2035 (MILLIARDEN USD)
      2. 7.12.2 NACH FORM, 2025-2035 (MILLIARDEN USD)
      3. 7.12.3 NACH ENDVERWENDUNGSINDUSTRIE, 2025-2035 (MILLIARDEN USD)
      4. 7.12.4 NACH TYP, 2025-2035 (MILLIARDEN USD)
    13. 7.13 MARKTGROßENBESCHÄTZUNGEN APAC; PROGNOSE
      1. 7.13.1 NACH ANWENDUNG, 2025-2035 (MILLIARDEN USD)
      2. 7.13.2 NACH FORM, 2025-2035 (MILLIARDEN USD)
      3. 7.13.3 NACH ENDVERWENDUNGSINDUSTRIE, 2025-2035 (MILLIARDEN USD)
      4. 7.13.4 NACH TYP, 2025-2035 (MILLIARDEN USD)
    14. 7.14 MARKTGROßENBESCHÄTZUNGEN CHINA; PROGNOSE
      1. 7.14.1 NACH ANWENDUNG, 2025-2035 (MILLIARDEN USD)
      2. 7.14.2 NACH FORM, 2025-2035 (MILLIARDEN USD)
      3. 7.14.3 NACH ENDVERWENDUNGSINDUSTRIE, 2025-2035 (MILLIARDEN USD)
      4. 7.14.4 NACH TYP, 2025-2035 (MILLIARDEN USD)
    15. 7.15 MARKTGROßENBESCHÄTZUNGEN INDIEN; PROGNOSE
      1. 7.15.1 NACH ANWENDUNG, 2025-2035 (MILLIARDEN USD)
      2. 7.15.2 NACH FORM, 2025-2035 (MILLIARDEN USD)
      3. 7.15.3 NACH ENDVERWENDUNGSINDUSTRIE, 2025-2035 (MILLIARDEN USD)
      4. 7.15.4 NACH TYP, 2025-2035 (MILLIARDEN USD)
    16. 7.16 MARKTGROßENBESCHÄTZUNGEN JAPAN; PROGNOSE
      1. 7.16.1 NACH ANWENDUNG, 2025-2035 (MILLIARDEN USD)
      2. 7.16.2 NACH FORM, 2025-2035 (MILLIARDEN USD)
      3. 7.16.3 NACH ENDVERWENDUNGSINDUSTRIE, 2025-2035 (MILLIARDEN USD)
      4. 7.16.4 NACH TYP, 2025-2035 (MILLIARDEN USD)
    17. 7.17 MARKTGROßENBESCHÄTZUNGEN SÜDKOREA; PROGNOSE
      1. 7.17.1 NACH ANWENDUNG, 2025-2035 (MILLIARDEN USD)
      2. 7.17.2 NACH FORM, 2025-2035 (MILLIARDEN USD)
      3. 7.17.3 NACH ENDVERWENDUNGSINDUSTRIE, 2025-2035 (MILLIARDEN USD)
      4. 7.17.4 NACH TYP, 2025-2035 (MILLIARDEN USD)
    18. 7.18 MARKTGROßENBESCHÄTZUNGEN MALAYSIA; PROGNOSE
      1. 7.18.1 NACH ANWENDUNG, 2025-2035 (MILLIARDEN USD)
      2. 7.18.2 NACH FORM, 2025-2035 (MILLIARDEN USD)
      3. 7.18.3 NACH ENDVERWENDUNGSINDUSTRIE, 2025-2035 (MILLIARDEN USD)
      4. 7.18.4 NACH TYP, 2025-2035 (MILLIARDEN USD)
    19. 7.19 MARKTGROßENBESCHÄTZUNGEN THAILAND; PROGNOSE
      1. 7.19.1 NACH ANWENDUNG, 2025-2035 (MILLIARDEN USD)
      2. 7.19.2 NACH FORM, 2025-2035 (MILLIARDEN USD)
      3. 7.19.3 NACH ENDVERWENDUNGSINDUSTRIE, 2025-2035 (MILLIARDEN USD)
      4. 7.19.4 NACH TYP, 2025-2035 (MILLIARDEN USD)
    20. 7.20 MARKTGROßENBESCHÄTZUNGEN INDONESIEN; PROGNOSE
      1. 7.20.1 NACH ANWENDUNG, 2025-2035 (MILLIARDEN USD)
      2. 7.20.2 NACH FORM, 2025-2035 (MILLIARDEN USD)
      3. 7.20.3 NACH ENDVERWENDUNGSINDUSTRIE, 2025-2035 (MILLIARDEN USD)
      4. 7.20.4 NACH TYP, 2025-2035 (MILLIARDEN USD)
    21. 7.21 MARKTGROßENBESCHÄTZUNGEN REST APAC; PROGNOSE
      1. 7.21.1 NACH ANWENDUNG, 2025-2035 (MILLIARDEN USD)
      2. 7.21.2 NACH FORM, 2025-2035 (MILLIARDEN USD)
      3. 7.21.3 NACH ENDVERWENDUNGSINDUSTRIE, 2025-2035 (MILLIARDEN USD)
      4. 7.21.4 NACH TYP, 2025-2035 (MILLIARDEN USD)
    22. 7.22 MARKTGROßENBESCHÄTZUNGEN SÜDAMERIKA; PROGNOSE
      1. 7.22.1 NACH ANWENDUNG, 2025-2035 (MILLIARDEN USD)
      2. 7.22.2 NACH FORM, 2025-2035 (MILLIARDEN USD)
      3. 7.22.3 NACH ENDVERWENDUNGSINDUSTRIE, 2025-2035 (MILLIARDEN USD)
      4. 7.22.4 NACH TYP, 2025-2035 (MILLIARDEN USD)
    23. 7.23 MARKTGROßENBESCHÄTZUNGEN BRASILIEN; PROGNOSE
      1. 7.23.1 NACH ANWENDUNG, 2025-2035 (MILLIARDEN USD)
      2. 7.23.2 NACH FORM, 2025-2035 (MILLIARDEN USD)
      3. 7.23.3 NACH ENDVERWENDUNGSINDUSTRIE, 2025-2035 (MILLIARDEN USD)
      4. 7.23.4 NACH TYP, 2025-2035 (MILLIARDEN USD)
    24. 7.24 MARKTGROßENBESCHÄTZUNGEN MEXIKO; PROGNOSE
      1. 7.24.1 NACH ANWENDUNG, 2025-2035 (MILLIARDEN USD)
      2. 7.24.2 NACH FORM, 2025-2035 (MILLIARDEN USD)
      3. 7.24.3 NACH ENDVERWENDUNGSINDUSTRIE, 2025-2035 (MILLIARDEN USD)
      4. 7.24.4 NACH TYP, 2025-2035 (MILLIARDEN USD)
    25. 7.25 MARKTGROßENBESCHÄTZUNGEN ARGENTINIEN; PROGNOSE
      1. 7.25.1 NACH ANWENDUNG, 2025-2035 (MILLIARDEN USD)
      2. 7.25.2 NACH FORM, 2025-2035 (MILLIARDEN USD)
      3. 7.25.3 NACH ENDVERWENDUNGSINDUSTRIE, 2025-2035 (MILLIARDEN USD)
      4. 7.25.4 NACH TYP, 2025-2035 (MILLIARDEN USD)
    26. 7.26 MARKTGROßENBESCHÄTZUNGEN REST SÜDAMERIKA; PROGNOSE
      1. 7.26.1 NACH ANWENDUNG, 2025-2035 (MILLIARDEN USD)
      2. 7.26.2 NACH FORM, 2025-2035 (MILLIARDEN USD)
      3. 7.26.3 NACH ENDVERWENDUNGSINDUSTRIE, 2025-2035 (MILLIARDEN USD)
      4. 7.26.4 NACH TYP, 2025-2035 (MILLIARDEN USD)
    27. 7.27 MARKTGROßENBESCHÄTZUNGEN MEA; PROGNOSE
      1. 7.27.1 NACH ANWENDUNG, 2025-2035 (MILLIARDEN USD)
      2. 7.27.2 NACH FORM, 2025-2035 (MILLIARDEN USD)
      3. 7.27.3 NACH ENDVERWENDUNGSINDUSTRIE, 2025-2035 (MILLIARDEN USD)
      4. 7.27.4 NACH TYP, 2025-2035 (MILLIARDEN USD)
    28. 7.28 MARKTGROßENBESCHÄTZUNGEN GCC-LÄNDER; PROGNOSE
      1. 7.28.1 NACH ANWENDUNG, 2025-2035 (MILLIARDEN USD)
      2. 7.28.2 NACH FORM, 2025-2035 (MILLIARDEN USD)
      3. 7.28.3 NACH ENDVERWENDUNGSINDUSTRIE, 2025-2035 (MILLIARDEN USD)
      4. 7.28.4 NACH TYP, 2025-2035 (MILLIARDEN USD)
    29. 7.29 MARKTGROßENBESCHÄTZUNGEN SÜDAFRIKA; PROGNOSE
      1. 7.29.1 NACH ANWENDUNG, 2025-2035 (MILLIARDEN USD)
      2. 7.29.2 NACH FORM, 2025-2035 (MILLIARDEN USD)
      3. 7.29.3 NACH ENDVERWENDUNGSINDUSTRIE, 2025-2035 (MILLIARDEN USD)
      4. 7.29.4 NACH TYP, 2025-2035 (MILLIARDEN USD)
    30. 7.30 MARKTGROßENBESCHÄTZUNGEN REST MEA; PROGNOSE
      1. 7.30.1 NACH ANWENDUNG, 2025-2035 (MILLIARDEN USD)
      2. 7.30.2 NACH FORM, 2025-2035 (MILLIARDEN USD)
      3. 7.30.3 NACH ENDVERWENDUNGSINDUSTRIE, 2025-2035 (MILLIARDEN USD)
      4. 7.30.4 NACH TYP, 2025-2035 (MILLIARDEN USD)
    31. 7.31 PRODUKTEINFÜHRUNG/PRODUKTENTWICKLUNG/GENEHMIGUNG
    32. 7.32 AKQUISITION/PARTNERSCHAFT

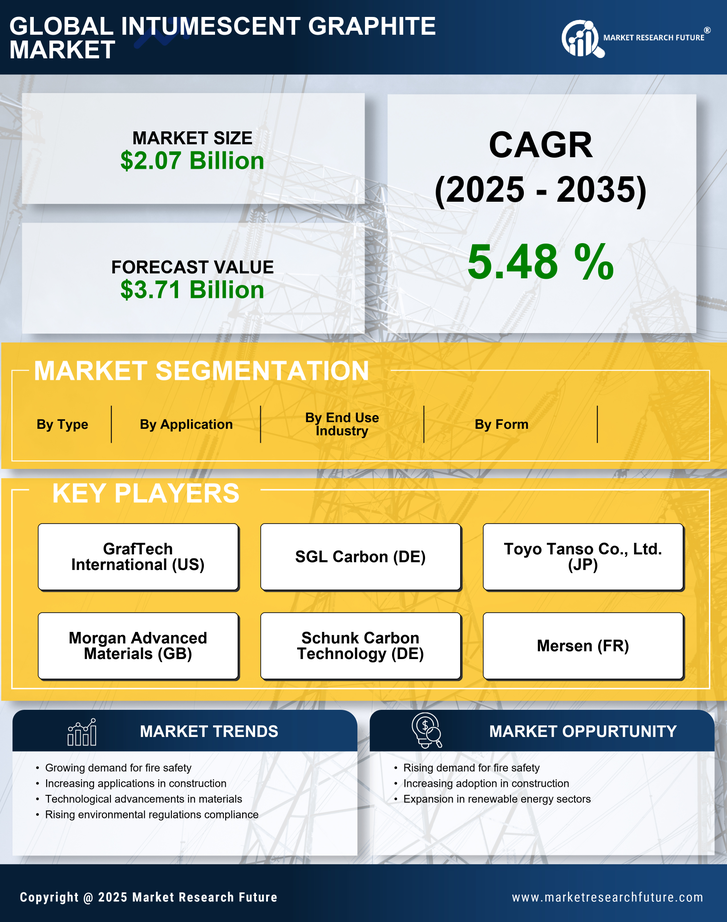
Intumeszierender Graphit-Marktsegmentierung


  • Markt für intumeszierendes Graphit nach Anwendung (Milliarden USD, 2019–2032)

    • Brandschutzsysteme

    • Isoliermaterialien

    • Beschichtungen


  • Markt für intumeszierendes Graphit nach Form (Milliarden USD, 2019–2032)

    • Flexibler Graphit

    • Starrer Graphit

    • Graphitfolie


  • Markt für intumeszierendes Graphit nach Endverbrauchsindustrie (Milliarden USD, 2019–2032)

    • Bauwesen

    • Automobil

    • Luft- und Raumfahrt


  • Markt für intumeszierendes Graphit nach Typ (Milliarden USD, 2019–2032)

    • Natürlicher Graphit

    • Synthetischer Graphit


  • Intumeszierender Graphitmarkt nach Regionen (Milliarden USD, 2019–2032)

    • Nordamerika

    • Europa

    • Südamerika

    • Asien-Pazifik

    • Naher Osten und Afrika


Regionaler Ausblick auf den Markt für intumeszierender Graphit (Milliarden USD, 2019–2032)


  • Nordamerika-Ausblick (in Mrd. USD, 2019–2032)

    • Nordamerikanischer Markt für intumeszierendes Graphit nach Anwendungstyp

      • Brandschutzsysteme

      • Isoliermaterialien

      • Beschichtungen

    • Nordamerikanischer Markt für intumeszierendes Graphit nach Formtyp

      • Flexibler Graphit

      • Starrer Graphit

      • Graphitfolie

    • Nordamerikanischer Markt für intumeszierendes Graphit nach Endanwendungsbranchentyp

      • Bau

      • Automobil

      • Luft- und Raumfahrt

    • Nordamerikanischer Markt für intumeszierendes Graphit nach Typ

      • Natürlicher Graphit

      • Synthetischer Graphit

    • Markt für intumeszierendes Graphit in Nordamerika nach regionalem Typ

      • USA

      • Kanada

    • US-Ausblick (Milliarden US-Dollar, 2019–2032)

    • US-Markt für intumeszierendes Graphit nach Anwendungstyp

      • Brandschutzsysteme

      • Isoliermaterialien

      • Beschichtungen

    • US-Markt für intumeszierendes Graphit nach Formtyp

      • Flexibler Graphit

      • Starrer Graphit

      • Graphitfolie

    • US-Markt für intumeszierendes Graphit nach Endverwendungsindustrietyp

      • Bau

      • Automobil

      • Luft- und Raumfahrt

    • US-Markt für intumeszierendes Graphit nach Typ

      • Natürlicher Graphit

      • Synthetischer Graphit

    • KANADA-Ausblick (Milliarden USD, 2019–2032)

    • Markt für intumeszierendes Graphit in Kanada nach Anwendungstyp

      • Brandschutzsysteme

      • Isoliermaterialien

      • Beschichtungen

    • Markt für intumeszierendes Graphit in Kanada nach Formtyp

      • Flexibler Graphit

      • Starrer Graphit

      • Graphitfolie

    • KANADA-Markt für intumeszierendes Graphit nach Endanwendungsbranchentyp

      • Bau

      • Automobil

      • Luft- und Raumfahrt

    • Markt für intumeszierendes Graphit in Kanada nach Typ

      • Natürlicher Graphit

      • Synthetischer Graphit

  • Europa-Ausblick (Milliarden US-Dollar, 2019–2032)

    • Europa-Markt für intumeszierendes Graphit nach Anwendungstyp

      • Brandschutzsysteme

      • Isoliermaterialien

      • Beschichtungen

    • Europa-Markt für intumeszierendes Graphit nach Formtyp

      • Flexibler Graphit

      • Starrer Graphit

      • Graphitfolie

    • Europa-Markt für intumeszierendes Graphit nach Endanwendungsindustrietyp

      • Bau

      • Automobil

      • Luft- und Raumfahrt

    • Europa-Markt für intumeszierendes Graphit nach Typ

      • Natürlicher Graphit

      • Synthetischer Graphit

    • Europa-Markt für intumeszierendes Graphit nach regionalem Typ

      • Deutschland

      • Großbritannien

      • Frankreich

      • Russland

      • Italien

      • Spanien

      • Restliches Europa

    • Ausblick für Deutschland (Milliarden US-Dollar, 2019–2032)

    • DEUTSCHLAND Intumeszierender Graphitmarkt nach Anwendungstyp

      • Brandschutzsysteme

      • Isoliermaterialien

      • Beschichtungen

    • DEUTSCHLAND Intumeszierender Graphitmarkt nach Formtyp

      • Flexibler Graphit

      • Starrer Graphit

      • Graphitfolie

    • DEUTSCHLAND Intumeszierender Graphitmarkt nach Endanwendungsindustrietyp

      • Bau

      • Automobil

      • Luft- und Raumfahrt

    • DEUTSCHLAND Intumeszierender Graphitmarkt nach Typ

      • Natürlicher Graphit

      • Synthetischer Graphit

    • UK Outlook (Milliarden USD, 2019–2032)

    • Markt für intumeszierendes Graphit im Vereinigten Königreich nach Anwendungstyp

      • Brandschutzsysteme

      • Isoliermaterialien

      • Beschichtungen

    • Markt für intumeszierendes Graphit im Vereinigten Königreich nach Formtyp

      • Flexibler Graphit

      • Starrer Graphit

      • Graphitfolie

    • Markt für intumeszierendes Graphit im Vereinigten Königreich nach Endanwendungsindustrietyp

      • Bau

      • Automobil

      • Luft- und Raumfahrt

    • UK-Markt für intumeszierendes Graphit nach Typ

      • Natürlicher Graphit

      • Synthetischer Graphit

    • FRANKREICH-Ausblick (Milliarden USD, 2019–2032)

    • Markt für intumeszierendes Graphit in Frankreich nach Anwendungstyp

      • Brandschutzsysteme

      • Isoliermaterialien

      • Beschichtungen

    • Markt für intumeszierendes Graphit in Frankreich nach Formtyp

      • Flexibler Graphit

      • Starrer Graphit

      • Graphitfolie

    • Markt für intumeszierendes Graphit in Frankreich nach Art der Endanwendungsbranche

      • Bau

      • Automobil

      • Luft- und Raumfahrt

    • Markt für intumeszierendes Graphit in Frankreich nach Typ

      • Natürlicher Graphit

      • Synthetischer Graphit

    • Russland-Ausblick (Milliarden US-Dollar, 2019–2032)

    • RUSSLAND Markt für intumeszierendes Graphit nach Anwendungstyp

      • Brandschutzsysteme

      • Isoliermaterialien

      • Beschichtungen

    • RUSSLAND Markt für intumeszierendes Graphit nach Formtyp

      • Flexibler Graphit

      • Starrer Graphit

      • Graphitfolie

    • RUSSLAND Markt für intumeszierendes Graphit nach Endanwendungsbranchentyp

      • Bau

      • Automobil

      • Luft- und Raumfahrt

    • RUSSLAND Intumeszierender Graphitmarkt nach Typ

      • Natürlicher Graphit

      • Synthetischer Graphit

    • Ausblick für Italien (Milliarden USD, 2019–2032)

    • ITALIEN Intumeszierender Graphitmarkt nach Anwendungstyp

      • Brandschutzsysteme

      • Isoliermaterialien

      • Beschichtungen

    • ITALIEN Intumeszierender Graphitmarkt nach Formtyp

      • Flexibler Graphit

      • Starrer Graphit

      • Graphitfolie

    • ITALIEN Markt für intumeszierendes Graphit nach Endanwendungsbranchentyp

      • Bau

      • Automobil

      • Luft- und Raumfahrt

    • ITALIEN Intumeszierender Graphitmarkt nach Typ

      • Natürlicher Graphit

      • Synthetischer Graphit

    • SPANIEN-Ausblick (Milliarden USD, 2019–2032)

    • Markt für intumeszierendes Graphit in Spanien nach Anwendungstyp

      • Brandschutzsysteme

      • Isoliermaterialien

      • Beschichtungen

    • Markt für intumeszierendes Graphit in Spanien nach Formtyp

      • Flexibler Graphit

      • Starrer Graphit

      • Graphitfolie

    • Markt für intumeszierendes Graphit in SPANIEN nach Art der Endanwendungsbranche

      • Bau

      • Automobil

      • Luft- und Raumfahrt

    • Markt für intumeszierendes Graphit in Spanien nach Typ

      • Natürlicher Graphit

      • Synthetischer Graphit

    • Übriges Europa – Ausblick (Milliarden US-Dollar, 2019–2032)

    • Übriges Europa – Markt für intumeszierendes Graphit nach Anwendungstyp

      • Brandschutzsysteme

      • Isoliermaterialien

      • Beschichtungen

    • Übriges Europa – Markt für intumeszierendes Graphit nach Formtyp

      • Flexibler Graphit

      • Starrer Graphit

      • Graphitfolie

    • Übriges Europa – Markt für intumeszierendes Graphit nach Endverbrauchsindustrietyp

      • Bau

      • Automobil

      • Luft- und Raumfahrt

    • Übriges Europa – Markt für intumeszierendes Graphit nach Typ

      • Natürlicher Graphit

      • Synthetischer Graphit

  • APAC-Ausblick (Milliarden USD, 2019–2032)

    • APAC-Markt für intumeszierendes Graphit nach Anwendungstyp

      • Brandschutzsysteme

      • Isoliermaterialien

      • Beschichtungen

    • APAC-Markt für intumeszierendes Graphit nach Formtyp

      • Flexibler Graphit

      • Starrer Graphit

      • Graphitfolie

    • APAC-Markt für intumeszierendes Graphit nach Endanwendungsbranchentyp

      • Bau

      • Automobil

      • Luft- und Raumfahrt

    • APAC-Markt für intumeszierendes Graphit nach Typ

      • Natürlicher Graphit

      • Synthetischer Graphit

    • APAC-Markt für intumeszierendes Graphit nach regionalem Typ

      • China

      • Indien

      • Japan

      • Südkorea

      • Malaysia

      • Thailand

      • Indonesien

      • Rest von APAC

    • CHINA-Ausblick (Milliarden US-Dollar, 2019–2032)

    • Markt für intumeszierendes Graphit in China nach Anwendungstyp

      • Brandschutzsysteme

      • Isoliermaterialien

      • Beschichtungen

    • CHINA-Markt für intumeszierendes Graphit nach Formtyp

      • Flexibler Graphit

      • Starrer Graphit

      • Graphitfolie

    • CHINA-Markt für intumeszierendes Graphit nach Endanwendungsbranchentyp

      • Bau

      • Automobil

      • Luft- und Raumfahrt

    • Markt für intumeszierendes Graphit in China nach Typ

      • Natürlicher Graphit

      • Synthetischer Graphit

    • Indien-Ausblick (Milliarden US-Dollar, 2019–2032)

    • Markt für intumeszierendes Graphit in Indien nach Anwendungstyp

      • Brandschutzsysteme

      • Isoliermaterialien

      • Beschichtungen

    • Markt für intumeszierendes Graphit in Indien nach Formtyp

      • Flexibler Graphit

      • Starrer Graphit

      • Graphitfolie

    • Indien-Markt für intumeszierendes Graphit nach Endanwendungsbranchentyp

      • Bau

      • Automobil

      • Luft- und Raumfahrt

    • Markt für intumeszierendes Graphit in Indien nach Typ

      • Natürlicher Graphit

      • Synthetischer Graphit

    • JAPAN Outlook (Milliarden USD, 2019–2032)

    • JAPANischer Markt für intumeszierendes Graphit nach Anwendungstyp

      • Brandschutzsysteme

      • Isoliermaterialien

      • Beschichtungen

    • JAPANischer Markt für intumeszierendes Graphit nach Formtyp

      • Flexibler Graphit

      • Starrer Graphit

      • Graphitfolie

    • JAPANischer Markt für intumeszierendes Graphit nach Endanwendungsbranchentyp

      • Bau

      • Automobil

      • Luft- und Raumfahrt

    • JAPANischer Markt für intumeszierendes Graphit nach Typ

      • Natürlicher Graphit

      • Synthetischer Graphit

    • Ausblick für SÜDKOREA (Milliarden USD, 2019–2032)

    • Markt für intumeszierendes Graphit in SÜDKOREA nach Anwendungstyp

      • Brandschutzsysteme

      • Isoliermaterialien

      • Beschichtungen

    • Markt für intumeszierendes Graphit in SÜDKOREA nach Formtyp

      • Flexibler Graphit

      • Starrer Graphit

      • Graphitfolie

    • Markt für intumeszierendes Graphit in SÜDKOREA nach Endanwendungsindustrietyp

      • Bau

      • Automobil

      • Luft- und Raumfahrt

    • Markt für intumeszierendes Graphit in SÜDKOREA nach Typ

      • Natürlicher Graphit

      • Synthetischer Graphit

    • MALAYSIA-Ausblick (Milliarden USD, 2019–2032)

    • Markt für intumeszierendes Graphit in MALAYSIA nach Anwendungstyp

      • Brandschutzsysteme

      • Isoliermaterialien

      • Beschichtungen

    • Markt für intumeszierendes Graphit in MALAYSIA nach Formtyp

      • Flexibler Graphit

      • Starrer Graphit

      • Graphitfolie

    • Markt für intumeszierendes Graphit in MALAYSIA nach Endanwendungsbranchentyp

      • Bau

      • Automobil

      • Luft- und Raumfahrt

    • MALAYSIA Markt für intumeszierendes Graphit nach Typ

      • Natürlicher Graphit

      • Synthetischer Graphit

    • THAILAND-Ausblick (Milliarden USD, 2019–2032)

    • THAILAND Intumeszierender Graphitmarkt nach Anwendungstyp

      • Brandschutzsysteme

      • Isoliermaterialien

      • Beschichtungen

    • THAILAND-Markt für intumeszierendes Graphit nach Formtyp

      • Flexibler Graphit

      • Starrer Graphit

      • Graphitfolie

    • THAILAND-Markt für intumeszierendes Graphit nach Endanwendungsbranchentyp

      • Bau

      • Automobil

      • Luft- und Raumfahrt

    • THAILAND Intumeszierender Graphitmarkt nach Typ

      • Natürlicher Graphit

      • Synthetischer Graphit

    • Indonesien-Ausblick (Milliarden US-Dollar, 2019–2032)

    • INDONESIEN Markt für intumeszierendes Graphit nach Anwendungstyp

      • Brandschutzsysteme

      • Isoliermaterialien

      • Beschichtungen

    • INDONESIEN Intumeszierender Graphitmarkt nach Formtyp

      • Flexibler Graphit

      • Starrer Graphit

      • Graphitfolie

    • INDONESIEN Markt für intumeszierendes Graphit nach Endverbrauchsbranchentyp

      • Bau

      • Automobil

      • Luft- und Raumfahrt

    • INDONESIEN Intumeszierender Graphitmarkt nach Typ

      • Natürlicher Graphit

      • Synthetischer Graphit

    • Restlicher APAC-Ausblick (in Mrd. USD, 2019–2032)

    • REST OF APAC Intumescent Graphite Market nach Anwendungstyp

      • Brandschutzsysteme

      • Isoliermaterialien

      • Beschichtungen

    • REST OF APAC Intumescent Graphite Market by Form Type

      • Flexibler Graphit

      • Starrer Graphit

      • Graphitfolie

    • REST OF APAC Intumescent Graphite Market by End Use Industry Type

      • Bau

      • Automobil

      • Luft- und Raumfahrt

    • REST OF APAC Intumescent Graphite Market nach Typ

      • Natürlicher Graphit

      • Synthetischer Graphit

  • Südamerika-Ausblick (Milliarden USD, 2019–2032)

    • Südamerikanischer Markt für intumeszierendes Graphit nach Anwendungstyp

      • Brandschutzsysteme

      • Isoliermaterialien

      • Beschichtungen

    • Südamerikanischer Markt für intumeszierendes Graphit nach Formtyp

      • Flexibler Graphit

      • Starrer Graphit

      • Graphitfolie

    • Südamerikanischer Markt für intumeszierendes Graphit nach Endanwendungsbranchentyp

      • Bau

      • Automobil

      • Luft- und Raumfahrt

    • Markt für intumeszierendes Graphit in Südamerika nach Typ

      • Natürlicher Graphit

      • Synthetischer Graphit

    • Südamerikanischer Markt für intumeszierendes Graphit nach regionalem Typ

      • Brasilien

      • Mexiko

      • Argentinien

      • Restliches Südamerika

    • Brasilien-Ausblick (Milliarden US-Dollar, 2019–2032)

    • BRASILIEN-Markt für intumeszierendes Graphit nach Anwendungstyp

      • Brandschutzsysteme

      • Isoliermaterialien

      • Beschichtungen

    • BRASILIEN-Markt für intumeszierendes Graphit nach Formtyp

      • Flexibler Graphit

      • Starrer Graphit

      • Graphitfolie

    • BRASILIEN-Markt für intumeszierendes Graphit nach Endanwendungsbranchentyp

      • Bau

      • Automobil

      • Luft- und Raumfahrt

    • BRASILIEN-Markt für intumeszierendes Graphit nach Typ

      • Natürlicher Graphit

      • Synthetischer Graphit

    • Mexiko-Ausblick (Milliarden US-Dollar, 2019–2032)

    • Markt für intumeszierendes Graphit in Mexiko nach Anwendungstyp

      • Brandschutzsysteme

      • Isoliermaterialien

      • Beschichtungen

    • Markt für intumeszierendes Graphit in Mexiko nach Formtyp

      • Flexibler Graphit

      • Starrer Graphit

      • Graphitfolie

    • MEXIKO-Markt für intumeszierendes Graphit nach Endanwendungsbranchentyp

      • Bau

      • Automobil

      • Luft- und Raumfahrt

    • Markt für intumeszierendes Graphit in Mexiko nach Typ

      • Natürlicher Graphit

      • Synthetischer Graphit

    • Argentinien-Ausblick (Milliarden US-Dollar, 2019–2032)

    • ARGENTINIEN Markt für intumeszierendes Graphit nach Anwendungstyp

      • Brandschutzsysteme

      • Isoliermaterialien

      • Beschichtungen

    • ARGENTINIEN Markt für intumeszierendes Graphit nach Formtyp

      • Flexibler Graphit

      • Starrer Graphit

      • Graphitfolie

    • ARGENTINIEN-Markt für intumeszierendes Graphit nach Endanwendungsbranchentyp

      • Bau

      • Automobil

      • Luft- und Raumfahrt

    • ARGENTINIEN Intumeszierender Graphitmarkt nach Typ

      • Natürlicher Graphit

      • Synthetischer Graphit

    • Übriges Südamerika – Ausblick (Milliarden US-Dollar, 2019–2032)

    • Übriges SÜDAMERIKA Markt für intumeszierendes Graphit nach Anwendungstyp

      • Brandschutzsysteme

      • Isoliermaterialien

      • Beschichtungen

    • Übriges SÜDAMERIKA Markt für intumeszierendes Graphit nach Formtyp

      • Flexibler Graphit

      • Starrer Graphit

      • Graphitfolie

    • Übriges SÜDAMERIKA Markt für intumeszierendes Graphit nach Endverwendungsindustrietyp

      • Bau

      • Automobil

      • Luft- und Raumfahrt

    • Übriges SÜDAMERIKA Markt für intumeszierendes Graphit nach Typ

      • Natürlicher Graphit

      • Synthetischer Graphit

  • MEA-Ausblick (Milliarden USD, 2019–2032)

    • MEA-Markt für intumeszierendes Graphit nach Anwendungstyp

      • Brandschutzsysteme

      • Isoliermaterialien

      • Beschichtungen

    • MEA-Markt für intumeszierendes Graphit nach Formtyp

      • Flexibler Graphit

      • Starrer Graphit

      • Graphitfolie

    • MEA-Markt für intumeszierendes Graphit nach Endanwendungsbranchentyp

      • Bau

      • Automobil

      • Luft- und Raumfahrt

    • MEA-Markt für intumeszierendes Graphit nach Typ

      • Natürlicher Graphit

      • Synthetischer Graphit

    • MEA-Markt für intumeszierendes Graphit nach regionalem Typ

      • GCC-Länder

      • Südafrika

      • Rest von MEA

    • GCC-LÄNDER Ausblick (Milliarden USD, 2019–2032)

    • GCC-LÄNDER Markt für intumeszierendes Graphit nach Anwendungstyp

      • Brandschutzsysteme

      • Isoliermaterialien

      • Beschichtungen

    • GCC-LÄNDER Markt für intumeszierendes Graphit nach Formtyp

      • Flexibler Graphit

      • Starrer Graphit

      • Graphitfolie

    • GCC-LÄNDER Markt für intumeszierendes Graphit nach Endverbrauchsbranchentyp

      • Bau

      • Automobil

      • Luft- und Raumfahrt

    • GCC-LÄNDER Intumeszierender Graphitmarkt nach Typ

      • Natürlicher Graphit

      • Synthetischer Graphit

    • Ausblick für Südafrika (Milliarden US-Dollar, 2019–2032)

    • Markt für intumeszierendes Graphit in Südafrika nach Anwendungstyp

      • Brandschutzsysteme

      • Isoliermaterialien

      • Beschichtungen

    • Markt für intumeszierendes Graphit in Südafrika nach Formtyp

      • Flexibler Graphit

      • Starrer Graphit

      • Graphitfolie

    • Markt für intumeszierendes Graphit in SÜDAFRIKA nach Endanwendungsindustrietyp

      • Bau

      • Automobil

      • Luft- und Raumfahrt

    • Markt für intumeszierendes Graphit in Südafrika nach Typ

      • Natürlicher Graphit

      • Synthetischer Graphit

    • REST OF MEA Outlook (Milliarden USD, 2019–2032)

    • REST OF MEA Markt für intumeszierendes Graphit nach Anwendungstyp

      • Brandschutzsysteme

      • Isoliermaterialien

      • Beschichtungen

    • REST OF MEA Markt für intumeszierendes Graphit nach Formtyp

      • Flexibler Graphit

      • Starrer Graphit

      • Graphitfolie

    • REST OF MEA Intumescent Graphite Market by End Use Industry Type

      • Bau

      • Automobil

      • Luft- und Raumfahrt

    • REST OF MEA Markt für intumeszierendes Graphit nach Typ

      • Natürlicher Graphit

      • Synthetischer Graphit


Compare Licence

×
Features License Type
Single User Multiuser License Enterprise User
Price $4,950 $ $7,250
Maximum User Access Limit 1 User Upto 10 Users Unrestricted Access Throughout the Organization
Free Customization
Direct Access to Analyst
Deliverable Format
Platform Access
Discount on Next Purchase 10% 15% 15%
Printable Versions