ERP-Softwaremarkt
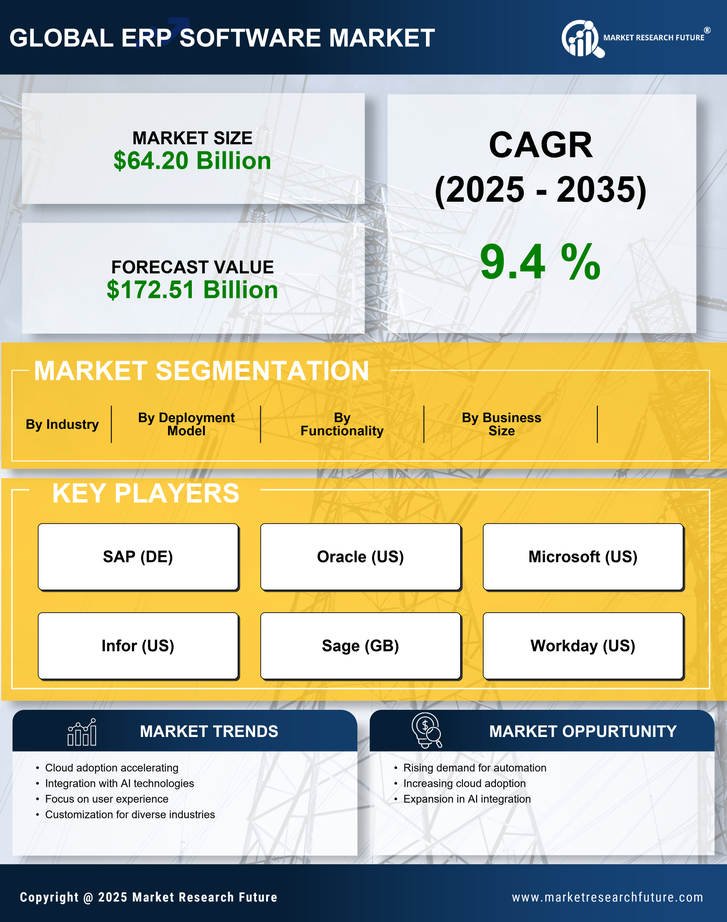
Market Size
Key Players
- Cloud Adoption
- Industry-Specific Solutions
- Integration of AI and Automation
- Focus on Cost Efficiency
- Increased Demand for Real-Time Data
- Shift Towards Customizable Solutions
-
1 ABSCHNITT I: ZUSAMMENFASSUNG UND WICHTIGSTE HIGHLIGHTS
-
1.1 ZUSAMMENFASSUNG
- 1.1.1 Marktübersicht
- 1.1.2 Wichtige Ergebnisse
- 1.1.3 Marktsegmentierung
- 1.1.4 Wettbewerbslandschaft
- 1.1.5 Herausforderungen und Chancen
- 1.1.6 Zukünftige Aussichten
-
1.1 ZUSAMMENFASSUNG
-
2 ABSCHNITT II: ABGRENZUNG, METHODOLOGIE UND MARKTSTRUKTUR
-
2.1 MARKTEINFÜHRUNG
- 2.1.1 Definition
-
2.1.2 Umfang der Studie
- 2.1.2.1 Forschungsziel
- 2.1.2.2 Annahme
- 2.1.2.3 Einschränkungen
-
2.2 FORSCHUNGSMETHODOLOGIE
- 2.2.1 Überblick
- 2.2.2 Datenanalyse
- 2.2.3 Sekundärforschung
-
2.2.4 Primärforschung
- 2.2.4.1 Primärinterviews und Informationssammlungsprozess
- 2.2.4.2 Aufschlüsselung der primären Befragten
- 2.2.5 Prognosemodell
-
2.2.6 Marktschätzung
- 2.2.6.1 Bottom-Up-Ansatz
- 2.2.6.2 Top-Down-Ansatz
- 2.2.7 Daten-Triangulation
- 2.2.8 Validierung
-
2.1 MARKTEINFÜHRUNG
-
3 ABSCHNITT III: QUALITATIVE ANALYSE
-
3.1 MARKTDYNAMIK
- 3.1.1 Überblick
- 3.1.2 Treiber
- 3.1.3 Einschränkungen
- 3.1.4 Chancen
-
3.2 MARKTFACHT ANALYSE
- 3.2.1 Wertschöpfungskettenanalyse
-
3.2.2 Porters Fünf Kräfte Analyse
- 3.2.2.1 Verhandlungsmacht der Lieferanten
- 3.2.2.2 Verhandlungsmacht der Käufer
- 3.2.2.3 Bedrohung durch neue Anbieter
- 3.2.2.4 Bedrohung durch Substitute
- 3.2.2.5 Intensität der Rivalität
-
3.2.3 COVID-19 Auswirkungen Analyse
- 3.2.3.1 Markt Auswirkungen Analyse
- 3.2.3.2 Regionale Auswirkungen
- 3.2.3.3 Chancen- und Bedrohungsanalyse
-
3.1 MARKTDYNAMIK
-
4 ABSCHNITT IV: QUANTITATIVE ANALYSE
-
4.1 Informations- und Kommunikationstechnologie, NACH Bereitstellungsmodell (Milliarden USD)
- 4.1.1 Vor-Ort
- 4.1.2 Cloud-basiert
- 4.1.3 Hybrid
-
4.2 Informations- und Kommunikationstechnologie, NACH Unternehmensgröße (Milliarden USD)
- 4.2.1 Kleine Unternehmen
- 4.2.2 Mittlere Unternehmen
- 4.2.3 Große Unternehmen
-
4.3 Informations- und Kommunikationstechnologie, NACH Funktionalität (Milliarden USD)
- 4.3.1 Finanzmanagement
- 4.3.2 Lieferkettenmanagement
- 4.3.3 Personalmanagement
- 4.3.4 Kundenbeziehungsmanagement
-
4.4 Informations- und Kommunikationstechnologie, NACH Branche (Milliarden USD)
- 4.4.1 Fertigung
- 4.4.2 Einzelhandel
- 4.4.3 Gesundheitswesen
- 4.4.4 Bildung
-
4.5 Informations- und Kommunikationstechnologie, NACH Region (Milliarden USD)
-
4.5.1 Nordamerika
- 4.5.1.1 USA
- 4.5.1.2 Kanada
-
4.5.2 Europa
- 4.5.2.1 Deutschland
- 4.5.2.2 UK
- 4.5.2.3 Frankreich
- 4.5.2.4 Russland
- 4.5.2.5 Italien
- 4.5.2.6 Spanien
- 4.5.2.7 Rest von Europa
-
4.5.3 APAC
- 4.5.3.1 China
- 4.5.3.2 Indien
- 4.5.3.3 Japan
- 4.5.3.4 Südkorea
- 4.5.3.5 Malaysia
- 4.5.3.6 Thailand
- 4.5.3.7 Indonesien
- 4.5.3.8 Rest von APAC
-
4.5.4 Südamerika
- 4.5.4.1 Brasilien
- 4.5.4.2 Mexiko
- 4.5.4.3 Argentinien
- 4.5.4.4 Rest von Südamerika
-
4.5.5 MEA
- 4.5.5.1 GCC-Länder
- 4.5.5.2 Südafrika
- 4.5.5.3 Rest von MEA
-
4.5.1 Nordamerika
-
4.1 Informations- und Kommunikationstechnologie, NACH Bereitstellungsmodell (Milliarden USD)
-
5 ABSCHNITT V: WETTBEWERBSANALYSE
-
5.1 Wettbewerbslandschaft
- 5.1.1 Überblick
- 5.1.2 Wettbewerbsanalyse
- 5.1.3 Marktanteilsanalyse
- 5.1.4 Hauptwachstumsstrategie in der Informations- und Kommunikationstechnologie
- 5.1.5 Wettbewerbsbenchmarking
- 5.1.6 Führende Akteure in Bezug auf die Anzahl der Entwicklungen in der Informations- und Kommunikationstechnologie
-
5.1.7 Wichtige Entwicklungen und Wachstumsstrategien
- 5.1.7.1 Neue Produkteinführungen/Dienstleistungsbereitstellungen
- 5.1.7.2 Fusionen & Übernahmen
- 5.1.7.3 Joint Ventures
-
5.1.8 Finanzmatrix der Hauptakteure
- 5.1.8.1 Umsatz und Betriebseinkommen
- 5.1.8.2 F&E-Ausgaben der Hauptakteure. 2023
-
5.2 Unternehmensprofile
-
5.2.1 SAP (DE)
- 5.2.1.1 Finanzübersicht
- 5.2.1.2 Angebotene Produkte
- 5.2.1.3 Wichtige Entwicklungen
- 5.2.1.4 SWOT-Analyse
- 5.2.1.5 Schlüsselstrategien
-
5.2.2 Oracle (US)
- 5.2.2.1 Finanzübersicht
- 5.2.2.2 Angebotene Produkte
- 5.2.2.3 Wichtige Entwicklungen
- 5.2.2.4 SWOT-Analyse
- 5.2.2.5 Schlüsselstrategien
-
5.2.3 Microsoft (US)
- 5.2.3.1 Finanzübersicht
- 5.2.3.2 Angebotene Produkte
- 5.2.3.3 Wichtige Entwicklungen
- 5.2.3.4 SWOT-Analyse
- 5.2.3.5 Schlüsselstrategien
-
5.2.4 Infor (US)
- 5.2.4.1 Finanzübersicht
- 5.2.4.2 Angebotene Produkte
- 5.2.4.3 Wichtige Entwicklungen
- 5.2.4.4 SWOT-Analyse
- 5.2.4.5 Schlüsselstrategien
-
5.2.5 Sage (GB)
- 5.2.5.1 Finanzübersicht
- 5.2.5.2 Angebotene Produkte
- 5.2.5.3 Wichtige Entwicklungen
- 5.2.5.4 SWOT-Analyse
- 5.2.5.5 Schlüsselstrategien
-
5.2.6 Workday (US)
- 5.2.6.1 Finanzübersicht
- 5.2.6.2 Angebotene Produkte
- 5.2.6.3 Wichtige Entwicklungen
- 5.2.6.4 SWOT-Analyse
- 5.2.6.5 Schlüsselstrategien
-
5.2.7 NetSuite (US)
- 5.2.7.1 Finanzübersicht
- 5.2.7.2 Angebotene Produkte
- 5.2.7.3 Wichtige Entwicklungen
- 5.2.7.4 SWOT-Analyse
- 5.2.7.5 Schlüsselstrategien
-
5.2.8 Epicor (US)
- 5.2.8.1 Finanzübersicht
- 5.2.8.2 Angebotene Produkte
- 5.2.8.3 Wichtige Entwicklungen
- 5.2.8.4 SWOT-Analyse
- 5.2.8.5 Schlüsselstrategien
-
5.2.9 Acumatica (US)
- 5.2.9.1 Finanzübersicht
- 5.2.9.2 Angebotene Produkte
- 5.2.9.3 Wichtige Entwicklungen
- 5.2.9.4 SWOT-Analyse
- 5.2.9.5 Schlüsselstrategien
-
5.2.1 SAP (DE)
-
5.3 Anhang
- 5.3.1 Referenzen
- 5.3.2 Verwandte Berichte
-
5.1 Wettbewerbslandschaft
-
6 LISTE DER ABBILDUNGEN
- 6.1 MARKTSYNOPSIS
- 6.2 NORDAMERIKA MARKTANALYSE
- 6.3 USA MARKTANALYSE NACH BEREITSTELLUNGSFORM
- 6.4 USA MARKTANALYSE NACH UNTERNEHMENSGRÖSSE
- 6.5 USA MARKTANALYSE NACH FUNKTIONALITÄT
- 6.6 USA MARKTANALYSE NACH BRANCHE
- 6.7 KANADA MARKTANALYSE NACH BEREITSTELLUNGSFORM
- 6.8 KANADA MARKTANALYSE NACH UNTERNEHMENSGRÖSSE
- 6.9 KANADA MARKTANALYSE NACH FUNKTIONALITÄT
- 6.10 KANADA MARKTANALYSE NACH BRANCHE
- 6.11 EUROPA MARKTANALYSE
- 6.12 DEUTSCHLAND MARKTANALYSE NACH BEREITSTELLUNGSFORM
- 6.13 DEUTSCHLAND MARKTANALYSE NACH UNTERNEHMENSGRÖSSE
- 6.14 DEUTSCHLAND MARKTANALYSE NACH FUNKTIONALITÄT
- 6.15 DEUTSCHLAND MARKTANALYSE NACH BRANCHE
- 6.16 UK MARKTANALYSE NACH BEREITSTELLUNGSFORM
- 6.17 UK MARKTANALYSE NACH UNTERNEHMENSGRÖSSE
- 6.18 UK MARKTANALYSE NACH FUNKTIONALITÄT
- 6.19 UK MARKTANALYSE NACH BRANCHE
- 6.20 FRANKREICH MARKTANALYSE NACH BEREITSTELLUNGSFORM
- 6.21 FRANKREICH MARKTANALYSE NACH UNTERNEHMENSGRÖSSE
- 6.22 FRANKREICH MARKTANALYSE NACH FUNKTIONALITÄT
- 6.23 FRANKREICH MARKTANALYSE NACH BRANCHE
- 6.24 RUSSLAND MARKTANALYSE NACH BEREITSTELLUNGSFORM
- 6.25 RUSSLAND MARKTANALYSE NACH UNTERNEHMENSGRÖSSE
- 6.26 RUSSLAND MARKTANALYSE NACH FUNKTIONALITÄT
- 6.27 RUSSLAND MARKTANALYSE NACH BRANCHE
- 6.28 ITALIEN MARKTANALYSE NACH BEREITSTELLUNGSFORM
- 6.29 ITALIEN MARKTANALYSE NACH UNTERNEHMENSGRÖSSE
- 6.30 ITALIEN MARKTANALYSE NACH FUNKTIONALITÄT
- 6.31 ITALIEN MARKTANALYSE NACH BRANCHE
- 6.32 SPANIEN MARKTANALYSE NACH BEREITSTELLUNGSFORM
- 6.33 SPANIEN MARKTANALYSE NACH UNTERNEHMENSGRÖSSE
- 6.34 SPANIEN MARKTANALYSE NACH FUNKTIONALITÄT
- 6.35 SPANIEN MARKTANALYSE NACH BRANCHE
- 6.36 REST VON EUROPA MARKTANALYSE NACH BEREITSTELLUNGSFORM
- 6.37 REST VON EUROPA MARKTANALYSE NACH UNTERNEHMENSGRÖSSE
- 6.38 REST VON EUROPA MARKTANALYSE NACH FUNKTIONALITÄT
- 6.39 REST VON EUROPA MARKTANALYSE NACH BRANCHE
- 6.40 APAC MARKTANALYSE
- 6.41 CHINA MARKTANALYSE NACH BEREITSTELLUNGSFORM
- 6.42 CHINA MARKTANALYSE NACH UNTERNEHMENSGRÖSSE
- 6.43 CHINA MARKTANALYSE NACH FUNKTIONALITÄT
- 6.44 CHINA MARKTANALYSE NACH BRANCHE
- 6.45 INDIEN MARKTANALYSE NACH BEREITSTELLUNGSFORM
- 6.46 INDIEN MARKTANALYSE NACH UNTERNEHMENSGRÖSSE
- 6.47 INDIEN MARKTANALYSE NACH FUNKTIONALITÄT
- 6.48 INDIEN MARKTANALYSE NACH BRANCHE
- 6.49 JAPAN MARKTANALYSE NACH BEREITSTELLUNGSFORM
- 6.50 JAPAN MARKTANALYSE NACH UNTERNEHMENSGRÖSSE
- 6.51 JAPAN MARKTANALYSE NACH FUNKTIONALITÄT
- 6.52 JAPAN MARKTANALYSE NACH BRANCHE
- 6.53 SÜDKOREA MARKTANALYSE NACH BEREITSTELLUNGSFORM
- 6.54 SÜDKOREA MARKTANALYSE NACH UNTERNEHMENSGRÖSSE
- 6.55 SÜDKOREA MARKTANALYSE NACH FUNKTIONALITÄT
- 6.56 SÜDKOREA MARKTANALYSE NACH BRANCHE
- 6.57 MALAYSIA MARKTANALYSE NACH BEREITSTELLUNGSFORM
- 6.58 MALAYSIA MARKTANALYSE NACH UNTERNEHMENSGRÖSSE
- 6.59 MALAYSIA MARKTANALYSE NACH FUNKTIONALITÄT
- 6.60 MALAYSIA MARKTANALYSE NACH BRANCHE
- 6.61 THAILAND MARKTANALYSE NACH BEREITSTELLUNGSFORM
- 6.62 THAILAND MARKTANALYSE NACH UNTERNEHMENSGRÖSSE
- 6.63 THAILAND MARKTANALYSE NACH FUNKTIONALITÄT
- 6.64 THAILAND MARKTANALYSE NACH BRANCHE
- 6.65 INDONESIEN MARKTANALYSE NACH BEREITSTELLUNGSFORM
- 6.66 INDONESIEN MARKTANALYSE NACH UNTERNEHMENSGRÖSSE
- 6.67 INDONESIEN MARKTANALYSE NACH FUNKTIONALITÄT
- 6.68 INDONESIEN MARKTANALYSE NACH BRANCHE
- 6.69 REST VON APAC MARKTANALYSE NACH BEREITSTELLUNGSFORM
- 6.70 REST VON APAC MARKTANALYSE NACH UNTERNEHMENSGRÖSSE
- 6.71 REST VON APAC MARKTANALYSE NACH FUNKTIONALITÄT
- 6.72 REST VON APAC MARKTANALYSE NACH BRANCHE
- 6.73 SÜDAMERIKA MARKTANALYSE
- 6.74 BRASILIEN MARKTANALYSE NACH BEREITSTELLUNGSFORM
- 6.75 BRASILIEN MARKTANALYSE NACH UNTERNEHMENSGRÖSSE
- 6.76 BRASILIEN MARKTANALYSE NACH FUNKTIONALITÄT
- 6.77 BRASILIEN MARKTANALYSE NACH BRANCHE
- 6.78 MEXIKO MARKTANALYSE NACH BEREITSTELLUNGSFORM
- 6.79 MEXIKO MARKTANALYSE NACH UNTERNEHMENSGRÖSSE
- 6.80 MEXIKO MARKTANALYSE NACH FUNKTIONALITÄT
- 6.81 MEXIKO MARKTANALYSE NACH BRANCHE
- 6.82 ARGENTINIEN MARKTANALYSE NACH BEREITSTELLUNGSFORM
- 6.83 ARGENTINIEN MARKTANALYSE NACH UNTERNEHMENSGRÖSSE
- 6.84 ARGENTINIEN MARKTANALYSE NACH FUNKTIONALITÄT
- 6.85 ARGENTINIEN MARKTANALYSE NACH BRANCHE
- 6.86 REST VON SÜDAMERIKA MARKTANALYSE NACH BEREITSTELLUNGSFORM
- 6.87 REST VON SÜDAMERIKA MARKTANALYSE NACH UNTERNEHMENSGRÖSSE
- 6.88 REST VON SÜDAMERIKA MARKTANALYSE NACH FUNKTIONALITÄT
- 6.89 REST VON SÜDAMERIKA MARKTANALYSE NACH BRANCHE
- 6.90 MEA MARKTANALYSE
- 6.91 GCC-LÄNDER MARKTANALYSE NACH BEREITSTELLUNGSFORM
- 6.92 GCC-LÄNDER MARKTANALYSE NACH UNTERNEHMENSGRÖSSE
- 6.93 GCC-LÄNDER MARKTANALYSE NACH FUNKTIONALITÄT
- 6.94 GCC-LÄNDER MARKTANALYSE NACH BRANCHE
- 6.95 SÜDAFRIKA MARKTANALYSE NACH BEREITSTELLUNGSFORM
- 6.96 SÜDAFRIKA MARKTANALYSE NACH UNTERNEHMENSGRÖSSE
- 6.97 SÜDAFRIKA MARKTANALYSE NACH FUNKTIONALITÄT
- 6.98 SÜDAFRIKA MARKTANALYSE NACH BRANCHE
- 6.99 REST VON MEA MARKTANALYSE NACH BEREITSTELLUNGSFORM
- 6.100 REST VON MEA MARKTANALYSE NACH UNTERNEHMENSGRÖSSE
- 6.101 REST VON MEA MARKTANALYSE NACH FUNKTIONALITÄT
- 6.102 REST VON MEA MARKTANALYSE NACH BRANCHE
- 6.103 WICHTIGE KAUFKRITERIEN DER INFORMATIONEN UND KOMMUNIKATIONSTECHNOLOGIE
- 6.104 FORSCHUNGSPROZESS VON MRFR
- 6.105 DRO-ANALYSE DER INFORMATIONEN UND KOMMUNIKATIONSTECHNOLOGIE
- 6.106 TREIBERWIRKUNGSANALYSE: INFORMATIONEN UND KOMMUNIKATIONSTECHNOLOGIE
- 6.107 EINSCHRÄNKUNGENWIRKUNGSANALYSE: INFORMATIONEN UND KOMMUNIKATIONSTECHNOLOGIE
- 6.108 LIEFER-/WERTSCHÖPFUNGSKETTE: INFORMATIONEN UND KOMMUNIKATIONSTECHNOLOGIE
- 6.109 INFORMATIONEN UND KOMMUNIKATIONSTECHNOLOGIE, NACH BEREITSTELLUNGSFORM, 2024 (% ANTEIL)
- 6.110 INFORMATIONEN UND KOMMUNIKATIONSTECHNOLOGIE, NACH BEREITSTELLUNGSFORM, 2024 BIS 2035 (Milliarden USD)
- 6.111 INFORMATIONEN UND KOMMUNIKATIONSTECHNOLOGIE, NACH UNTERNEHMENSGRÖSSE, 2024 (% ANTEIL)
- 6.112 INFORMATIONEN UND KOMMUNIKATIONSTECHNOLOGIE, NACH UNTERNEHMENSGRÖSSE, 2024 BIS 2035 (Milliarden USD)
- 6.113 INFORMATIONEN UND KOMMUNIKATIONSTECHNOLOGIE, NACH FUNKTIONALITÄT, 2024 (% ANTEIL)
- 6.114 INFORMATIONEN UND KOMMUNIKATIONSTECHNOLOGIE, NACH FUNKTIONALITÄT, 2024 BIS 2035 (Milliarden USD)
- 6.115 INFORMATIONEN UND KOMMUNIKATIONSTECHNOLOGIE, NACH BRANCHE, 2024 (% ANTEIL)
- 6.116 INFORMATIONEN UND KOMMUNIKATIONSTECHNOLOGIE, NACH BRANCHE, 2024 BIS 2035 (Milliarden USD)
- 6.117 BENCHMARKING DER HAUPTWETTBEWERBER
Customer Stories

“This is really good guys. Excellent work on a tight deadline. I will continue to use you going forward and recommend you to others. Nice job”

“Thanks. It’s been a pleasure working with you, please use me as reference with any other Intel employees.”

“Thanks for sending the report it gives us a good global view of the Betaïne market.”

“Thank you, this will be very helpful for OQS.”

“We found the report very insightful! we found your research firm very helpful. I'm sending this email to secure our future business.”

“I am very pleased with how market segments have been defined in a relevant way for my purposes (such as "Portable Freezers & refrigerators" and "last-mile"). In general the report is well structured. Thanks very much for your efforts.”

“I have been reading the first document or the study, ,the Global HVAC and FP market report 2021 till 2026. Must say, good info! I have not gone in depth at all parts, but got a good indication of the data inside!”

“We got the report in time, we really thank you for your support in this process. I also thank to all of your team as they did a great job.”