Request Free Sample ×

Kindly complete the form below to receive a free sample of this Report

* Please use a valid business email

Leading companies partner with us for data-driven Insights

clients tt-cursor
Hero Background

Automatische Bewehrungsbindemaschinenmarkt

ID: MRFR/Equip/37032-HCR
128 Pages
Aarti Dhapte
Last Updated: April 06, 2026

Marktforschungsbericht über automatische Bewehrungsbindemaschinen nach Anwendung (Bau, Infrastruktur, Bauingenieurwesen, Industrie), nach Typ (halbautomatisch, vollautomatisch), nach Betriebsmodus (elektrisch, pneumatisch, hydraulisch), nach Vertriebskanal (online, offline) und nach Region (Nordamerika, Europa, Südamerika, Asien-Pazifik, Naher Osten und Afrika) - Prognose bis 2035

Teilen
Download PDF ×

We do not share your information with anyone. However, we may send you emails based on your report interest from time to time. You may contact us at any time to opt-out.

Automatic Rebar Tying Machine Market Infographic
Purchase Options
  1. 1 ABSCHNITT I: ZUSAMMENFASSUNG UND WICHTIGE HIGHLIGHTS\n\n
    1. 1.1 ZUSAMMENFASSUNG\n \n
      1. 1.1.1 MARKTÜBERSICHT\n \n
      2. 1.1.2 WICHTIGE ERKENNTNISSE\n \n
      3. 1.1.3 MARKTSEGMENTIERUNG\n \n
      4. 1.1.4 WETTBEWERBSLANDSCHAFT\n \n
      5. 1.1.5 HERAUSFORDERUNGEN UND CHANCEN\n \n
      6. 1.1.6 ZUKUNFTSAUSSICHTEN\n2 ABSCHNITT II: ABGRENZUNG, METHODOLOGIE UND MARKTSTRUKTUR\n
    2. 2.1 MARKTEINFÜHRUNG\n \n
      1. 2.1.1 DEFINITION\n \n
      2. 2.1.2 UMFANG DER STUDIE\n \n \n
        1. 2.1.2.1 FORSCHUNGSZIEL\n \n \n
        2. 2.1.2.2 ANNAHMEN\n \n \n
        3. 2.1.2.3 EINSCHRÄNKUNGEN\n
    3. 2.2 FORSCHUNGSMETHODOLOGIE\n \n
      1. 2.2.1 ÜBERBLICK\n \n
      2. 2.2.2 DATENABBAU\n \n
      3. 2.2.3 SEKUNDÄRFORSCHUNG\n \n
      4. 2.2.4 PRIMÄRFORSCHUNG\n \n \n
        1. 2.2.4.1 PROZESS DER PRIMÄRINTERVIEWS UND INFORMATIONSSAMMLUNG\n \n \n
        2. 2.2.4.2 AUFTEILUNG DER PRIMÄRANTWORTGEBER\n \n
      5. 2.2.5 PROGNOSEMODELL\n \n
      6. 2.2.6 MARKTGRÖSSENSCHÄTZUNG\n \n \n
        1. 2.2.6.1 UNTERE ANSATZ\n \n \n
        2. 2.2.6.2 OBERE ANSATZ\n \n
      7. 2.2.7 DATENTRIANGULATION\n \n
      8. 2.2.8 VALIDIERUNG\n3 ABSCHNITT III: QUALITATIVE ANALYSE\n
    4. 3.1 MARKTDYNAMIK\n \n
      1. 3.1.1 ÜBERBLICK\n \n
      2. 3.1.2 TREIBER\n \n
      3. 3.1.3 EINSCHRÄNKUNGEN\n \n
      4. 3.1.4 CHANCEN\n
    5. 3.2 MARKTFACHTANALYSE\n \n
      1. 3.2.1 WERTSCHÖPFUNGSKETTENANALYSE\n \n
      2. 3.2.2 PORTER'S FIVE FORCES ANALYSE\n \n \n
        1. 3.2.2.1 VERHANDLUNGSMACHT DER LIEFERANTEN\n \n \n
        2. 3.2.2.2 VERHANDLUNGSMACHT DER KÄUFER\n \n \n
        3. 3.2.2.3 BEDROHUNG DURCH NEUEINSTEIGER\n \n \n
        4. 3.2.2.4 BEDROHUNG DURCH SUBSTITUTE\n \n \n
        5. 3.2.2.5 INTENSITÄT DES WETTBEWERBS\n \n
      3. 3.2.3 COVID-19 IMPAKTANALYSE\n \n \n
        1. 3.2.3.1 MARKTAUSWIRKUNGSANALYSE\n \n \n
        2. 3.2.3.2 REGIONALE AUSWIRKUNGEN\n \n \n
        3. 3.2.3.3 CHANCEN- UND BEDROHUNGSANALYSE\n4 ABSCHNITT IV: QUANTITATIVE ANALYSE\n
    6. 4.1 INDUSTRIELLE AUTOMATISIERUNG UND AUSRÜSTUNG, NACH ANWENDUNG (MILLIARDEN USD)\n \n
      1. 4.1.1 BAU\n \n
      2. 4.1.2 INFRASTRUKTUR\n \n
      3. 4.1.3 BAUINGENIEURWESEN\n \n
      4. 4.1.4 INDUSTRIELL\n
    7. 4.2 INDUSTRIELLE AUTOMATISIERUNG UND AUSRÜSTUNG, NACH TYP (MILLIARDEN USD)\n \n
      1. 4.2.1 HALBAUTOMATISCH\n \n
      2. 4.2.2 VOLL AUTOMATISCH\n
    8. 4.3 INDUSTRIELLE AUTOMATISIERUNG UND AUSRÜSTUNG, NACH BETRIEBSART (MILLIARDEN USD)\n \n
      1. 4.3.1 ELEKTRISCH\n \n
      2. 4.3.2 PNEUMATISCH\n \n
      3. 4.3.3 HYDRAULISCH\n
    9. 4.4 INDUSTRIELLE AUTOMATISIERUNG UND AUSRÜSTUNG, NACH VERTRIEBSKANAL (MILLIARDEN USD)\n \n
      1. 4.4.1 ONLINE\n \n
      2. 4.4.2 OFFLINE\n
    10. 4.5 INDUSTRIELLE AUTOMATISIERUNG UND AUSRÜSTUNG, NACH REGION (MILLIARDEN USD)\n \n
      1. 4.5.1 NORDAMERIKA\n \n \n
        1. 4.5.1.1 USA\n \n \n
        2. 4.5.1.2 KANADA\n \n
      2. 4.5.2 EUROPA\n \n \n
        1. 4.5.2.1 DEUTSCHLAND\n \n \n
        2. 4.5.2.2 VEREINIGTES KÖNIGREICH\n \n \n
        3. 4.5.2.3 FRANKREICH\n \n \n
        4. 4.5.2.4 RUSSLAND\n \n \n
        5. 4.5.2.5 ITALIEN\n \n \n
        6. 4.5.2.6 SPANIEN\n \n \n
        7. 4.5.2.7 RESTEUROPA\n \n
      3. 4.5.3 APAC\n \n \n
        1. 4.5.3.1 CHINA\n \n \n
        2. 4.5.3.2 INDIEN\n \n \n
        3. 4.5.3.3 JAPAN\n \n \n
        4. 4.5.3.4 SÜDKOREA\n \n \n
        5. 4.5.3.5 MALAYSIA\n \n \n
        6. 4.5.3.6 THAILAND\n \n \n
        7. 4.5.3.7 INDONESIEN\n \n \n
        8. 4.5.3.8 REST APAC\n \n
      4. 4.5.4 SÜDAMERIKA\n \n \n
        1. 4.5.4.1 BRASILIEN\n \n \n
        2. 4.5.4.2 MEXIKO\n \n \n
        3. 4.5.4.3 ARGENTINIEN\n \n \n
        4. 4.5.4.4 REST SÜDAMERIKA\n \n
      5. 4.5.5 MEA\n \n \n
        1. 4.5.5.1 GCC-LÄNDER\n \n \n
        2. 4.5.5.2 SÜDAFRIKA\n \n \n
        3. 4.5.5.3 REST MEA\n5 ABSCHNITT V: WETTBEWERBSANALYSE\n
    11. 5.1 WETTBEWERBSLANDSCHAFT\n \n
      1. 5.1.1 ÜBERBLICK\n \n
      2. 5.1.2 WETTBEWERBSANALYSE\n \n
      3. 5.1.3 MARKTANTEILSANALYSE\n \n
      4. 5.1.4 WICHTIGSTE WACHSTUMSTRATEGIE IM BEREICH INDUSTRIELLE AUTOMATISIERUNG UND AUSRÜSTUNG\n \n
      5. 5.1.5 WETTBEWERBSBENCHMARKING\n \n
      6. 5.1.6 FÜHRENDE UNTERNEHMEN IN BEZUG AUF ANZAHL DER ENTWICKLUNGEN IM BEREICH INDUSTRIELLE AUTOMATISIERUNG UND AUSRÜSTUNG\n \n
      7. 5.1.7 WICHTIGE ENTWICKLUNGEN UND WACHSTUMSTRATEGIEN\n \n \n
        1. 5.1.7.1 NEUE PRODUKTEINFÜHRUNG/SERVICEBEREITSTELLUNG\n \n \n
        2. 5.1.7.2 FUSIONEN & AKQUISITIONEN\n \n \n
        3. 5.1.7.3 GEMEINSAME UNTERNEHMEN\n \n
      8. 5.1.8 WICHTIGE SPIELER FINANZMATRIK\n \n \n
        1. 5.1.8.1 UMSATZ UND BETRIEBSGEWINN\n \n \n
        2. 5.1.8.2 WICHTIGE SPIELER F&E-AUSGABEN. 2023\n
    12. 5.2 UNTERNEHMENSPROFILE\n \n
      1. 5.2.1 HUSQVARNA AB (SE)\n \n \n
        1. 5.2.1.1 FINANZÜBERBLICK\n \n \n
        2. 5.2.1.2 ANGEBOTENE PRODUKTE\n \n \n
        3. 5.2.1.3 WICHTIGE ENTWICKLUNGEN\n \n \n
        4. 5.2.1.4 SWOT-ANALYSE\n \n \n
        5. 5.2.1.5 WICHTIGE STRATEGIEN\n \n
      2. 5.2.2 MAKITA CORPORATION (JP)\n \n \n
        1. 5.2.2.1 FINANZÜBERBLICK\n \n \n
        2. 5.2.2.2 ANGEBOTENE PRODUKTE\n \n \n
        3. 5.2.2.3 WICHTIGE ENTWICKLUNGEN\n \n \n
        4. 5.2.2.4 SWOT-ANALYSE\n \n \n
        5. 5.2.2.5 WICHTIGE STRATEGIEN\n \n
      3. 5.2.3 DEWALT (US)\n \n \n
        1. 5.2.3.1 FINANZÜBERBLICK\n \n \n
        2. 5.2.3.2 ANGEBOTENE PRODUKTE\n \n \n
        3. 5.2.3.3 WICHTIGE ENTWICKLUNGEN\n \n \n
        4. 5.2.3.4 SWOT-ANALYSE\n \n \n
        5. 5.2.3.5 WICHTIGE STRATEGIEN\n \n
      4. 5.2.4 HILTI AG (LI)\n \n \n
        1. 5.2.4.1 FINANZÜBERBLICK\n \n \n
        2. 5.2.4.2 ANGEBOTENE PRODUKTE\n \n \n
        3. 5.2.4.3 WICHTIGE ENTWICKLUNGEN\n \n \n
        4. 5.2.4.4 SWOT-ANALYSE\n \n \n
        5. 5.2.4.5 WICHTIGE STRATEGIEN\n \n
      5. 5.2.5 BOSCH REXROTH AG (DE)\n \n \n
        1. 5.2.5.1 FINANZÜBERBLICK\n \n \n
        2. 5.2.5.2 ANGEBOTENE PRODUKTE\n \n \n
        3. 5.2.5.3 WICHTIGE ENTWICKLUNGEN\n \n \n
        4. 5.2.5.4 SWOT-ANALYSE\n \n \n
        5. 5.2.5.5 WICHTIGE STRATEGIEN\n \n
      6. 5.2.6 KRAFT TOOL COMPANY (US)\n \n \n
        1. 5.2.6.1 FINANZÜBERBLICK\n \n \n
        2. 5.2.6.2 ANGEBOTENE PRODUKTE\n \n \n
        3. 5.2.6.3 WICHTIGE ENTWICKLUNGEN\n \n \n
        4. 5.2.6.4 SWOT-ANALYSE\n \n \n
        5. 5.2.6.5 WICHTIGE STRATEGIEN\n \n
      7. 5.2.7 PROBST GMBH (DE)\n \n \n
        1. 5.2.7.1 FINANZÜBERBLICK\n \n \n
        2. 5.2.7.2 ANGEBOTENE PRODUKTE\n \n \n
        3. 5.2.7.3 WICHTIGE ENTWICKLUNGEN\n \n \n
        4. 5.2.7.4 SWOT-ANALYSE\n \n \n
        5. 5.2.7.5 WICHTIGE STRATEGIEN\n \n
      8. 5.2.8 SENCO BRANDS (US)\n \n \n
        1. 5.2.8.1 FINANZÜBERBLICK\n \n \n
        2. 5.2.8.2 ANGEBOTENE PRODUKTE\n \n \n
        3. 5.2.8.3 WICHTIGE ENTWICKLUNGEN\n \n \n
        4. 5.2.8.4 SWOT-ANALYSE\n \n \n
        5. 5.2.8.5 WICHTIGE STRATEGIEN\n
    13. 5.3 ANHANG\n \n
      1. 5.3.1 QUELLEN\n \n
      2. 5.3.2 VERWANDTE BERICHTE\n6 LISTE DER ABBILDUNGEN\n
    14. 6.1 MARKTSYNOPSIS\n
    15. 6.2 NORDAMERIKA MARKTANALYSE\n
    16. 6.3 USA MARKTANALYSE NACH ANWENDUNG\n
    17. 6.4 USA MARKTANALYSE NACH TYP\n
    18. 6.5 USA MARKTANALYSE NACH BETRIEBSART\n
    19. 6.6 USA MARKTANALYSE NACH VERTRIEBSKANAL\n
    20. 6.7 KANADA MARKTANALYSE NACH ANWENDUNG\n
    21. 6.8 KANADA MARKTANALYSE NACH TYP\n
    22. 6.9 KANADA MARKTANALYSE NACH BETRIEBSART\n
    23. 6.10 KANADA MARKTANALYSE NACH VERTRIEBSKANAL\n
    24. 6.11 EUROPA MARKTANALYSE\n
    25. 6.12 DEUTSCHLAND MARKTANALYSE NACH ANWENDUNG\n
    26. 6.13 DEUTSCHLAND MARKTANALYSE NACH TYP\n
    27. 6.14 DEUTSCHLAND MARKTANALYSE NACH BETRIEBSART\n
    28. 6.15 DEUTSCHLAND MARKTANALYSE NACH VERTRIEBSKANAL\n
    29. 6.16 VEREINIGTES KÖNIGREICH MARKTANALYSE NACH ANWENDUNG\n
    30. 6.17 VEREINIGTES KÖNIGREICH MARKTANALYSE NACH TYP\n
    31. 6.18 VEREINIGTES KÖNIGREICH MARKTANALYSE NACH BETRIEBSART\n
    32. 6.19 VEREINIGTES KÖNIGREICH MARKTANALYSE NACH VERTRIEBSKANAL\n
    33. 6.20 FRANKREICH MARKTANALYSE NACH ANWENDUNG\n
    34. 6.21 FRANKREICH MARKTANALYSE NACH TYP\n
    35. 6.22 FRANKREICH MARKTANALYSE NACH BETRIEBSART\n
    36. 6.23 FRANKREICH MARKTANALYSE NACH VERTRIEBSKANAL\n
    37. 6.24 RUSSLAND MARKTANALYSE NACH ANWENDUNG\n
    38. 6.25 RUSSLAND MARKTANALYSE NACH TYP\n
    39. 6.26 RUSSLAND MARKTANALYSE NACH BETRIEBSART\n
    40. 6.27 RUSSLAND MARKTANALYSE NACH VERTRIEBSKANAL\n
    41. 6.28 ITALIEN MARKTANALYSE NACH ANWENDUNG\n
    42. 6.29 ITALIEN MARKTANALYSE NACH TYP\n
    43. 6.30 ITALIEN MARKTANALYSE NACH BETRIEBSART\n
    44. 6.31 ITALIEN MARKTANALYSE NACH VERTRIEBSKANAL\n
    45. 6.32 SPANIEN MARKTANALYSE NACH ANWENDUNG\n
    46. 6.33 SPANIEN MARKTANALYSE NACH TYP\n
    47. 6.34 SPANIEN MARKTANALYSE NACH BETRIEBSART\n
    48. 6.35 SPANIEN MARKTANALYSE NACH VERTRIEBSKANAL\n
    49. 6.36 RESTEUROPA MARKTANALYSE NACH ANWENDUNG\n
    50. 6.37 RESTEUROPA MARKTANALYSE NACH TYP\n
    51. 6.38 RESTEUROPA MARKTANALYSE NACH BETRIEBSART\n
    52. 6.39 RESTEUROPA MARKTANALYSE NACH VERTRIEBSKANAL\n
    53. 6.40 APAC MARKTANALYSE\n
    54. 6.41 CHINA MARKTANALYSE NACH ANWENDUNG\n
    55. 6.42 CHINA MARKTANALYSE NACH TYP\n
    56. 6.43 CHINA MARKTANALYSE NACH BETRIEBSART\n
    57. 6.44 CHINA MARKTANALYSE NACH VERTRIEBSKANAL\n
    58. 6.45 INDIEN MARKTANALYSE NACH ANWENDUNG\n
    59. 6.46 INDIEN MARKTANALYSE NACH TYP\n
    60. 6.47 INDIEN MARKTANALYSE NACH BETRIEBSART\n
    61. 6.48 INDIEN MARKTANALYSE NACH VERTRIEBSKANAL\n
    62. 6.49 JAPAN MARKTANALYSE NACH ANWENDUNG\n
    63. 6.50 JAPAN MARKTANALYSE NACH TYP\n
    64. 6.51 JAPAN MARKTANALYSE NACH BETRIEBSART\n
    65. 6.52 JAPAN MARKTANALYSE NACH VERTRIEBSKANAL\n
    66. 6.53 SÜDKOREA MARKTANALYSE NACH ANWENDUNG\n
    67. 6.54 SÜDKOREA MARKTANALYSE NACH TYP\n
    68. 6.55 SÜDKOREA MARKTANALYSE NACH BETRIEBSART\n
    69. 6.56 SÜDKOREA MARKTANALYSE NACH VERTRIEBSKANAL\n
    70. 6.57 MALAYSIA MARKTANALYSE NACH ANWENDUNG\n
    71. 6.58 MALAYSIA MARKTANALYSE NACH TYP\n
    72. 6.59 MALAYSIA MARKTANALYSE NACH BETRIEBSART\n
    73. 6.60 MALAYSIA MARKTANALYSE NACH VERTRIEBSKANAL\n
    74. 6.61 THAILAND MARKTANALYSE NACH ANWENDUNG\n
    75. 6.62 THAILAND MARKTANALYSE NACH TYP\n
    76. 6.63 THAILAND MARKTANALYSE NACH BETRIEBSART\n
    77. 6.64 THAILAND MARKTANALYSE NACH VERTRIEBSKANAL\n
    78. 6.65 INDONESIEN MARKTANALYSE NACH ANWENDUNG\n
    79. 6.66 INDONESIEN MARKTANALYSE NACH TYP\n
    80. 6.67 INDONESIEN MARKTANALYSE NACH BETRIEBSART\n
    81. 6.68 INDONESIEN MARKTANALYSE NACH VERTRIEBSKANAL\n
    82. 6.69 REST APAC MARKTANALYSE NACH ANWENDUNG\n
    83. 6.70 REST APAC MARKTANALYSE NACH TYP\n
    84. 6.71 REST APAC MARKTANALYSE NACH BETRIEBSART\n
    85. 6.72 REST APAC MARKTANALYSE NACH VERTRIEBSKANAL\n
    86. 6.73 SÜDAMERIKA MARKTANALYSE\n
    87. 6.74 BRASILIEN MARKTANALYSE NACH ANWENDUNG\n
    88. 6.75 BRASILIEN MARKTANALYSE NACH TYP\n
    89. 6.76 BRASILIEN MARKTANALYSE NACH BETRIEBSART\n
    90. 6.77 BRASILIEN MARKTANALYSE NACH VERTRIEBSKANAL\n
    91. 6.78 MEXIKO MARKTANALYSE NACH ANWENDUNG\n
    92. 6.79 MEXIKO MARKTANALYSE NACH TYP\n
    93. 6.80 MEXIKO MARKTANALYSE NACH BETRIEBSART\n
    94. 6.81 MEXIKO MARKTANALYSE NACH VERTRIEBSKANAL\n
    95. 6.82 ARGENTINIEN MARKTANALYSE NACH ANWENDUNG\n
    96. 6.83 ARGENTINIEN MARKTANALYSE NACH TYP\n
    97. 6.84 ARGENTINIEN MARKTANALYSE NACH BETRIEBSART\n
    98. 6.85 ARGENTINIEN MARKTANALYSE NACH VERTRIEBSKANAL\n
    99. 6.86 REST SÜDAMERIKA MARKTANALYSE NACH ANWENDUNG\n
    100. 6.87 REST SÜDAMERIKA MARKTANALYSE NACH TYP\n
    101. 6.88 REST SÜDAMERIKA MARKTANALYSE NACH BETRIEBSART\n
    102. 6.89 REST SÜDAMERIKA MARKTANALYSE NACH VERTRIEBSKANAL\n
    103. 6.90 MEA MARKTANALYSE\n
    104. 6.91 GCC-LÄNDER MARKTANALYSE NACH ANWENDUNG\n
    105. 6.92 GCC-LÄNDER MARKTANALYSE NACH TYP\n
    106. 6.93 GCC-LÄNDER MARKTANALYSE NACH BETRIEBSART\n
    107. 6.94 GCC-LÄNDER MARKTANALYSE NACH VERTRIEBSKANAL\n
    108. 6.95 SÜDAFRIKA MARKTANALYSE NACH ANWENDUNG\n
    109. 6.96 SÜDAFRIKA MARKTANALYSE NACH TYP\n
    110. 6.97 SÜDAFRIKA MARKTANALYSE NACH BETRIEBSART\n
    111. 6.98 SÜDAFRIKA MARKTANALYSE NACH VERTRIEBSKANAL\n
    112. 6.99 REST MEA MARKTANALYSE NACH ANWENDUNG\n
    113. 6.100 REST MEA MARKTANALYSE NACH TYP\n
    114. 6.101 REST MEA MARKTANALYSE NACH BETRIEBSART\n
    115. 6.102 REST MEA MARKTANALYSE NACH VERTRIEBSKANAL\n
    116. 6.103 WICHTIGE KAUFKRITERIEN FÜR INDUSTRIELLE AUTOMATISIERUNG UND AUSRÜSTUNG\n
    117. 6.104 FORSCHUNGSPROZESS VON MRFR\n
    118. 6.105 DRO-ANALYSE FÜR INDUSTRIELLE AUTOMATISIERUNG UND AUSRÜSTUNG\n
    119. 6.106 TREIBERWIRKUNGSANALYSE: INDUSTRIELLE AUTOMATISIERUNG UND AUSRÜSTUNG\n
    120. 6.107 EINSCHRÄNKUNGENWIRKUNGSANALYSE: INDUSTRIELLE AUTOMATISIERUNG UND AUSRÜSTUNG\n
    121. 6.108 LIEFER-/WERTSCHÖPFUNGSKETTE: INDUSTRIELLE AUTOMATISIERUNG UND AUSRÜSTUNG\n
    122. 6.109 INDUSTRIELLE AUTOMATISIERUNG UND AUSRÜSTUNG, NACH ANWENDUNG, 2024 (% ANTEIL)\n\n
    123. 6.110 INDUSTRIELLE AUTOMATISIERUNG UND AUSRÜSTUNG, NACH ANWENDUNG, 2024 BIS 2035 (MILLIARDEN USD)\n\n
    124. 6.111 INDUSTRIELLE AUTOMATISIERUNG UND AUSRÜSTUNG, NACH TYP, 2024 (% ANTEIL)\n\n
    125. 6.112 INDUSTRIELLE AUTOMATISIERUNG UND AUSRÜSTUNG, NACH TYP, 2024 BIS 2035 (MILLIARDEN USD)\n\n
    126. 6.113 INDUSTRIELLE AUTOMATISIERUNG UND AUSRÜSTUNG, NACH BETRIEBSART, 2024 (% ANTEIL)\n\n
    127. 6.114 INDUSTRIELLE AUTOMATISIERUNG UND AUSRÜSTUNG, NACH BETRIEBSART, 2024 BIS 2035 (MILLIARDEN USD)\n\n
    128. 6.115 INDUSTRIELLE AUTOMATISIERUNG UND AUSRÜSTUNG, NACH VERTRIEBSKANAL, 2024 (% ANTEIL)\n\n
    129. 6.116 INDUSTRIELLE AUTOMATISIERUNG UND AUSRÜSTUNG, NACH VERTRIEBSKANAL, 2024 BIS 2035 (MILLIARDEN USD)\n\n
    130. 6.117 BENCHMARKING DER WICHTIGSTEN WETTBEWERBER\n7 LISTE DER TABELLEN\n
    131. 7.1 LISTE DER ANNAHMEN\n \n
      1. 7.1.1 \n \n
    132. 7.2 NORDAMERIKA MARKTGRÖSSENSCHÄTZUNGEN; PROGNOSE\n \n
      1. 7.2.1 NACH ANWENDUNG, 2025-2035 (MILLIARDEN USD)\n \n
      2. 7.2.2 NACH TYP, 2025-2035 (MILLIARDEN USD)\n \n
      3. 7.2.3 NACH BETRIEBSART, 2025-2035 (MILLIARDEN USD)\n \n
      4. 7.2.4 NACH VERTRIEBSKANAL, 2025-2035 (MILLIARDEN USD)\n
    133. 7.3 USA MARKTGRÖSSENSCHÄTZUNGEN; PROGNOSE\n \n
      1. 7.3.1 NACH ANWENDUNG, 2025-2035 (MILLIARDEN USD)\n \n
      2. 7.3.2 NACH TYP, 2025-2035 (MILLIARDEN USD)\n \n
      3. 7.3.3 NACH BETRIEBSART, 2025-2035 (MILLIARDEN USD)\n \n
      4. 7.3.4 NACH VERTRIEBSKANAL, 2025-2035 (MILLIARDEN USD)\n
    134. 7.4 KANADA MARKTGRÖSSENSCHÄTZUNGEN; PROGNOSE\n \n
      1. 7.4.1 NACH ANWENDUNG, 2025-2035 (MILLIARDEN USD)\n \n
      2. 7.4.2 NACH TYP, 2025-2035 (MILLIARDEN USD)\n \n
      3. 7.4.3 NACH BETRIEBSART, 2025-2035 (MILLIARDEN USD)\n \n
      4. 7.4.4 NACH VERTRIEBSKANAL, 2025-2035 (MILLIARDEN USD)\n
    135. 7.5 EUROPA MARKTGRÖSSENSCHÄTZUNGEN; PROGNOSE\n \n
      1. 7.5.1 NACH ANWENDUNG, 2025-2035 (MILLIARDEN USD)\n \n
      2. 7.5.2 NACH TYP, 2025-2035 (MILLIARDEN USD)\n \n
      3. 7.5.3 NACH BETRIEBSART, 2025-2035 (MILLIARDEN USD)\n \n
      4. 7.5.4 NACH VERTRIEBSKANAL, 2025-2035 (MILLIARDEN USD)\n
    136. 7.6 DEUTSCHLAND MARKTGRÖSSENSCHÄTZUNGEN; PROGNOSE\n \n
      1. 7.6.1 NACH ANWENDUNG, 2025-2035 (MILLIARDEN USD)\n \n
      2. 7.6.2 NACH TYP, 2025-2035 (MILLIARDEN USD)\n \n
      3. 7.6.3 NACH BETRIEBSART, 2025-2035 (MILLIARDEN USD)\n \n
      4. 7.6.4 NACH VERTRIEBSKANAL, 2025-2035 (MILLIARDEN USD)\n
    137. 7.7 VEREINIGTES KÖNIGREICH MARKTGRÖSSENSCHÄTZUNGEN; PROGNOSE\n \n
      1. 7.7.1 NACH ANWENDUNG, 2025-2035 (MILLIARDEN USD)\n \n
      2. 7.7.2 NACH TYP, 2025-2035 (MILLIARDEN USD)\n \n
      3. 7.7.3 NACH BETRIEBSART, 2025-2035 (MILLIARDEN USD)\n \n
      4. 7.7.4 NACH VERTRIEBSKANAL, 2025-2035 (MILLIARDEN USD)\n
    138. 7.8 FRANKREICH MARKTGRÖSSENSCHÄTZUNGEN; PROGNOSE\n \n
      1. 7.8.1 NACH ANWENDUNG, 2025-2035 (MILLIARDEN USD)\n \n
      2. 7.8.2 NACH TYP, 2025-2035 (MILLIARDEN USD)\n \n
      3. 7.8.3 NACH BETRIEBSART, 2025-2035 (MILLIARDEN USD)\n \n
      4. 7.8.4 NACH VERTRIEBSKANAL, 2025-2035 (MILLIARDEN USD)\n
    139. 7.9 RUSSLAND MARKTGRÖSSENSCHÄTZUNGEN; PROGNOSE\n \n
      1. 7.9.1 NACH ANWENDUNG, 2025-2035 (MILLIARDEN USD)\n \n
      2. 7.9.2 NACH TYP, 2025-2035 (MILLIARDEN USD)\n \n
      3. 7.9.3 NACH BETRIEBSART, 2025-2035 (MILLIARDEN USD)\n \n
      4. 7.9.4 NACH VERTRIEBSKANAL, 2025-2035 (MILLIARDEN USD)\n
    140. 7.10 ITALIEN MARKTGRÖSSENSCHÄTZUNGEN; PROGNOSE\n \n
      1. 7.10.1 NACH ANWENDUNG, 2025-2035 (MILLIARDEN USD)\n \n
      2. 7.10.2 NACH TYP, 2025-2035 (MILLIARDEN USD)\n \n
      3. 7.10.3 NACH BETRIEBSART, 2025-2035 (MILLIARDEN USD)\n \n
      4. 7.10.4 NACH VERTRIEBSKANAL, 2025-2035 (MILLIARDEN USD)\n
    141. 7.11 SPANIEN MARKTGRÖSSENSCHÄTZUNGEN; PROGNOSE\n \n
      1. 7.11.1 NACH ANWENDUNG, 2025-2035 (MILLIARDEN USD)\n \n
      2. 7.11.2 NACH TYP, 2025-2035 (MILLIARDEN USD)\n \n
      3. 7.11.3 NACH BETRIEBSART, 2025-2035 (MILLIARDEN USD)\n \n
      4. 7.11.4 NACH VERTRIEBSKANAL, 2025-2035 (MILLIARDEN USD)\n
    142. 7.12 RESTEUROPA MARKTGRÖSSENSCHÄTZUNGEN; PROGNOSE\n \n
      1. 7.12.1 NACH ANWENDUNG, 2025-2035 (MILLIARDEN USD)\n \n
      2. 7.12.2 NACH TYP, 2025-2035 (MILLIARDEN USD)\n \n
      3. 7.12.3 NACH BETRIEBSART, 2025-2035 (MILLIARDEN USD)\n \n
      4. 7.12.4 NACH VERTRIEBSKANAL, 2025-2035 (MILLIARDEN USD)\n
    143. 7.13 APAC MARKTGRÖSSENSCHÄTZUNGEN; PROGNOSE\n \n
      1. 7.13.1 NACH ANWENDUNG, 2025-2035 (MILLIARDEN USD)\n \n
      2. 7.13.2 NACH TYP, 2025-2035 (MILLIARDEN USD)\n \n
      3. 7.13.3 NACH BETRIEBSART, 2025-2035 (MILLIARDEN USD)\n \n
      4. 7.13.4 NACH VERTRIEBSKANAL, 2025-2035 (MILLIARDEN USD)\n
    144. 7.14 CHINA MARKTGRÖSSENSCHÄTZUNGEN; PROGNOSE\n \n
      1. 7.14.1 NACH ANWENDUNG, 2025-2035 (MILLIARDEN USD)\n \n
      2. 7.14.2 NACH TYP, 2025-2035 (MILLIARDEN USD)\n \n
      3. 7.14.3 NACH BETRIEBSART, 2025-2035 (MILLIARDEN USD)\n \n
      4. 7.14.4 NACH VERTRIEBSKANAL, 2025-2035 (MILLIARDEN USD)\n
    145. 7.15 INDIEN MARKTGRÖSSENSCHÄTZUNGEN; PROGNOSE\n \n
      1. 7.15.1 NACH ANWENDUNG, 2025-2035 (MILLIARDEN USD)\n \n
      2. 7.15.2 NACH TYP, 2025-2035 (MILLIARDEN USD)\n \n
      3. 7.15.3 NACH BETRIEBSART, 2025-2035 (MILLIARDEN USD)\n \n
      4. 7.15.4 NACH VERTRIEBSKANAL, 2025-2035 (MILLIARDEN USD)\n
    146. 7.16 JAPAN MARKTGRÖSSENSCHÄTZUNGEN; PROGNOSE\n \n
      1. 7.16.1 NACH ANWENDUNG, 2025-2035 (MILLIARDEN USD)\n \n
      2. 7.16.2 NACH TYP, 2025-2035 (MILLIARDEN USD)\n \n
      3. 7.16.3 NACH BETRIEBSART, 2025-2035 (MILLIARDEN USD)\n \n
      4. 7.16.4 NACH VERTRIEBSKANAL, 2025-2035 (MILLIARDEN USD)\n
    147. 7.17 SÜDKOREA MARKTGRÖSSENSCHÄTZUNGEN; PROGNOSE\n \n
      1. 7.17.1 NACH ANWENDUNG, 2025-2035 (MILLIARDEN USD)\n \n
      2. 7.17.2 NACH TYP, 2025-2035 (MILLIARDEN USD)\n \n
      3. 7.17.3 NACH BETRIEBSART, 2025-2035 (MILLIARDEN USD)\n \n
      4. 7.17.4 NACH VERTRIEBSKANAL, 2025-2035 (MILLIARDEN USD)\n
    148. 7.18 MALAYSIA MARKTGRÖSSENSCHÄTZUNGEN; PROGNOSE\n \n
      1. 7.18.1 NACH ANWENDUNG, 2025-2035 (MILLIARDEN USD)\n \n
      2. 7.18.2 NACH TYP, 2025-2035 (MILLIARDEN USD)\n \n
      3. 7.18.3 NACH BETRIEBSART, 2025-2035 (MILLIARDEN USD)\n \n
      4. 7.18.4 NACH VERTRIEBSKANAL, 2025-2035 (MILLIARDEN USD)\n
    149. 7.19 THAILAND MARKTGRÖSSENSCHÄTZUNGEN; PROGNOSE\n \n
      1. 7.19.1 NACH ANWENDUNG, 2025-2035 (MILLIARDEN USD)\n \n
      2. 7.19.2 NACH TYP, 2025-2035 (MILLIARDEN USD)\n \n
      3. 7.19.3 NACH BETRIEBSART, 2025-2035 (MILLIARDEN USD)\n \n
      4. 7.19.4 NACH VERTRIEBSKANAL, 2025-2035 (MILLIARDEN USD)\n
    150. 7.20 INDONESIEN MARKTGRÖSSENSCHÄTZUNGEN; PROGNOSE\n \n
      1. 7.20.1 NACH ANWENDUNG, 2025-2035 (MILLIARDEN USD)\n \n
      2. 7.20.2 NACH TYP, 2025-2035 (MILLIARDEN USD)\n \n
      3. 7.20.3 NACH BETRIEBSART, 2025-2035 (MILLIARDEN USD)\n \n
      4. 7.20.4 NACH VERTRIEBSKANAL, 2025-2035 (MILLIARDEN USD)\n
    151. 7.21 REST APAC MARKTGRÖSSENSCHÄTZUNGEN; PROGNOSE\n \n
      1. 7.21.1 NACH ANWENDUNG, 2025-2035 (MILLIARDEN USD)\n \n
      2. 7.21.2 NACH TYP, 2025-2035 (MILLIARDEN USD)\n \n
      3. 7.21.3 NACH BETRIEBSART, 2025-2035 (MILLIARDEN USD)\n \n
      4. 7.21.4 NACH VERTRIEBSKANAL, 2025-2035 (MILLIARDEN USD)\n
    152. 7.22 SÜDAMERIKA MARKTGRÖSSENSCHÄTZUNGEN; PROGNOSE\n \n
      1. 7.22.1 NACH ANWENDUNG, 2025-2035 (MILLIARDEN USD)\n \n
      2. 7.22.2 NACH TYP, 2025-2035 (MILLIARDEN USD)\n \n
      3. 7.22.3 NACH BETRIEBSART, 2025-2035 (MILLIARDEN USD)\n \n
      4. 7.22.4 NACH VERTRIEBSKANAL, 2025-2035 (MILLIARDEN USD)\n
    153. 7.23 BRASILIEN MARKTGRÖSSENSCHÄTZUNGEN; PROGNOSE\n \n
      1. 7.23.1 NACH ANWENDUNG, 2025-2035 (MILLIARDEN USD)\n \n
      2. 7.23.2 NACH TYP, 2025-2035 (MILLIARDEN USD)\n \n
      3. 7.23.3 NACH BETRIEBSART, 2025-2035 (MILLIARDEN USD)\n \n
      4. 7.23.4 NACH VERTRIEBSKANAL, 2025-2035 (MILLIARDEN USD)\n
    154. 7.24 MEXIKO MARKTGRÖSSENSCHÄTZUNGEN; PROGNOSE\n \n
      1. 7.24.1 NACH ANWENDUNG, 2025-2035 (MILLIARDEN USD)\n \n
      2. 7.24.2 NACH TYP, 2025-2035 (MILLIARDEN USD)\n \n
      3. 7.24.3 NACH BETRIEBSART, 2025-2035 (MILLIARDEN USD)\n \n
      4. 7.24.4 NACH VERTRIEBSKANAL, 2025-2035 (MILLIARDEN USD)\n
    155. 7.25 ARGENTINIEN MARKTGRÖSSENSCHÄTZUNGEN; PROGNOSE\n \n
      1. 7.25.1 NACH ANWENDUNG, 2025-2035 (MILLIARDEN USD)\n \n
      2. 7.25.2 NACH TYP, 2025-2035 (MILLIARDEN USD)\n \n
      3. 7.25.3 NACH BETRIEBSART, 2025-2035 (MILLIARDEN USD)\n \n
      4. 7.25.4 NACH VERTRIEBSKANAL, 2025-2035 (MILLIARDEN USD)\n
    156. 7.26 REST SÜDAMERIKA MARKTGRÖSSENSCHÄTZUNGEN; PROGNOSE\n \n
      1. 7.26.1 NACH ANWENDUNG, 2025-2035 (MILLIARDEN USD)\n \n
      2. 7.26.2 NACH TYP, 2025-2035 (MILLIARDEN USD)\n \n
      3. 7.26.3 NACH BETRIEBSART, 2025-2035 (MILLIARDEN USD)\n \n
      4. 7.26.4 NACH VERTRIEBSKANAL, 2025-2035 (MILLIARDEN USD)\n
    157. 7.27 MEA MARKTGRÖSSENSCHÄTZUNGEN; PROGNOSE\n \n
      1. 7.27.1 NACH ANWENDUNG, 2025-2035 (MILLIARDEN USD)\n \n
      2. 7.27.2 NACH TYP, 2025-2035 (MILLIARDEN USD)\n \n
      3. 7.27.3 NACH BETRIEBSART, 2025-2035 (MILLIARDEN USD)\n \n
      4. 7.27.4 NACH VERTRIEBSKANAL, 2025-2035 (MILLIARDEN USD)\n
    158. 7.28 GCC-LÄNDER MARKTGRÖSSENSCHÄTZUNGEN; PROGNOSE\n \n
      1. 7.28.1 NACH ANWENDUNG, 2025-2035 (MILLIARDEN USD)\n \n
      2. 7.28.2 NACH TYP, 2025-2035 (MILLIARDEN USD)\n \n
      3. 7.28.3 NACH BETRIEBSART, 2025-2035 (MILLIARDEN USD)\n \n
      4. 7.28.4 NACH VERTRIEBSKANAL, 2025-2035 (MILLIARDEN USD)\n
    159. 7.29 SÜDAFRIKA MARKTGRÖSSENSCHÄTZUNGEN; PROGNOSE\n \n
      1. 7.29.1 NACH ANWENDUNG, 2025-2035 (MILLIARDEN USD)\n \n
      2. 7.29.2 NACH TYP, 2025-2035 (MILLIARDEN USD)\n \n
      3. 7.29.3 NACH BETRIEBSART, 2025-2035 (MILLIARDEN USD)\n \n
      4. 7.29.4 NACH VERTRIEBSKANAL, 2025-2035 (MILLIARDEN USD)\n
    160. 7.30 REST MEA MARKTGRÖSSENSCHÄTZUNGEN; PROGNOSE\n \n
      1. 7.30.1 NACH ANWENDUNG, 2025-2035 (MILLIARDEN USD)\n \n
      2. 7.30.2 NACH TYP, 2025-2035 (MILLIARDEN USD)\n \n
      3. 7.30.3 NACH BETRIEBSART, 2025-2035 (MILLIARDEN USD)\n \n
      4. 7.30.4 NACH VERTRIEBSKANAL, 2025-2035 (MILLIARDEN USD)\n
    161. 7.31 PRODUKTEINFÜHRUNG/PRODUKTENTWICKLUNG/GENEHMIGUNG\n \n
      1. 7.31.1 \n \n
    162. 7.32 AKQUISITION/PARTNERSCHAFT\n \n

Marktsegmentierung der automatischen Bewehrungsbindemaschine

  • Markt für automatische Bewehrungsbindemaschinen nach Anwendung (Milliarden USD, 2019-2032)
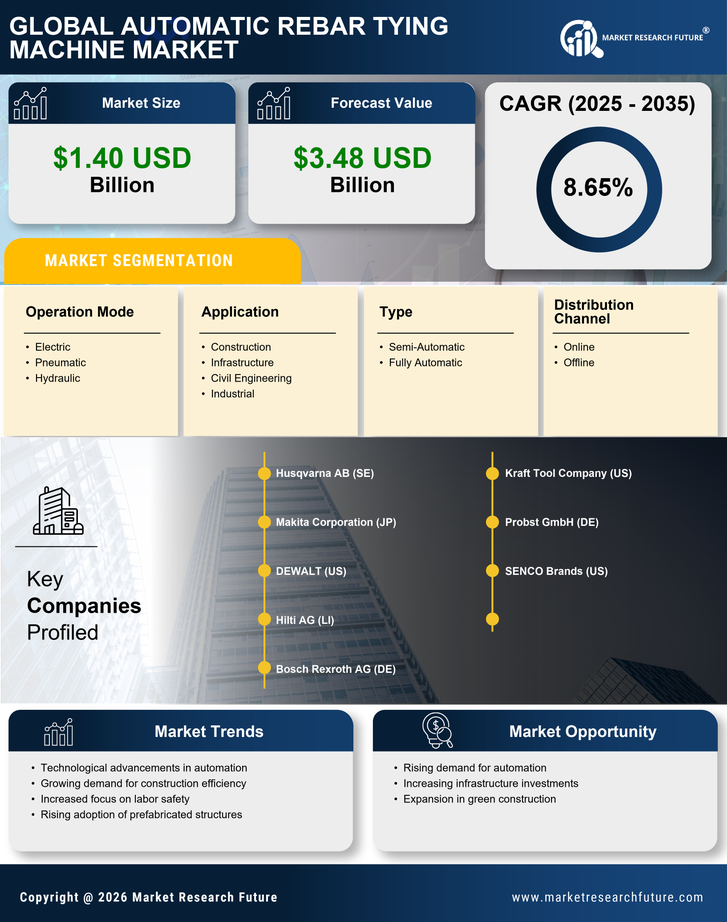
    • Bau

    • Infrastruktur

    • Bauingenieurwesen

    • Industrie

  • Markt für automatische Bewehrungsbindemaschinen nach Typ (Milliarden USD, 2019-2032)

    • Halbautomatisch

    • Vollautomatisch

  • Markt für automatische Bewehrungsbindemaschinen nach Betriebsmodus (Milliarden USD, 2019-2032)

    • Elektrisch

    • Pneumatisch

    • Hydraulisch

  • Markt für automatische Bewehrungsbindemaschinen nach Vertriebskanal (Milliarden USD, 2019-2032)

    • Online

    • Offline

  • Markt für automatische Bewehrungsbindemaschinen nach Region (Milliarden USD, 2019-2032)

    • Nordamerika

    • Europa

    • Südamerika

    • Asien-Pazifik

    • Mittlerer Osten und Afrika

Regionale Perspektive des Marktes für automatische Bewehrungsbindemaschinen (Milliarden USD, 2019-2032)

  • Perspektive Nordamerika (Milliarden USD, 2019-2032)

    • Markt für automatische Bewehrungsbindemaschinen in Nordamerika nach Anwendungstyp

      • Bau

      • Infrastruktur

      • Bauingenieurwesen

      • Industrie

    • Markt für automatische Bewehrungsbindemaschinen in Nordamerika nach Typ

      • Halbautomatisch

      • Vollautomatisch

    • Markt für automatische Bewehrungsbindemaschinen in Nordamerika nach Betriebsmodus

      • Elektrisch

      • Pneumatisch

      • Hydraulisch

    • Markt für automatische Bewehrungsbindemaschinen in Nordamerika nach Vertriebskanal

      • Online

      • Offline

    • Markt für automatische Bewehrungsbindemaschinen in Nordamerika nach regionalem Typ

      • USA

      • Kanada

    • Perspektive USA (Milliarden USD, 2019-2032)

    • Markt für automatische Bewehrungsbindemaschinen in den USA nach Anwendungstyp

      • Bau

      • Infrastruktur

      • Bauingenieurwesen

      • Industrie

    • Markt für automatische Bewehrungsbindemaschinen in den USA nach Typ

      • Halbautomatisch

      • Vollautomatisch

    • Markt für automatische Bewehrungsbindemaschinen in den USA nach Betriebsmodus

      • Elektrisch

      • Pneumatisch

      • Hydraulisch

    • Markt für automatische Bewehrungsbindemaschinen in den USA nach Vertriebskanal

      • Online

      • Offline

    • Perspektive KANADA (Milliarden USD, 2019-2032)

    • Markt für automatische Bewehrungsbindemaschinen in KANADA nach Anwendungstyp

      • Bau

      • Infrastruktur

      • Bauingenieurwesen

      • Industrie

    • Markt für automatische Bewehrungsbindemaschinen in KANADA nach Typ

      • Halbautomatisch

      • Vollautomatisch

    • Markt für automatische Bewehrungsbindemaschinen in KANADA nach Betriebsmodus

      • Elektrisch

      • Pneumatisch

      • Hydraulisch

    • Markt für automatische Bewehrungsbindemaschinen in KANADA nach Vertriebskanal

      • Online

      • Offline

  • Perspektive Europa (Milliarden USD, 2019-2032)

    • Markt für automatische Bewehrungsbindemaschinen in Europa nach Anwendungstyp

      • Bau

      • Infrastruktur

      • Bauingenieurwesen

      • Industrie

    • Markt für automatische Bewehrungsbindemaschinen in Europa nach Typ

      • Halbautomatisch

      • Vollautomatisch

    • Markt für automatische Bewehrungsbindemaschinen in Europa nach Betriebsmodus

      • Elektrisch

      • Pneumatisch

      • Hydraulisch

    • Markt für automatische Bewehrungsbindemaschinen in Europa nach Vertriebskanal

      • Online

      • Offline

    • Markt für automatische Bewehrungsbindemaschinen in Europa nach regionalem Typ

      • Deutschland

      • Vereinigtes Königreich

      • Frankreich

      • Russland

      • Italien

      • Spanien

      • Rest von Europa

    • Perspektive DEUTSCHLAND (Milliarden USD, 2019-2032)

    • Markt für automatische Bewehrungsbindemaschinen in DEUTSCHLAND nach Anwendungstyp

      • Bau

      • Infrastruktur

      • Bauingenieurwesen

      • Industrie

    • Markt für automatische Bewehrungsbindemaschinen in DEUTSCHLAND nach Typ

      • Halbautomatisch

      • Vollautomatisch

    • Markt für automatische Bewehrungsbindemaschinen in DEUTSCHLAND nach Betriebsmodus

      • Elektrisch

      • Pneumatisch

      • Hydraulisch

    • Markt für automatische Bewehrungsbindemaschinen in DEUTSCHLAND nach Vertriebskanal

      • Online

      • Offline

    • Perspektive VEREINIGTES KÖNIGREICH (Milliarden USD, 2019-2032)

    • Markt für automatische Bewehrungsbindemaschinen im VEREINIGTEN KÖNIGREICH nach Anwendungstyp

      • Bau

      • Infrastruktur

      • Bauingenieurwesen

      • Industrie

    • Markt für automatische Bewehrungsbindemaschinen im VEREINIGTEN KÖNIGREICH nach Typ

      • Halbautomatisch

      • Vollautomatisch

    • Markt für automatische Bewehrungsbindemaschinen im VEREINIGTEN KÖNIGREICH nach Betriebsmodus

      • Elektrisch

      • Pneumatisch

      • Hydraulisch

    • Markt für automatische Bewehrungsbindemaschinen im VEREINIGTEN KÖNIGREICH nach Vertriebskanal

      • Online

      • Offline

    • Perspektive FRANKREICH (Milliarden USD, 2019-2032)

    • Markt für automatische Bewehrungsbindemaschinen in FRANKREICH nach Anwendungstyp

      • Bau

      • Infrastruktur

      • Bauingenieurwesen

      • Industrie

    • Markt für automatische Bewehrungsbindemaschinen in FRANKREICH nach Typ

      • Halbautomatisch

      • Vollautomatisch

    • Markt für automatische Bewehrungsbindemaschinen in FRANKREICH nach Betriebsmodus

      • Elektrisch

      • Pneumatisch

      • Hydraulisch

    • Markt für automatische Bewehrungsbindemaschinen in FRANKREICH nach Vertriebskanal

      • Online

      • Offline

    • Perspektive RUSSLAND (Milliarden USD, 2019-2032)

    • Markt für automatische Bewehrungsbindemaschinen in RUSSLAND nach Anwendungstyp

      • Bau

      • Infrastruktur

      • Bauingenieurwesen

      • Industrie

    • Markt für automatische Bewehrungsbindemaschinen in RUSSLAND nach Typ

      • Halbautomatisch

      • Vollautomatisch

    • Markt für automatische Bewehrungsbindemaschinen in RUSSLAND nach Betriebsmodus

      • Elektrisch

      • Pneumatisch

      • Hydraulisch

    • Markt für automatische Bewehrungsbindemaschinen in RUSSLAND nach Vertriebskanal

      • Online

      • Offline

    • Perspektive ITALIEN (Milliarden USD, 2019-2032)

    • Markt für automatische Bewehrungsbindemaschinen in ITALIEN nach Anwendungstyp

      • Bau

      • Infrastruktur

      • Bauingenieurwesen

      • Industrie

    • Markt für automatische Bewehrungsbindemaschinen in ITALIEN nach Typ

      • Halbautomatisch

      • Vollautomatisch

    • Markt für automatische Bewehrungsbindemaschinen in ITALIEN nach Betriebsmodus

      • Elektrisch

      • Pneumatisch

      • Hydraulisch

    • Markt für automatische Bewehrungsbindemaschinen in ITALIEN nach Vertriebskanal

      • Online

      • Offline

    • Perspektive SPANIEN (Milliarden USD, 2019-2032)

    • Markt für automatische Bewehrungsbindemaschinen in SPANIEN nach Anwendungstyp

      • Bau

      • Infrastruktur

      • Bauingenieurwesen

      • Industrie

    • Markt für automatische Bewehrungsbindemaschinen in SPANIEN nach Typ

      • Halbautomatisch

      • Vollautomatisch

    • Markt für automatische Bewehrungsbindemaschinen in SPANIEN nach Betriebsmodus

      • Elektrisch

      • Pneumatisch

      • Hydraulisch

    • Markt für automatische Bewehrungsbindemaschinen in SPANIEN nach Vertriebskanal

      • Online

      • Offline

    • Perspektive REST VON EUROPA (Milliarden USD, 2019-2032)

    • Markt für automatische Bewehrungsbindemaschinen im REST VON EUROPA nach Anwendungstyp

      • Bau

      • Infrastruktur

      • Bauingenieurwesen

      • Industrie

    • Markt für automatische Bewehrungsbindemaschinen im REST VON EUROPA nach Typ

      • Halbautomatisch

      • Vollautomatisch

    • Markt für automatische Bewehrungsbindemaschinen im REST VON EUROPA nach Betriebsmodus

      • Elektrisch

      • Pneumatisch

      • Hydraulisch

    • Markt für automatische Bewehrungsbindemaschinen im REST VON EUROPA nach Vertriebskanal

      • Online

      • Offline

  • Perspektive APAC (Milliarden USD, 2019-2032)

    • Markt für automatische Bewehrungsbindemaschinen in APAC nach Anwendungstyp

      • Bau

      • Infrastruktur

      • Bauingenieurwesen

      • Industrie

    • Markt für automatische Bewehrungsbindemaschinen in APAC nach Typ

      • Halbautomatisch

      • Vollautomatisch

    • Markt für automatische Bewehrungsbindemaschinen in APAC nach Betriebsmodus

      • Elektrisch

      • Pneumatisch

      • Hydraulisch

    • Markt für automatische Bewehrungsbindemaschinen in APAC nach Vertriebskanal

      • Online

      • Offline

    • Markt für automatische Bewehrungsbindemaschinen in APAC nach regionalem Typ

      • China

      • Indien

      • Japan

      • Südkorea

      • Malaysia

      • Thailand

      • Indonesien

      • Rest von APAC

    • Perspektive CHINA (Milliarden USD, 2019-2032)

    • Markt für automatische Bewehrungsbindemaschinen in CHINA nach Anwendungstyp

      • Bau

      • Infrastruktur

      • Bauingenieurwesen

      • Industrie

    • Markt für automatische Bewehrungsbindemaschinen in CHINA nach Typ

      • Halbautomatisch

      • Vollautomatisch

    • Markt für automatische Bewehrungsbindemaschinen in CHINA nach Betriebsmodus

      • Elektrisch

      • Pneumatisch

      • Hydraulisch

    • Markt für automatische Bewehrungsbindemaschinen in CHINA nach Vertriebskanal

      • Online

      • Offline

    • Perspektive INDIEN (Milliarden USD, 2019-2032)

    • Markt für automatische Bewehrungsbindemaschinen in INDIEN nach Anwendungstyp

      • Bau

      • Infrastruktur

      • Bauingenieurwesen

      • Industrie

    • Markt für automatische Bewehrungsbindemaschinen in INDIEN nach Typ

      • Halbautomatisch

      • Vollautomatisch

    • Markt für automatische Bewehrungsbindemaschinen in INDIEN nach Betriebsmodus

      • Elektrisch

      • Pneumatisch

      • Hydraulisch

    • Markt für automatische Bewehrungsbindemaschinen in INDIEN nach Vertriebskanal

      • Online

      • Offline

    • Perspektive JAPAN (Milliarden USD, 2019-2032)

    • Markt für automatische Bewehrungsbindemaschinen in JAPAN nach Anwendungstyp

      • Bau

      • Infrastruktur

      • Bauingenieurwesen

      • Industrie

    • Markt für automatische Bewehrungsbindemaschinen in JAPAN nach Typ

      • Halbautomatisch

      • Vollautomatisch

    • Markt für automatische Bewehrungsbindemaschinen in JAPAN nach Betriebsmodus

      • Elektrisch

      • Pneumatisch

      • Hydraulisch

    • Markt für automatische Bewehrungsbindemaschinen in JAPAN nach Vertriebskanal

      • Online

      • Offline

    • Perspektive SÜDKOREA (Milliarden USD, 2019-2032)

    • Markt für automatische Bewehrungsbindemaschinen in SÜDKOREA nach Anwendungstyp

      • Bau

      • Infrastruktur

      • Bauingenieurwesen

      • Industrie

    • Markt für automatische Bewehrungsbindemaschinen in SÜDKOREA nach Typ

      • Halbautomatisch

      • Vollautomatisch

    • Markt für automatische Bewehrungsbindemaschinen in SÜDKOREA nach Betriebsmodus

      • Elektrisch

      • Pneumatisch

      • Hydraulisch

    • Markt für automatische Bewehrungsbindemaschinen in SÜDKOREA nach Vertriebskanal

      • Online

      • Offline

    • Perspektive MALAYSIA (Milliarden USD, 2019-2032)

    • Markt für automatische Bewehrungsbindemaschinen in MALAYSIA nach Anwendungstyp

      • Bau

      • Infrastruktur

      • Bauingenieurwesen

      • Industrie

    • Markt für automatische Bewehrungsbindemaschinen in MALAYSIA nach Typ

      • Halbautomatisch

      • Vollautomatisch

    • Markt für automatische Bewehrungsbindemaschinen in MALAYSIA nach Betriebsmodus

      • Elektrisch

      • Pneumatisch

      • Hydraulisch

    • Markt für automatische Bewehrungsbindemaschinen in MALAYSIA nach Vertriebskanal

      • Online

      • Offline

    • Perspektive THAILAND (Milliarden USD, 2019-2032)

    • Markt für automatische Bewehrungsbindemaschinen in THAILAND nach Anwendungstyp

      • Bau

      • Infrastruktur

      • Bauingenieurwesen

      • Industrie

    • Markt für automatische Bewehrungsbindemaschinen in THAILAND nach Typ

      • Halbautomatisch

      • Vollautomatisch

    • Markt für automatische Bewehrungsbindemaschinen in THAILAND nach Betriebsmodus

      • Elektrisch

      • Pneumatisch

      • Hydraulisch

    • Markt für automatische Bewehrungsbindemaschinen in THAILAND nach Vertriebskanal

      • Online

      • Offline

    • Perspektive INDONESIEN (Milliarden USD, 2019-2032)

    • Markt für automatische Bewehrungsbindemaschinen in INDONESIEN nach Anwendungstyp

      • Bau

      • Infrastruktur

      • Bauingenieurwesen

      • Industrie

    • Markt für automatische Bewehrungsbindemaschinen in INDONESIEN nach Typ

      • Halbautomatisch

      • Vollautomatisch

    • Markt für automatische Bewehrungsbindemaschinen in INDONESIEN nach Betriebsmodus

      • Elektrisch

      • Pneumatisch

      • Hydraulisch

    • Markt für automatische Bewehrungsbindemaschinen in INDONESIEN nach Vertriebskanal

      • Online

      • Offline

    • Perspektive REST VON APAC (Milliarden USD, 2019-2032)

    • Markt für automatische Bewehrungsbindemaschinen im REST VON APAC nach Anwendungstyp

      • Bau

      • Infrastruktur

      • Bauingenieurwesen

      • Industrie

    • Markt für automatische Bewehrungsbindemaschinen im REST VON APAC nach Typ

      • Halbautomatisch

      • Vollautomatisch

    • Markt für automatische Bewehrungsbindemaschinen im REST VON APAC nach Betriebsmodus

      • Elektrisch

      • Pneumatisch

      • Hydraulisch

    • Markt für automatische Bewehrungsbindemaschinen im REST VON APAC nach Vertriebskanal

      • Online

      • Offline

  • Perspektive Südamerika (Milliarden USD, 2019-2032)

    • Markt für automatische Bewehrungsbindemaschinen in Südamerika nach Anwendungstyp

      • Bau

      • Infrastruktur

      • Bauingenieurwesen

      • Industrie

    • Markt für automatische Bewehrungsbindemaschinen in Südamerika nach Typ

      • Halbautomatisch

      • Vollautomatisch

    • Markt für automatische Bewehrungsbindemaschinen in Südamerika nach Betriebsmodus

      • Elektrisch

      • Pneumatisch

      • Hydraulisch

    • Markt für automatische Bewehrungsbindemaschinen in Südamerika nach Vertriebskanal

      • Online

      • Offline

    • Markt für automatische Bewehrungsbindemaschinen in Südamerika nach regionalem Typ

      • Brasilien

      • Mexiko

      • Argentinien

      • Rest von Südamerika

    • Perspektive BRASILIEN (Milliarden USD, 2019-2032)

    • Markt für automatische Bewehrungsbindemaschinen in BRASILIEN nach Anwendungstyp

      • Bau

      • Infrastruktur

      • Bauingenieurwesen

      • Industrie

    • Markt für automatische Bewehrungsbindemaschinen in BRASILIEN nach Typ

      • Halbautomatisch

      • Vollautomatisch

    • Markt für automatische Bewehrungsbindemaschinen in BRASILIEN nach Betriebsmodus

      • Elektrisch

      • Pneumatisch

      • Hydraulisch

    • Markt für automatische Bewehrungsbindemaschinen in BRASILIEN nach Vertriebskanal

      • Online

      • Offline

    • Perspektive MEXIKO (Milliarden USD, 2019-2032)

    • Markt für automatische Bewehrungsbindemaschinen in MEXIKO nach Anwendungstyp

      • Bau

      • Infrastruktur

      • Bauingenieurwesen

      • Industrie

    • Markt für automatische Bewehrungsbindemaschinen in MEXIKO nach Typ

      • Halbautomatisch

      • Vollautomatisch

    • Markt für automatische Bewehrungsbindemaschinen in MEXIKO nach Betriebsmodus

      • Elektrisch

      • Pneumatisch

      • Hydraulisch

    • Markt für automatische Bewehrungsbindemaschinen in MEXIKO nach Vertriebskanal

      • Online

      • Offline

    • Perspektive ARGENTINIEN (Milliarden USD, 2019-2032)

    • Markt für automatische Bewehrungsbindemaschinen in ARGENTINIEN nach Anwendungstyp

      • Bau

      • Infrastruktur

      • Bauingenieurwesen

      • Industrie

    • Markt für automatische Bewehrungsbindemaschinen in ARGENTINIEN nach Typ

      • Halbautomatisch

      • Vollautomatisch

    • Markt für automatische Bewehrungsbindemaschinen in ARGENTINIEN nach Betriebsmodus

      • Elektrisch

      • Pneumatisch

      • Hydraulisch

    • Markt für automatische Bewehrungsbindemaschinen in ARGENTINIEN nach Vertriebskanal

      • Online

      • Offline

    • Perspektive REST VON SÜDAMERIKA (Milliarden USD, 2019-2032)

    • Markt für automatische Bewehrungsbindemaschinen im REST VON SÜDAMERIKA nach Anwendungstyp

      • Bau

      • Infrastruktur

      • Bauingenieurwesen

      • Industrie

    • Markt für automatische Bewehrungsbindemaschinen im REST VON SÜDAMERIKA nach Typ

      • Halbautomatisch

      • Vollautomatisch

    • Markt für automatische Bewehrungsbindemaschinen im REST VON SÜDAMERIKA nach Betriebsmodus

      • Elektrisch

      • Pneumatisch

      • Hydraulisch

    • Markt für automatische Bewehrungsbindemaschinen im REST VON SÜDAMERIKA nach Vertriebskanal

      • Online

      • Offline

  • Perspektive MEA (Milliarden USD, 2019-2032)

    • Markt für automatische Bewehrungsbindemaschinen in MEA nach Anwendungstyp

      • Bau

      • Infrastruktur

      • Bauingenieurwesen

      • Industrie

    • Markt für automatische Bewehrungsbindemaschinen in MEA nach Typ

      • Halbautomatisch

      • Vollautomatisch

    • Markt für automatische Bewehrungsbindemaschinen in MEA nach Betriebsmodus

      • Elektrisch

      • Pneumatisch

      • Hydraulisch

    • Markt für automatische Bewehrungsbindemaschinen in MEA nach Vertriebskanal

      • Online

      • Offline

    • Markt für automatische Bewehrungsbindemaschinen in MEA nach regionalem Typ

      • GCC-Länder

      • Südafrika

      • Rest von MEA

    • Perspektive GCC-LÄNDER (Milliarden USD, 2019-2032)

    • Markt für automatische Bewehrungsbindemaschinen in GCC-LÄNDERN nach Anwendungstyp

      • Bau

      • Infrastruktur

      • Bauingenieurwesen

      • Industrie

    • Markt für automatische Bewehrungsbindemaschinen in GCC-LÄNDERN nach Typ

      • Halbautomatisch

      • Vollautomatisch

    • Markt für automatische Bewehrungsbindemaschinen in GCC-LÄNDERN nach Betriebsmodus

      • Elektrisch

      • Pneumatisch

      • Hydraulisch

    • Markt für automatische Bewehrungsbindemaschinen in GCC-LÄNDERN nach Vertriebskanal

      • Online

      • Offline

    • Perspektive SÜDAFRIKA (Milliarden USD, 2019-2032)

    • Markt für automatische Bewehrungsbindemaschinen in SÜDAFRIKA nach Anwendungstyp

      • Bau

      • Infrastruktur

      • Bauingenieurwesen

      • Industrie

    • Markt für automatische Bewehrungsbindemaschinen in SÜDAFRIKA nach Typ

      • Halbautomatisch

      • Vollautomatisch

    • Markt für automatische Bewehrungsbindemaschinen in SÜDAFRIKA nach Betriebsmodus

      • Elektrisch

      • Pneumatisch

      • Hydraulisch

    • Markt für automatische Bewehrungsbindemaschinen in SÜDAFRIKA nach Vertriebskanal

      • Online

      • Offline

    • Perspektive REST VON MEA (Milliarden USD, 2019-2032)

    • Markt für automatische Bewehrungsbindemaschinen im REST VON MEA nach Anwendungstyp

      • Bau

      • Infrastruktur

      • Bauingenieurwesen

      • Industrie

    • Markt für automatische Bewehrungsbindemaschinen im REST VON MEA nach Typ

      • Halbautomatisch

      • Vollautomatisch

    • Markt für automatische Bewehrungsbindemaschinen im REST VON MEA nach Betriebsmodus

      • Elektrisch

      • Pneumatisch

      • Hydraulisch

    • Markt für automatische Bewehrungsbindemaschinen im REST VON MEA nach Vertriebskanal

      • Online

      • Offline

Compare Licence

×
Features License Type
Single User Multiuser License Enterprise User
Price $4,950 $5,950 $7,250
Maximum User Access Limit 1 User Upto 10 Users Unrestricted Access Throughout the Organization
Free Customization
Direct Access to Analyst
Deliverable Format
Platform Access
Discount on Next Purchase 10% 15% 15%
Printable Versions