Uninterruptible Power Supply (UPS) Market (2026 - 2035)

Uninterruptible Power Supply (UPS) Market Research Report By Capacity (Less than 10 kVA, 10.1–100 kVA, Above 100 kVA), By Type (Standby, Line-Interactive, Online Double Conversion), By Application (Industrial Manufacturing, Data Centres, IT & Telecommunications, Healthcare, BFSI, Residential & Commercial, Transportation & Infrastructure), By Battery Type (Valve-Regulated Lead-Acid, Lithium-Ion, Nickel-Cadmium & Others) - Forecast to 2035
ID: MRFR/EnP/5160-CR 128 Pages Priya Nagrale Last Updated: October 16, 2026
Uninterruptible Power Supply (UPS) Market
Market Size
Forecast Period2026-2035
CAGR (2026-2035)3.85%
2025 Market SizeUSD 13.10 Billion
2035 Market SizeUSD 19.26 Billion
Key Players
Eaton
Schneider Electric
Vertiv
Huawei
ABB
Delta Electronics
Opportunities
  • Grid-Interactive Backup as a Revenue Asset
  • Lithium Retrofit of Installed Lead-Acid Fleets
  • Emerging-Market Solar-Plus-Storage Convergence

Uninterruptible Power Supply (UPS) Market Summary

The Uninterruptible Power Supply (UPS) Market reached USD 13.10 billion in 2025 and opens the forecast window at USD 13.71 billion in 2026, climbing to USD 19.26 billion by 2035 at a 3.85% CAGR. Two catalysts anchor that trajectory. Hyperscale and colocation operators committed more than USD 400 billion in global data-centre capital expenditure during 2025, with power and cooling infrastructure absorbing roughly a fifth of every build budget [1]. Grid reliability policy is the second lever: the U.S. Department of Energy's Grid Resilience and Innovation Partnerships program has obligated USD 10.5 billion toward transmission hardening and distributed backup, pulling critical-power spending forward across industrial and healthcare campuses [2].

Legacy double-conversion units built on IGBT bridges and valve-regulated lead-acid strings are giving way to silicon-carbide power stages paired with lithium-iron-phosphate cabinets. The swap matters commercially, not just technically. SiC-based topologies clear 98% efficiency at half load and reclaim roughly 120 kW of cooling capacity per megawatt of IT load, which translates into a dozen additional server racks inside an unchanged footprint [3]. Vendors now sell that reclaimed white space as the primary payback argument.

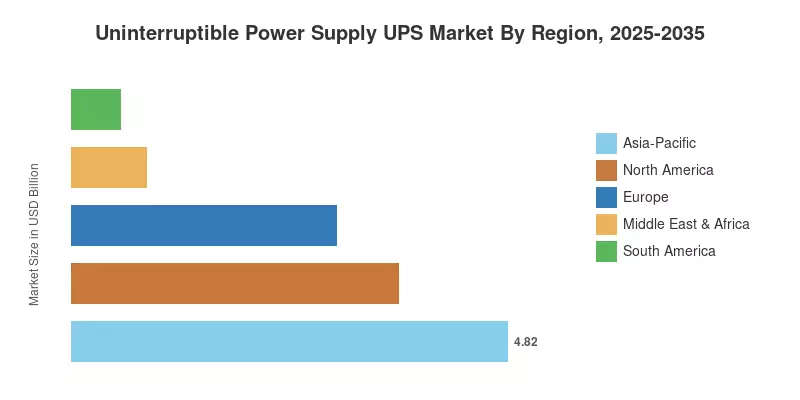
Asia-Pacific dominates the Uninterruptible Power Supply (UPS) Market with 36.8% of 2025 revenue and simultaneously grows fastest at a 4.25% CAGR through 2035. North America follows at 27.6%, propelled by AI training clusters concentrated in Northern Virginia, Dallas, and Phoenix. Europe holds 22.4% on the strength of EN 50600 compliance retrofits. Through 2035, competition shifts from hardware margin toward fleet software and battery-lifecycle economics.


Key Report Takeaways

• By Technology

  • Standby topology commanded 49.2% of 2025 revenue in the Uninterruptible Power Supply (UPS) Market, sustained by sub-USD 500 residential and small-office price points
  • Line-interactive architectures post the fastest topology growth at a 4.4% CAGR through 2035
  • Lithium-based chemistries are scaling at a 9.8% CAGR as operators trade footprint for energy density

• By Application

  • Industrial manufacturing held 24.2% of application revenue in 2025, the single largest end-use block
  • Data centres advance at a 4.6% CAGR, the quickest application trajectory in the Uninterruptible Power Supply (UPS) Market
  • Healthcare facilities generated USD 1.55 billion of 2025 demand under continuity mandates

• By Region

  • Asia-Pacific captured 36.8% of 2025 global revenue
  • North America contributed USD 3.62 billion in 2025
  • India records the fastest country-level growth at a 5.85% CAGR through 2035


Market Size and Forecast (2021–2035)

Estimates combine bottom-up shipment modelling across four capacity bands with top-down triangulation against vendor segment disclosures, customs data for power-conversion equipment, and utility interconnection filings. Historical values for 2021–2024 reconcile audited revenue from twelve publicly listed suppliers against distributor sell-through. Forecast values apply capacity-weighted replacement cycles of seven to eleven years, adjusted for data-centre commissioning pipelines and semiconductor lead-time normalisation. The Uninterruptible Power Supply (UPS) Market series below is expressed in constant 2025 U.S. dollars.
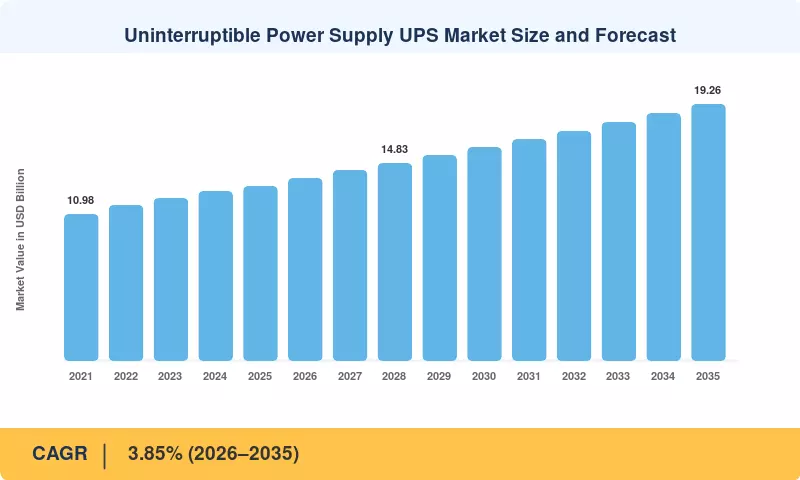
Uninterruptible Power Supply UPS Market Size and Forecast
Our Impact

Enabled $4.3B Revenue Impact for Fortune 500 and Leading Multinationals

Partnering with 2000+ Global Organizations Each Year

30K+ Citations by Top-Tier Firms in the Industry

Driver Impact Analysis

Driver ~% Impact on CAGR Geographic Relevance Impact Timeline
AI-driven rack density above 30 kW 0.92 North America, Asia-Pacific Short-term (≤2 yr)
Lithium-ion cost decline and footprint recovery 0.71 Global Medium-term (2–4 yr)
Grid instability and outage frequency 0.64 North America, MEA, South America Short-term (≤2 yr)
Industrial automation and process continuity 0.55 Asia-Pacific, Europe Medium-term (2–4 yr)
Healthcare and life-safety continuity mandates 0.41 Europe, North America Long-term (≥4 yr)
Edge computing and 5G aggregation sites 0.38 Asia-Pacific, Europe Medium-term (2–4 yr)
Battery-as-a-service commercial models 0.29 Global Long-term (≥4 yr)


AI-Driven Rack Density Above 30 kW

The average rack draw has increased from 8 kW to almost 30 kW thanks to training clusters, while flagship AI halls now offer 120 kW per rack. Due to the inability of legacy modules designed for 8 kW densities to provide the fault-clearing current required by a dense busway, this change necessitates a complete power-train rebuild. Critical power accounted for over 20% of global data center capital expenditures, which exceeded USD 400 billion in 2025 [1]. Near-term unit growth is driven by retrofit volume rather than greenfield.


Lithium-Ion Cost Decline and Footprint Recovery

Prices for lithium-iron-phosphate packs decreased by 42% from 2021 levels to about USD 95 per kWh in 2025 [7]. For systems larger than 100 kVA, the total cost of ownership crossover against valve-regulated lead-acid occurs within five years at that pricing. Additionally, operators recover 50–60% of the floor surface of battery rooms, which big colocation providers directly sell for USD 130–180 per kW per month as leasable white space.


Grid Instability and Outage Frequency

U.S. customers averaged 5.5 interruption hours in 2024, more than double the 2013 baseline, with weather driving the majority of that increase [14]. Comparable deterioration appears in South Africa and parts of South America. The Department of Energy's USD 10.5 billion Grid Resilience and Innovation Partnerships program funds hardening, yet distribution-level exposure persists, keeping facility-side backup capital in budget cycles rather than deferred.

Industrial Automation and Process Continuity

Semiconductor fabs, pharmaceutical clean rooms and continuous-process chemical plants treat a 200-millisecond sag as a full batch loss. A single voltage event at an advanced logic fab can destroy USD 3–5 million of work-in-process. Global industrial robot installations reached 541,000 units in 2024, concentrating sensitive drives and controllers on plant floors [11]. Each installation raises the value at risk behind the protected bus.

Healthcare and Life-Safety Continuity Mandates

NFPA 110 and the equivalent HTM 06-01 guidance in the United Kingdom require essential electrical systems to transfer within ten seconds and sustain defined runtime for operating theatres, imaging suites and cold-chain storage. European hospital construction and refurbishment spending reached EUR 41 billion in 2024 [12]. Imaging modalities in particular impose pulsed loads that standby generators alone cannot ride through, mandating conditioned intermediate power.

Edge Computing and 5G Aggregation Sites

Operators deployed roughly 2.1 million new 5G base-station sites globally during 2024, each aggregating traffic through cabinets needing 3–20 kVA of conditioned backup [13]. Unmanned, environmentally exposed, and geographically dispersed, these sites favour compact units with remote diagnostics. Volume rather than unit value carries the contribution here, and the segment reshapes service-network economics for suppliers accustomed to centralised installations.

Battery-as-a-Service Commercial Models

Subscription structures convert capital expenditure into operating expense across ten-year terms, while vendors retain residual value in second-life cells destined for stationary storage. Recovered residual value trims roughly 12% from subscription pricing . The model unlocks buyers whose capital committees reject seven-figure infrastructure requests, and it produces an annuity stream that smooths the cyclicality of hardware sales.


Restraints Impact Analysis


Restraint ~% Drag on CAGR Geographic Relevance Impact Timeline
Power semiconductor lead times -0.48 Global Short-term (≤2 yr)
Lithium fire-code and permitting friction -0.36 North America, Europe Medium-term (2–4 yr)
Price compression from regional challengers -0.31 Asia-Pacific, MEA Short-term (≤2 yr)
Field service and commissioning labour scarcity -0.24 North America, Europe Long-term (≥4 yr)
Extended replacement cycles in mature installs -0.19 Europe, Japan Long-term (≥4 yr)


Power Semiconductor Lead Times

Lead times for silicon-carbide MOSFETs and IGBTs reached 26 weeks in 2024 and are still more than 18 weeks for high-voltage modules [6]. Integrators compress margins by 200–400 basis points by absorbing the discrepancy between fixed-price contracts and variable component prices. Although design-for-substitution platforms reduce risk, each topology variant necessitates three to five months of additional requalification cycles.


Lithium Fire-Code and Permitting Friction

A typical multi-megawatt installation would cost between USD 40,000 and USD 90,000 in engineering and suppression costs due to NFPA 855, which caps stored energy per fire area and requires explosion-control measures [15]. Several U.S. and European jurisdictions have municipal review timelines that are six to fourteen weeks longer than lead-acid counterparts. When faced with challenging commissioning deadlines, facility teams often turn to well-known chemistry instead of taking on scheduling risk.


Price Compression from Regional Challengers

Kehua Tech and INVT Power price roughly 18% below Western incumbents while certifying to IEC 62040-3, leveraging domestic IGBT supply and lower engineering overhead [16]. That gap sets the reference point in tenders across Southeast Asia, the Gulf and Africa. Established vendors respond by unbundling service contracts, which lowers realised revenue per installed megawatt even where unit volume holds.

Field Service and Commissioning Labour Scarcity

Certified critical-power technicians are retiring faster than apprenticeship pipelines replace them; roughly 27% of the U.S. electrical trades workforce is over 55 [17]. Commissioning slots for large modular installations now book nine to twelve months ahead in tier-one metros. Delayed energisation defers revenue recognition and, in competitive tenders, occasionally decides the award outright.

Extended Replacement Cycles in Mature Installs

Improved capacitor and fan lifetimes have pushed practical service life from seven years toward eleven in climate-controlled European and Japanese facilities [10]. Predictive maintenance platforms reinforce the trend by letting operators defer replacement on evidence rather than schedule. Mature-market refresh volume consequently arrives later and in flatter cohorts, muting the replacement-driven baseline that once underpinned regional forecasts.


Uninterruptible Power Supply (UPS) Market Opportunities

Grid-Interactive Backup as a Revenue Asset

Idle backup capacity is becoming a dispatchable resource. FERC Order 2222 obliges regional transmission organisations to admit aggregated distributed energy resources into wholesale markets, and PJM's aggregation rules now accept sub-100 kW assets [18]. A 5 MW data-centre fleet participating in frequency regulation can earn USD 180,000–310,000 annually. Vendors that certify bidirectional inverters and telemetry interfaces convert a cost centre into a monetised asset.

Lithium Retrofit of Installed Lead-Acid Fleets

Roughly 60% of installed capacity above 100 kVA still runs valve-regulated lead-acid, and much of that cohort reaches end of life between 2027 and 2031. A drop-in lithium-ion UPS battery cabinet paired with a firmware-level charge-profile update avoids full power-train replacement, cutting retrofit cost by 55–65% versus a system swap. The addressable retrofit pool exceeds USD 2.4 billion across North America and Europe alone.

Emerging-Market Solar-Plus-Storage Convergence

Sub-Saharan Africa, Southeast Asia, and Andean South America face weak grids and rapid commercial electrification. Nigeria's Distributed Access through Renewable Energy Scale-up program targets 17.5 million people with mini-grid and hybrid systems [19]. Hybrid architectures that merge backup conditioning with photovoltaic input and storage displace diesel gensets at lower lifecycle cost, opening a segment where incumbent product catalogues currently offer little purpose-built hardware.

Fleet Telemetry and Predictive-Maintenance Monetisation

Connected estates generate cell-level impedance, thermal and switching data across thousands of assets. Schneider Electric's EcoStruxure and ABB's Ability suites already extend usable battery life by roughly 20% through predictive intervention. Packaging that intelligence as a per-kilowatt subscription yields 60–70% gross margin against 22–28% on hardware, and it locks renewal behaviour years before the replacement decision surfaces.

Second-Life Battery Channel Development

Cells retired from critical-power duty at 80% state of health retain years of service in telecom towers and behind-the-meter commercial storage. Global second-life supply is projected to exceed 100 GWh annually by 2032 . Suppliers controlling reverse logistics capture both a residual credit that lowers headline subscription pricing and a downstream storage revenue line independent of the replacement cycle.


Uninterruptible Power Supply (UPS) Market Future Outlook

Autonomous Fleet Operations

Cloud-native orchestration is replacing scheduled maintenance across the Uninterruptible Power Supply (UPS) Market. Impedance-trend models flag cell degradation eight to twelve weeks before failure, and modular designs paired with automated dispatch have compressed mean time to repair below two hours. By 2032, most estates above 5 MW will run condition-based service contracts rather than calendar intervals. The operational consequence is fewer truck rolls, longer usable asset life, and a service revenue model priced on availability instead of visits.

Electrification Supercycle

Global electricity demand is set to expand at close to 4% annually through 2027, the fastest sustained pace in two decades, with data centres, electrified transport and industrial heat driving the increment [1]. Rising demand meets constrained transmission build, producing longer interconnection queues and thinner reserve margins. Facility-side conditioning capacity fills that gap, positioning backup infrastructure as a permanent fixture of industrial load design rather than a contingency purchase.

Sustainability Disclosure and Circularity

CSRD reporting obligations extend to embodied carbon and end-of-life handling for capital equipment across large European operators. Vendors publishing verified environmental product declarations and documented cell take-back are winning tender scoring points already. Recycled-content thresholds under the EU Battery Regulation begin binding in 2031, requiring defined shares of recovered cobalt, lithium and nickel [8]. Suppliers without reverse-logistics infrastructure will face disqualification from public and large-enterprise procurement.

Convergence with Behind-the-Meter Storage

The architectural boundary between backup conditioning and commercial energy storage is dissolving. Shared lithium cabinets serving ride-through, peak shaving, and demand-response participation deliver stacked value that single-purpose systems cannot match. IRENA projects global stationary storage capacity surpassing 1,500 GWh by 2030 [3]. Vendors that ship a unified controller across both duty cycles will capture share from pure-play backup specialists and pure-play storage integrators simultaneously.


Regional Market Share Analysis

Region Metric (2025) Primary Investment Themes
Asia-Pacific 36.8% share Fab construction, edge telecom, domestic vendor scale-up
North America USD 3.62 Billion AI campuses, grid-interactive pilots, lithium conversion
Europe 22.4% share EN 50600 compliance, energy-efficiency retrofit
South America 4.15% CAGR Mining continuity, banking resilience
Middle East & Africa USD 0.83 Billion Sovereign cloud, solar hybridisation
Total USD 13.10 Billion —

Regional distribution across the Uninterruptible Power Supply (UPS) Market reflects three distinct demand logics: manufacturing density in Asia-Pacific, AI infrastructure concentration in North America, and compliance-driven retrofit in Europe.


North America

Country Metric Key Driver
US 78.4% of region AI training campus power-train retrofit
Canada USD 0.44 Billion Hydro-adjacent colocation growth
Mexico 4.05% CAGR Nearshoring manufacturing build-out


North American demand concentrates in a handful of corridors. Northern Virginia alone hosts over 3.5 GW of commissioned data-centre load, and Dominion Energy's interconnection queue for the region exceeds 47 GW of requests through 2038 [20]. Utilities responding with multi-year energisation delays have pushed operators toward on-site conditioning and bridging capacity as a scheduling workaround. Mexico's contribution stems from a different source: automotive and electronics plants relocating from Asia now specify conditioned power at commissioning rather than retrofitting after their first process loss.

Europe

Country Metric Key Driver
Germany 22.6% of region Industrial process continuity
UK USD 0.47 Billion London colocation cluster expansion
France 3.55% CAGR Nuclear-adjacent industrial parks
Italy 9.8% of region Manufacturing SME modernisation
Spain USD 0.21 Billion Renewable-heavy grid conditioning
Nordic Countries 4.12% CAGR Low-cost-power data-centre siting
Russia 6.4% of region Domestic substitution programmes
Rest of Europe USD 0.29 Billion EU cohesion-funded digital infrastructure


European procurement runs through the Energy Efficiency Directive recast, which obliges data centres above 500 kW to report power usage effectiveness and waste-heat recovery annually [8]. Reporting exposure has made conversion efficiency a board-level metric rather than an engineering preference, accelerating replacement of transformer-based units with transformerless designs. Germany's industrial base contributes the largest national block, where automotive and chemical operators specify redundancy at the process-cell level. Spanish demand tracks a separate dynamic: high instantaneous renewable penetration produces frequency excursions that industrial loads increasingly buffer locally.

Asia-Pacific

Country Metric Key Driver
China 38.2% of region Domestic manufacturing and state cloud
India 5.85% CAGR Data-centre policy incentives, grid variability
Japan USD 0.71 Billion Seismic resilience and factory automation
South Korea 8.9% of region Semiconductor fabrication clusters
ASEAN 4.90% CAGR Cross-border cable landings, digital economy
Rest of Asia-Pacific USD 0.32 Billion Telecom densification


Asia-Pacific leads both scale and growth within the Uninterruptible Power Supply (UPS) Market. India's trajectory rests on state-level data-centre policies in Maharashtra, Tamil Nadu and Uttar Pradesh offering capital subsidies and stamp-duty waivers against committed capacity, alongside a national commissioned pipeline exceeding 1.4 GW [21]. Korean demand is narrower but denser, with Samsung and SK Hynix fab expansions each requiring hundreds of megawatts of conditioned supply. ASEAN growth follows subsea cable landings in Johor and Batam, where Singapore's moratorium history redirected regional capacity.

South America

Country Metric Key Driver
Brazil 52.6% of region Financial services continuity mandates
Argentina USD 0.14 Billion Industrial and agri-processing loads
Rest of South America 3.70% CAGR Copper and lithium mining operations


Brazilian banking regulation drives the region's largest single demand block. Central Bank Resolution 4,893 sets cyber-resilience and continuity requirements for financial institutions, which in practice translate into dual-path conditioned power at processing sites [22]. Chilean and Peruvian mining operations form the second pillar, where a single unplanned mill stoppage costs USD 200,000–500,000 per hour and altitude derating forces oversized specification. Argentine demand is constrained less by need than by import financing, with foreign-exchange controls periodically stalling capital equipment orders for two to three quarters.

Middle East & Africa

Country Metric Key Driver
Saudi Arabia 24.8% of region Sovereign cloud and giga-project infrastructure
UAE USD 0.17 Billion Regional cloud availability zones
South Africa 3.62% CAGR Load-shedding mitigation
Egypt 9.1% of region Industrial zone electrification
Rest of MEA USD 0.29 Billion Telecom and mining continuity


Gulf demand originates in sovereign digital strategy. Saudi Arabia's data-centre programme targets several gigawatts of domestic capacity, tied to data-residency rules that require in-kingdom hosting for regulated workloads. South Africa presents the inverse case: Eskom load-shedding removed roughly 330 hours of supply in 2024, making backup a baseline operating requirement rather than a resilience upgrade. Commercial buyers there increasingly specify hybrid photovoltaic-plus-storage architectures that serve both outage bridging and daily peak-cost avoidance, a pattern now spreading into Kenya and Nigeria.


Uninterruptible Power Supply UPS Market By Region, 2025-2035

Uninterruptible Power Supply (UPS) Market Segmentation

By Capacity

Segment Metric Primary Demand Driver
Less than 10 kVA 44.2% share (2025) Residential and small-office price sensitivity
10.1–100 kVA USD 3.72 Billion (2025) Branch offices, clinics, retail networks
Above 100 kVA 4.75% CAGR (2026–2035) Data centres and heavy industry


Sub-10 kVA units dominate shipment volume across the Uninterruptible Power Supply (UPS) Market but contribute disproportionately less revenue, since average selling prices cluster between USD 120 and USD 480. The above-100 kVA band inverts that relationship: fewer units, far higher value density, and the fastest growth as AI-era facilities specify megawatt-scale power trains. Mid-range 10.1–100 kVA systems hold steady on distributed enterprise refresh, where multi-site retailers and healthcare networks standardise on a single rack-mount platform.

By Type

Segment Metric Primary Demand Driver
Standby 49.2% share (2025) Consumer and SOHO cost thresholds
Line-Interactive 4.4% CAGR (2026–2035) Voltage regulation without full conversion cost
Online Double Conversion USD 4.09 Billion (2025) Zero-transfer-time critical loads


Standby topology retains the revenue lead on sheer unit count, though its share erodes about 40 basis points annually as buyers move up-market. Line-interactive designs grow fastest because automatic voltage regulation addresses the sag-and-swell conditions typical of developing-market grids at roughly 60% of full-conversion cost. An online double conversion UPS system remains mandatory for fabs, hospitals, and financial processing, where any transfer interval is unacceptable, and that segment carries the highest revenue per unit shipped.

By Application

Segment Metric Primary Demand Driver
Industrial Manufacturing 24.2% share (2025) Process continuity and batch protection
Data Centres 4.6% CAGR (2026–2035) AI workload density and uptime SLAs
IT & Telecommunications USD 2.15 Billion (2025) 5G aggregation and edge nodes
Healthcare USD 1.55 Billion (2025) Life-safety and imaging continuity
BFSI 10.3% share (2025) Transaction integrity mandates
Residential & Commercial 3.10% CAGR (2026–2035) Grid reliability deterioration
Transportation & Infrastructure USD 0.59 Billion (2025) Signalling and airport systems


Industrial manufacturing leads on installed base breadth, spanning semiconductor fabs, pharmaceutical suites and continuous-process chemical plants where a brief sag destroys an entire batch. Data centres grow fastest and will overtake industrial revenue near 2033 on current trajectories. Healthcare demand is regulation-locked and therefore recession-resistant, while BFSI spending clusters around core processing sites rather than distributed branches, producing high value concentration in relatively few installations.

By Battery Type

Segment Metric Primary Demand Driver
Valve-Regulated Lead-Acid 62.4% share (2025) Installed base inertia and code familiarity
Lithium-Ion 9.8% CAGR (2026–2035) Footprint recovery and cycle life
Nickel-Cadmium & Others USD 0.48 Billion (2025) Extreme-temperature and rail applications


Lead-acid still holds the majority share on legacy fleets and permitting simplicity, but its position weakens each year as retirement cohorts convert. Lithium chemistries deliver three to four times the cycle life, half the footprint, and tolerate 30°C ambient operation without derating, which removes a dedicated cooling zone from the design. Nickel-cadmium persists in narrow niches — rail signalling, offshore platforms, Arctic telecom — where thermal extremes disqualify both alternatives.


Competitive Benchmarking

Concentration in the Uninterruptible Power Supply (UPS) Market is moderate. The top five suppliers hold roughly 48% of global revenue, and the estimated Herfindahl-Hirschman Index sits between 720 and 810 — below the 1,500 threshold that signals meaningful concentration. Scale advantages in global service networks and power-semiconductor procurement favour incumbents, yet regional specialists retain durable positions in edge, solar-hybrid and price-led tenders. Competitive differentiation has migrated from raw efficiency toward thermal-management intellectual property, fleet orchestration software and modular architectures achieving sub-two-hour mean time to repair.

Company Est. Revenue Share Range Key Offerings for Uninterruptible Power Supply (UPS) Market Strategic Positioning
Eaton ~12–15% 93PM/9PX platforms, flywheel hybrids, Tripp Lite SOHO range Broadest capacity coverage; 14 flywheel-hybrid patent filings in 2025
Schneider Electric ~11–14% Galaxy VL/VX series, EcoStruxure analytics Software-led lifecycle strategy; predictive battery-life extension
Vertiv ~9–12% Liebert EXL/APM, liquid-cooled battery enclosures Hyperscale-aligned; deep AI-density engineering
Huawei ~6–9% FusionPower modular systems, SmartLi cabinets Vertically integrated cells and power electronics
ABB ~5–7% MegaFlex, Conceptpower DPA, Ability suite Industrial and utility-adjacent installed base
Delta Electronics ~3–5% Modulon, Ultron three-phase platforms Efficiency leadership; strong Asia-Pacific channel
Legrand ~3–5% Keor range, Server Technology rack PDUs Rack-level power distribution convergence
Mitsubishi Electric ~2–4% Diamond series high-capacity systems Semiconductor and transit reliability specialisation
Toshiba ~2–4% G9000 three-phase, lithium-integrated units Japanese industrial and seismic-resilience niche
Kehua Tech ~2–4% KR/FR modular series Cost-led challenger; domestic IGBT supply advantage
INVT Power ~1–3% RM/HT modular platforms Aggressive pricing in emerging-market tenders
Riello Elettronica ~1–3% Multi Power, Master series European mid-market and channel depth


Recent News & Developments

  • Eaton (March 2024): Opened an expanded three-phase manufacturing line in Nashville, adding capacity aimed at North American data-centre backlog and shortening domestic delivery windows [4].
  • Vertiv (September 2024): Introduced a liquid-cooled battery enclosure platform engineered for racks above 100 kW, addressing thermal limits that constrain lithium deployment in dense AI halls [1].
  • Legrand (June 2024): Completed the Server Technology acquisition, extending rack-PDU coverage and enabling integrated rack-to-room power management propositions [10].
  • Schneider Electric (January 2025): Released an EcoStruxure module applying machine-learning impedance analysis across connected estates, targeting a 20% extension in usable battery service life [5].
  • European Commission (May 2024): Activated Energy Efficiency Directive reporting obligations for data centres above 500 kW, mandating annual disclosure of power usage effectiveness and waste-heat recovery [8].
  • Huawei (November 2024): Launched a SmartLi generation rated for 30°C ambient operation without derating, removing a dedicated cooled battery room from small and mid-size deployments [16].
  • U.S. Department of Energy (August 2024): Announced a further USD 2.2 billion tranche under the Grid Resilience and Innovation Partnerships program covering eighteen states and 42 GW of affected capacity [2].
  • ABB (April 2025): Commissioned a silicon-carbide power module line in Finland to reduce third-party dependency and shorten high-voltage component lead times [6].


Uninterruptible Power Supply (UPS) Market Report Scope

Report Attribute/Metric Details
Market Scope Global revenue for uninterruptible power supply systems across all capacity bands, topologies, battery chemistries and end-use applications, including associated batteries and factory-fitted accessories
Study Period 2021-2035
Base Year 2025
Historical Data 2021–2024
Forecast Period 2026–2035
Market Size in 2025 USD 13.10 Billion
Market Size in 2035 USD 19.26 Billion
CAGR (2026–2035) 3.85%
Fastest Growing Segments Above 100 kVA capacity; line-interactive topology; data-centre application; lithium-ion chemistry; Asia-Pacific region
Regions Covered North America, Europe, South America, Asia Pacific, Middle East and Africa and ROW
Companies Profiled Eaton, Schneider Electric, Vertiv, Huawei, ABB, Delta Electronics, Legrand, Mitsubishi Electric, Toshiba, Kehua Tech, INVT Power, Riello Elettronica
Valuation Currency USD Billion
Methodology 350+ primary expert interviews; bottom-up market sizing; top-down validation; data triangulation; scenario-based forecasting; real-time project tracking

FAQs

How should buyers structure warranty terms when procuring in the Uninterruptible Power Supply (UPS) Market?
Separate the electronics warranty from the battery warranty, and require guaranteed state-of-health thresholds rather than calendar coverage alone. Insist on published mean-time-to-repair commitments with financial remedies attached [24].
What total cost of ownership horizon justifies choosing lithium over lead-acid?
Crossover typically arrives within five years for systems above 100 kVA, driven by cycle life and reclaimed floor space. Below 20 kVA, lead-acid usually remains cheaper across the full asset life [7].
Which certifications should procurement teams require in the Uninterruptible Power Supply (UPS) Market?
IEC 62040-3 for performance classification, IEC 62619 and UL 1973 for battery safety, and IEEE 1547-2018 where grid interaction is planned. Hyperscale tenders now treat all four as mandatory prequalification [15].
Can existing systems be upgraded for grid-services participation without full replacement?
Rarely without an inverter change, since most installed units are unidirectional. Controller and telemetry retrofits are feasible, but bidirectional capability generally requires new power-stage hardware [18].
How does altitude affect specification for mining and highland installations?
Derating begins above 1,000 metres, typically 1% of rated capacity per additional 100 metres. Andean sites above 4,000 metres commonly need 30% oversizing plus enhanced cooling [23].
What integration challenges arise when pairing backup systems with on-site solar generation?
Rectifier input windows often reject the voltage variability of direct photovoltaic feeds. A common DC bus architecture with dedicated conversion resolves this and simplifies overall system control [3].
Which emerging use cases will reshape the Uninterruptible Power Supply (UPS) Market after 2030?
Electric vehicle charging hubs needing demand-charge buffering, and edge AI inference nodes deployed in retail and industrial sites. Both favour compact hybrid architectures over conventional room-scale installations [13].    
Author
Author Author Profile Priya Nagrale LinkedIn Senior Research Analyst
With an experience of over five years in market research industry (Chemicals & Materials domain), I gather and analyze market data from diverse sources to produce results, which are then presented back to a client. Also, provide recommendations based on the findings. As a Senior Research Analyst, I perform quality checks (QC) for market estimations, QC for reports, and handle queries and work extensively on client customizations. Also, handle the responsibilities of client proposals, report planning, report finalization, and execution

Research Approach


Secondary Research

The secondary research process involved comprehensive analysis of regulatory databases, technical standards publications, energy sector reports, and authoritative industry organizations. Key sources included the US Department of Energy (DOE), International Energy Agency (IEA), US Energy Information Administration (EIA), International Electrotechnical Commission (IEC), Institute of Electrical and Electronics Engineers (IEEE), European Committee for Electrotechnical Standardization (CENELEC), US National Electrical Manufacturers Association (NEMA), International Telecommunication Union (ITU), Uptime Institute, MRFR, Data Center Dynamics, US Federal Energy Regulatory Commission (FERC), EU Eurostat Energy Database, and national energy ministry reports from key markets. These sources were used to collect energy reliability statistics, regulatory compliance data, technology adoption trends, data center infrastructure growth metrics, and market landscape analysis for offline/standby UPS, line-interactive UPS, and online/double conversion systems across <5KVA, 5-<50KVA, 50-200KVA, and >200KVA rating segments.


Primary Research

To gather both qualitative and quantitative insights, supply-side and demand-side stakeholders were interviewed during the primary research phase. CEOs, VPs of Product Development, chiefs of regional sales, and R&D directors from UPS and power electronics OEM companies were examples of supply-side sources. Data center facility managers, IT infrastructure directors, electrical engineering managers from industrial facilities, telecommunications network operations leaders, and procurement heads from essential power facilities, healthcare facilities, and maritime operations were examples of demand-side sources. In addition to verifying lithium-ion battery transition timescales and validating market segmentation across rating categories and topology types, primary research also collected information on data center capacity expansion trends, energy efficiency laws, and total cost of ownership dynamics.

Primary Respondent Breakdown:

By Designation: C-level Primaries (32%), Director Level (31%), Others (37%)

By Region: North America (33%), Europe (29%), Asia-Pacific (31%), Rest of World (7%)


Market Size Estimation

Global market valuation was derived through revenue mapping and installation capacity analysis. The methodology included:

Identification of 50+ key manufacturers across North America, Europe, Asia-Pacific, and Latin America

Product mapping across <5KVA, 5-<50KVA, 50-200KVA, and >200KVA rating categories with offline/standby, line-interactive, and online/double conversion topologies

Analysis of reported and modeled annual revenues specific to UPS portfolios including battery and service revenues

Coverage of manufacturers representing 75-80% of global market share in 2024

Extrapolation using bottom-up (installation volume × ASP by country and rating) and top-down (manufacturer revenue validation) approaches to derive segment-specific valuations across data center, telecommunications, medical, industrial, marine, and other applications

Download Free Sample

Kindly complete the form below to receive a free sample of this Report

Download PDF ×

We do not share your information with anyone. However, we may send you emails based on your report interest from time to time. You may contact us at any time to opt-out.

















