Solar Backsheet Market (2026 - 2035)

Solar Backsheet Market Research Report By Type (Fluoropolymer, Non-fluoropolymer), By Material Construction (TPT / Tedlar-Based, KPK and KPF Constructions, Coated and Coextruded Polyolefin, Transparent, PET-Only Constructions), By Application (Utility-Scale, Commercial & Industrial Rooftop, Residential Rooftop, Off-Grid & Distributed) - Forecast to 2035
ID: MRFR/EnP/5601-CR 128 Pages Anshula Mandaokar Last Updated: September 15, 2026
Solar Backsheet Market
Market Size
Forecast Period2026-2035
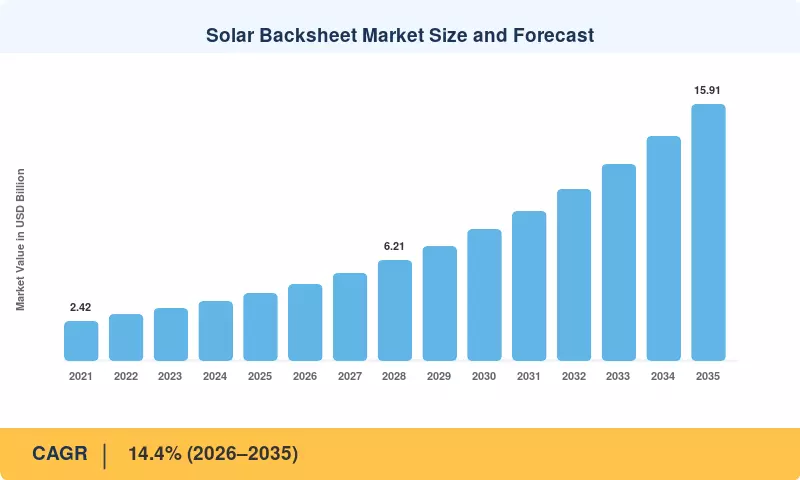
CAGR (2026-2035)14.4%
2025 Market SizeUSD 4.15 Billion
2035 Market SizeUSD 15.91 Billion
Key Players
DuPont
Jolywood Sunwatt
Cybrid Technologies
Suzhou Sveck
Coveme
Toyo Aluminium K.K.
Opportunities
  • Transparent Films for Bifacial Utility Assets
  • Fluorine-Free Premium Constructions
  • African and South Asian Off-Grid Electrification

Solar Backsheet Market Summary

Underneath the volume, the material mix is shifting hard. Cheap polyester-only laminates that dominated early rooftop installations are being pushed out by fluoropolymer and coextruded structures rated for 30-year service, driven by field data showing that polyamide-based rear layers cracked in high-irradiance climates within eight years. Fraunhofer ISE reporting places module efficiency and lifetime expectations at levels that low-cost laminates simply cannot underwrite [12]. Manufacturers responded with capital: several Chinese suppliers commissioned new coating lines between 2023 and 2025.

V Key trends that are influencing the solar backsheet market include a significant transition to sustainable, eco-friendly, and recyclable materials in order to reduce environmental impact. In order to optimize logistics and support contemporary bifacial modules, manufacturers are increasingly emphasizing ultra-thin, lightweight film structures. Furthermore, the demand for high-durability fluoropolymer alternatives that are designed to withstand extreme weather conditions, resist ultraviolet degradation, and guarantee long-term photovoltaic reliability remains strong.

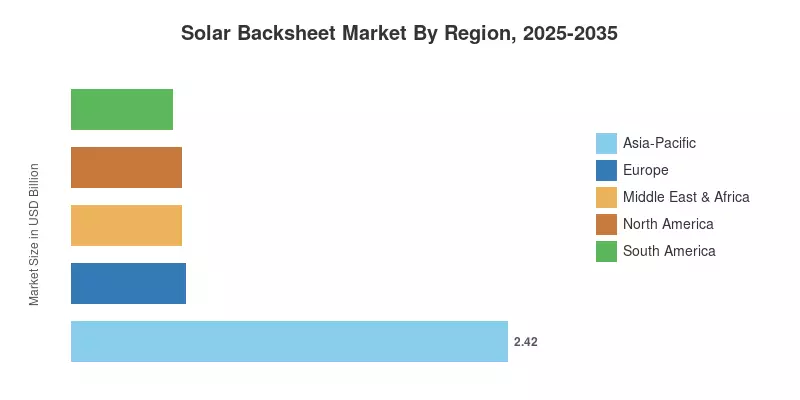
The Asia-Pacific region is the fastest-growing region, with a compound annual growth rate (CAGR) of 15.3%, and it accounts for 58.4% of global revenue. This uncommon combination is a reflection of the expansion of Indian demand and the gravity of Chinese manufacturing. Europe maintains a 15.2% market share, which is attributed to the repowering of aging fleets. The competitive question through 2035 is not who supplies the most square meters, but rather which laminates endure the warranty.


Key Report Takeaways

• By Type

  • Fluoropolymer structures command 68.5% of Solar Backsheet Market revenue in 2025, reflecting their dominance in utility-scale procurement.
  • KPK and KPF constructions are expanding at a 15.9% CAGR as buyers seek fluoropolymer protection at lower resin cost
  • Transparent variants post the fastest expansion of any construction type at an 18.6% CAGR.

• By Application

  • Utility-scale projects account for 61.2% of demand, concentrating purchasing power in a small buyer set.
  • Commercial and industrial rooftop applications generated USD 0.81 billion in 2025
  • Off-grid and distributed deployments grow at 17.1% CAGR, the fastest application segment in the Solar Backsheet Market.

• By Region

  • Asia-Pacific captures 58.4% of 2025 revenue
  • Middle East & Africa expands at a 14.8% CAGR on desert-scale tenders
  • Europe generated USD 0.63 billion in 2025


Market Size and Forecast (2021–2035)

Figures are built bottom-up from module shipment data cross-checked against polymer film production volumes, then reconciled top-down against installed capacity statistics from national energy agencies and multilateral bodies [1][3][25]. Historical values reflect realized revenue net of the price deflation that swept the photovoltaic supply chain after 2022. The Solar Backsheet Market grew in area terms faster than in value terms across that period.
Solar Backsheet Market Size and Forecast
Our Impact

Enabled $4.3B Revenue Impact for Fortune 500 and Leading Multinationals

Partnering with 2000+ Global Organizations Each Year

30K+ Citations by Top-Tier Firms in the Industry

Driver Impact Analysis

Driver ~% Impact on CAGR Geographic Relevance Impact Timeline
Utility-scale photovoltaic capacity additions ~3.4 pp Global, Asia-Pacific led Long-term (≥4 yr)
Extension of module warranties to 30–35 years ~2.6 pp Global Medium-term (2–4 yr)
Bifacial, TOPCon and heterojunction transition ~2.4 pp Asia-Pacific, MEA Medium-term (2–4 yr)
Localized manufacturing incentives ~2.1 pp North America, EU, India Short-term (≤2 yr)
High-irradiance desert deployment growth ~1.7 pp MEA, South America Long-term (≥4 yr)
Rooftop and off-grid electrification programs ~1.4 pp Asia-Pacific, Africa Medium-term (2–4 yr)
Remediation of failed legacy installations ~0.8 pp North America, Europe Short-term (≤2 yr)


Utility-Scale Capacity Additions

Grid-scale procurement sets the tempo. IEA tracking shows solar accounting for the overwhelming majority of net renewable capacity growth, with annual additions exceeding 500 GW globally in recent years [1]. Single tenders in Saudi Arabia and India now exceed 2 GW. At roughly 5.5 square metres of laminate per kilowatt, one gigawatt of monofacial modules consumes north of five million square metres of rear film. Developers at that scale negotiate directly with film producers, bypassing module assemblers entirely.

Warranty Tenor Extension

Thirty-year linear performance warranties are now table stakes in bankable projects, and IEA-PVPS Task 13 field reliability work identifies rear-layer degradation as a leading cause of premature module retirement [10]. Insurers price this. A developer offering a 30-year yield guarantee on a polyester-only laminate faces materially higher premiums, which is why fluoropolymer share climbed even as module average selling prices fell more than 40% between 2022 and 2024 [13].

Cell Architecture Transition

TOPCon and heterojunction cells run hotter and thinner than legacy PERC, and bifacial designs demand rear-side light transmission. Fraunhofer ISE data documents bifacial capturing a rapidly rising share of utility shipments [12]. That single shift created an entirely new product category — transparent and grid-patterned rear films — that barely existed commercially in 2019.

Manufacturing Incentives

Section 45X pays USD 0.07 per watt for domestically produced modules, and the European Net-Zero Industry Act set a 30 GW domestic manufacturing benchmark for 2030 [18][19]. India's ALMM list restricts non-listed modules from subsidized projects [16]. Each policy pulls laminate sourcing closer to the assembly line, restructuring supply geography.


Restraints Impact Analysis

Restraint ~% Impact on CAGR Geographic Relevance Impact Timeline
Glass-glass laminate substitution ~-2.2 pp Europe, China Medium-term (2–4 yr)
Fluoropolymer resin cost and PFAS scrutiny ~-1.9 pp Europe, North America Short-term (≤2 yr)
Module price deflation compressing material budgets ~-1.6 pp Global Short-term (≤2 yr)
Supplier overcapacity and price competition ~-1.3 pp Asia-Pacific Medium-term (2–4 yr)
Legacy field failure reputation damage ~-0.9 pp North America, Europe Long-term (≥4 yr)


Glass-Glass Substitution

The most direct threat is elimination. Dual-glass modules replace the polymer rear layer entirely with a second pane, and Fraunhofer ISE reporting shows dual-glass construction taking a substantial and growing share of bifacial utility shipments [12]. Weight penalties and breakage rates during transport have slowed adoption in distributed applications, but in flat desert installations where cranes handle every module anyway, the trade-off increasingly favours glass.

PFAS Regulatory Overhang

European chemicals authorities published a universal restriction proposal covering per- and polyfluoroalkyl substances in 2023, and fluoropolymers sit within its scope [19]. Even with derogations under discussion, procurement committees at European utilities have begun requesting fluorine-free alternatives in tender documentation. Independent laboratory work on solar backsheet UV aging degradation is now routinely commissioned to validate whether non-fluorinated coatings can match 25-year performance [20].

Price Deflation

Module prices fell below USD 0.10 per watt in several Chinese contracts during 2024 [13]. When the finished module costs that little, the bill of materials budget for rear encapsulation collapses to a few cents per watt, and premium constructions get value-engineered out of anything except long-tenor bankable assets.


Solar Backsheet Market Opportunities

Transparent Films for Bifacial Utility Assets

Bifacial yield gains depend on rear-side transmission, and transparent polymer films weigh significantly less than dual-glass panes. Suppliers certifying optical clarity retention capture a new segment. Global tracking reports from energy databases and the World Bank indicate that utility-scale operating capacity is expanding significantly, with over 440 gigawatts of utility-scale solar projects under active construction worldwide, driving heavy demand for lightweight rear encapsulants.


Fluorine-Free Premium Constructions

Regulatory pressure creates product gaps. Coated polyolefin and modified structures passing rigorous damp heat stress tests without fluoropolymers command premium pricing in European tenders. Regulatory frameworks and industry manufacturing benchmarks target rapid expansion—such as regional capacity targets exceeding 30 gigawatts domestically by 2030—pushing early movers to secure specifications before compliance mandates finalize.


African and South Asian Off-Grid Electrification

World Bank reports indicate off-grid solar provides cost-effective solutions for millions lacking electricity. Sub-Saharan Africa accounts for 85% of the global population without power. Decentralized renewable energy systems delivered 55% of new connections in the region, creating high-volume demand for cost-sensitive mid-tier backsheet constructions.


Field Data as a Commercial Asset

Suppliers with instrumented fleets spanning over a decade hold a proprietary advantage: empirical failure statistics. According to reliability analysis guidelines from the International Energy Agency's Photovoltaic Power Systems Programme (IEA-PVPS Task 13), tracking long-term degradation mechanisms allows manufacturers to sell residual-value certifications and analytics to asset owners, transforming hardware sales into recurring revenue streams.


Solar Backsheet Market Future Outlook

Materials Informatics Replaces Trial-and-Error

Formulation development historically meant years of outdoor exposure testing. Machine-learning models trained on accelerated aging datasets now predict 25-year outcomes from 1,000-hour laboratory results with usable confidence, compressing development cycles from five years to eighteen months. NREL reliability programs have published methodology frameworks that suppliers are adopting directly [8].

Vertical Integration Squeezes Independents

Chinese module giants increasingly produce their own encapsulation materials. As integration deepens, independent film suppliers lose access to the highest-volume accounts. They must reposition toward Western assemblers, specialty applications, or aftermarket replacement — a smaller but structurally more profitable field.

The Terawatt Installation Base

IRENA capacity statistics place cumulative global solar capacity in the multi-terawatt range within the forecast window [3]. An installed base that large generates its own service economy: inspection, warranty adjudication, repowering. Backsheet condition becomes the single most-examined variable in secondary-market asset transactions.

Circularity Requirements Reshape Design

European end-of-life rules require high recovery rates from retired modules, and multilayer polymer laminates are the hardest fraction to separate cleanly [19]. Suppliers designing for delamination — mono-material constructions, reversible adhesives — position themselves ahead of regulation that is drafted but not yet enforced. Recyclability will migrate from marketing claim to tender requirement before 2030.


Regional Market Share Analysis

Region Metric (2025) Primary Investment Themes
Asia-Pacific 58.4% revenue share Module assembly concentration, domestic content rules
Europe USD 0.63 billion Repowering, PFAS-compliant sourcing
North America 14.6% revenue share 45X-driven onshoring, traceability compliance
South America 13.5% CAGR (2026–2035) Distributed generation, auction pipelines
Middle East & Africa 14.8% CAGR (2026–2035) Gigawatt desert tenders, electrification access
Total USD 4.15 billion —

Regional distribution in the Solar Backsheet Market tracks module assembly location more closely than installation location, because films ship to factories rather than to project sites.


North America

Country Metric Key Driver
United States 76.5% of regional revenue Section 45X production credit [18]
Canada USD 75 million (2025) Provincial procurement and Arctic microgrids
Mexico 13.8% CAGR (2026–2035) Industrial rooftop expansion under nearshoring


American module assembly capacity expanded dramatically after 2022, but cell and film supply lagged. Assemblers importing laminate face traceability documentation requirements that add weeks to qualification. Suppliers establishing North American coating capacity — rather than merely warehousing imported rolls — hold a structural advantage that pricing alone cannot offset [18].

Europe

Country Metric Key Driver
Germany 24.8% of regional revenue Repowering of pre-2015 installations
Spain 13.4% CAGR (2026–2035) High-irradiance utility pipeline
Italy USD 81 million (2025) Agrivoltaic incentive schemes
France 11.7% of regional revenue Public tender programs
United Kingdom USD 66 million (2025) Contracts for Difference allocations
Nordic Countries 12.9% CAGR (2026–2035) Cold-climate and floating installations
Russia 5.1% of regional revenue Domestic industrial demand
Rest of Europe 11.3% of regional revenue Central European rooftop growth


Europe buys differently. The Net-Zero Industry Act embeds resilience and sustainability criteria into public auctions, meaning lowest price no longer wins automatically [19]. German fleet operators replacing modules installed before 2015 have accumulated failure data that now informs specification writing across the continent, and that institutional memory favours conservative material choices.

Asia-Pacific

Country Metric Key Driver
China 58.7% of regional revenue Module assembly concentration [17]
India 17.2% CAGR (2026–2035) ALMM domestic content enforcement [16]
Japan USD 201 million (2025) Rooftop retrofit and floating solar
South Korea 5.6% of regional revenue Corporate renewable procurement
ASEAN 16.4% CAGR (2026–2035) Export-oriented assembly relocation
Rest of Asia-Pacific USD 99 million (2025) Australian utility pipeline


China's dominance in the Solar Backsheet Market is structural rather than incidental — the film goes where the laminator is. India's position is changing fastest. ALMM enforcement pushed module assembly onshore, and backsheet suppliers followed with local converting operations to satisfy content thresholds [16]. Southeast Asian capacity, built partly to serve export markets, now represents a genuine second Asian cluster.

South America

Country Metric Key Driver
Brazil 68.4% of regional revenue Distributed generation regulatory framework [22]
Argentina USD 31 million (2025) RenovAr auction legacy pipeline
Rest of South America 12.8% CAGR (2026–2035) Chilean and Colombian utility projects


Brazil's distributed generation rules triggered a rooftop boom that pulled in enormous module volumes, most of them imported. Local converting is minimal, which makes the region a demand centre rather than a supply base [22]. Chilean desert projects in the Atacama expose materials to among the highest ultraviolet loads on the planet, making the region a de facto accelerated-aging laboratory.

Middle East & Africa

Country Metric Key Driver
Saudi Arabia 31.6% of regional revenue National Renewable Energy Program tenders [21]
UAE 15.9% CAGR (2026–2035) Gigawatt-scale independent power projects
South Africa USD 45 million (2025) REIPPPP procurement rounds
Egypt 11.9% of regional revenue Benban expansion and export corridors
Rest of MEA 17.3% of regional revenue World Bank electrification programs [15]


Gulf tenders are the most demanding technical environment in the industry. Ambient temperatures above 50°C, abrasive sand loading and intense ultraviolet exposure eliminate marginal materials within a few seasons. Saudi Arabia's renewable program has awarded multi-gigawatt capacity at record-low tariffs, which means developers cannot afford replacement cycles [21]. Specification here runs conservative regardless of cost pressure.


Solar Backsheet Market By Region, 2025-2035

Solar Backsheet Market Segmentation

By Type

Segment Metric Primary Demand Driver
Fluoropolymer 68.5% revenue share (2025) Long-tenor warranty and high-UV durability
Non-fluoropolymer USD 1.31 billion (2025) Cost-sensitive rooftop and short-tenor projects


The solar backsheet market by type is dominated by the Fluoropolymer segment, which captured a 68.5% revenue share in 2025, driven by long-tenor warranties and high-UV durability requirements. Meanwhile, the Non-fluoropolymer segment reached USD 1.31 billion in 2025, fueled by cost-sensitive rooftop and short-tenor projects. Regulatory frameworks like the ECHA universal PFAS restriction proposal heavily influence this segment mix, prompting shifts toward fluorine-free alternatives.


By Material Construction

Segment Metric Primary Demand Driver
TPT / Tedlar-based 26.4% revenue share (2025) Proven multi-decade field record
KPK and KPF constructions 15.9% CAGR (2026–2035) Fluoropolymer protection at lower resin cost
Coated and coextruded polyolefin USD 0.72 billion (2025) Fluorine-free compliance pathway
Transparent 18.6% CAGR (2026–2035) Bifacial rear-side transmission
PET-only constructions 14.8% revenue share (2025) Lowest installed cost


The material construction market is anchored by TPT / Tedlar-based backsheets, which held a dominant 26.4% revenue share in 2025 due to a proven multi-decade field record. Meanwhile, the Transparent segment stands out as the fastest-growing category, expanding at a robust 18.6% CAGR (2026–2035) to support bifacial rear-side transmission. Coated polyolefin reached USD 0.72 billion in 2025, driven by fluorine-free compliance pathways under chemical regulations like the EU's universal PFAS restriction proposal.


By Application

Segment Metric Primary Demand Driver
Utility-scale 61.2% revenue share (2025) Gigawatt tender volumes
Commercial & industrial rooftop USD 0.81 billion (2025) Corporate procurement commitments
Residential rooftop 13.4% CAGR (2026–2035) Retail electricity price escalation
Off-grid & distributed 17.1% CAGR (2026–2035) Electrification access programs [15]


The solar backsheet application market is heavily dominated by the Utility-scale segment, capturing a 61.2% revenue share in 2025 driven by massive gigawatt tender volumes. Meanwhile, Off-grid & distributed applications represent the fastest-growing category at a 17.1% CAGR (2026–2035), propelled by global electrification access programs. Commercial rooftop reached USD 0.81 billion in 2025, supported by corporate decarbonization policies.


Competitive Benchmarking

Concentration is low. The estimated Herfindahl-Hirschman Index sits below 800, with the top five suppliers holding roughly 42–48% of global revenue — a fragmented structure where regional converting capacity and qualification history matter more than scale. Western incumbents hold specification advantage in bankable projects while Chinese suppliers dominate volume. Competition within the Solar Backsheet Market increasingly turns on which supplier can document field performance rather than which can quote the lowest price per square metre.

Company Est. Revenue Share Range Key Offerings Strategic Positioning
DuPont ~11–14% Tedlar-based PVF films, TPT constructions Longest verified field record; premium specification anchor
Jolywood (Suzhou) Sunwatt ~9–12% Fluoropolymer and transparent films Vertically integrated with cell manufacturing
Cybrid Technologies ~7–10% Coated and coextruded constructions Scale converting capacity across Asia-Pacific
Suzhou Sveck ~6–9% Encapsulants and rear film systems Bundled materials supply to major assemblers
Coveme ~5–7% PET-based and hybrid laminates European specification depth and traceability
Toyo Aluminium K.K. ~4–6% High-barrier film systems Japanese quality positioning, moisture-barrier focus
Endurans Solar ~3–5% Non-fluoropolymer premium films Fluorine-free technology leadership
Krempel GmbH ~3–5% Insulating and composite laminates German industrial base, electrical safety expertise
Toray Advanced Film ~3–4% Polyester film substrates Upstream resin and film integration
Agfa-Gevaert ~2–4% Coated film technologies Coating chemistry heritage
Targray ~2–3% Distributed multi-source supply Supply-chain flexibility for mid-tier assemblers
Taiflex Scientific ~2–3% Flexible laminate constructions Taiwanese assembly proximity


Recent News & Developments

  • European Chemicals Agency (March 2023): Published the universal per- and polyfluoroalkyl substances restriction proposal, placing fluoropolymer encapsulation materials under formal regulatory review and prompting European utilities to request fluorine-free alternatives in tenders [19].
  • U.S. Treasury and IRS (December 2023): Issued proposed guidance on the Section 45X Advanced Manufacturing Production Credit, clarifying eligibility for domestically produced photovoltaic components and accelerating North American assembly investment decisions [18].
  • Endurans Solar (2023): Completed its transition to an independent brand focused on non-fluoropolymer premium films, positioning directly against the regulatory risk facing fluorinated constructions [23].
  • India Ministry of New and Renewable Energy (April 2024): Reinstated the Approved List of Models and Manufacturers requirement for government-supported projects, forcing localized module and materials sourcing across the Indian pipeline [16].
  • European Commission (June 2024): The Net-Zero Industry Act entered into force, establishing domestic manufacturing benchmarks and embedding resilience criteria into public renewable energy auctions [19].
  • Cybrid Technologies (2024): Expanded transparent film converting capacity in response to accelerating bifacial module adoption among utility-scale customers [23].
  • Jolywood (Suzhou) Sunwatt (2025): Advanced integrated capacity spanning cell manufacturing and rear encapsulation materials, deepening vertical integration in the Chinese supply base [23].
  • Saudi Ministry of Energy (2025): Awarded further multi-gigawatt capacity under the National Renewable Energy Program, extending the desert-climate specification pipeline through the late decade [21].


Solar Backsheet Market Report Scope

Parameter Detail
Market Scope Global Solar Backsheet Market by type, material construction, application and geography
Study Period 2021–2035 (Historical 2021–2024; Base Year 2025; Forecast 2026–2035)
CAGR 14.4% (2026–2035)
Market Size Checkpoints USD 4.15 Billion (2025); USD 4.75 Billion (2026); USD 15.91 Billion (2035)
Fastest Growing Segments Transparent constructions (18.6% CAGR); Off-grid & distributed applications (17.1% CAGR)
Companies Profiled DuPont, Jolywood (Suzhou) Sunwatt, Cybrid Technologies, Suzhou Sveck, Coveme, Toyo Aluminium K.K., Endurans Solar, Krempel GmbH, Toray Advanced Film, Agfa-Gevaert, Targray, Taiflex Scientific
Valuation Currency USD, constant 2025 basis

FAQs

What qualification testing should buyers demand from Solar Backsheet Market suppliers?
Insist on IEC 61215 damp-heat testing beyond the 1,000-hour minimum and full IEC 61730 sequential protocols. Third-party certificates from accredited laboratories carry far more weight with lenders than supplier-generated datasheets [11].
How should procurement teams evaluate the fluoropolymer price premium?
Fluoropolymer constructions typically carry a 15–25% premium over polyester alternatives at the material level. On 30-year utility assets, that premium is recovered through avoided replacement, but it rarely justifies itself on sub-10-year off-grid deployments [10].
Does the Solar Backsheet Market face trade defence exposure?
U.S. or EU solar anti-dumping orders do not directly cover backsheet films, but they sit inside module value chains that are. Origin documentation and traceability audits have become standard buyer requirements [18].
What happens to failed rear encapsulation during repowering?
Delaminated modules are replaced wholesale rather than re-laminated, because removing the rear layer damages cell interconnects. Repowering therefore generates new module demand, not retrofit film demand [7].
How does the Solar Backsheet Market intersect with recycling mandates?
European end-of-life rules require high material recovery from retired modules, and multilayer polymer laminates are the hardest fraction to separate. Suppliers piloting mono-material or delamination-friendly designs hold a regulatory advantage [19].
Which credentials signal supplier bankability to project lenders?
Lenders typically require IEC certification alongside an independent bankability assessment from a recognized technical advisor. Suppliers lacking multi-year field fleet data face measurably higher financing costs on their customers' projects .
Should developers dual-source across the Solar Backsheet Market supply base?
Yes. Single-supplier exposure has cost developers heavily when batch-level formulation defects surfaced years after commissioning. Qualifying two suppliers per module platform limits fleet-wide correlated failure risk [7].    
Author
Author Author Profile Anshula Mandaokar LinkedIn Team Lead - Research
Anshula Mandaokar holds an academic degree in Chemical Engineering and has been contributing to the field for more than 5 years. She has expertise in Market Research and Business Consulting and serves as a Team Lead for a reputed Market Research firm under the Chemicals and Materials domain spectrum. She has worked on multiple projects, generating explicit results in a quick turnaround time. Her understanding of data interpretation justifies her role as a leader.

Research Approach


Secondary Research

The secondary research process involved comprehensive analysis of regulatory filings, technical standards documentation, industry association databases, and peer-reviewed energy journals. Key sources included the International Energy Agency (IEA) Photovoltaic Power Systems Programme, International Renewable Energy Agency (IRENA) Global Energy Transformation datasets, National Renewable Energy Laboratory (NREL) Module Reliability and Backsheet Degradation Studies, US Environmental Protection Agency (EPA) Photovoltaic End-of-Life Action Plans, European Commission Joint Research Centre (JRC) Photovoltaic Status Reports, Underwriters Laboratories (UL) 1703 and IEC 61215/61730 standards databases, ASTM International photovoltaic material specifications, Solar Power Europe Market Outlook reports, Solar Energy Industries Association (SEIA) US Market Insight reports, China Photovoltaic Industry Association (CPIA) annual statistics, Japan Photovoltaic Energy Association (JPEA) shipment data, International Solar Energy Society (ISES) technical proceedings, Progress in Photovoltaics: Research and Applications, Solar Energy Materials and Solar Cells, BloombergNEF Solar Market Outlook, MRFR Solar Market Analytics, and customs trade databases from UN Comtrade and national statistical offices. These sources were used to collect installed capacity data, module production statistics, material degradation studies, regulatory compliance requirements, and competitive landscape intelligence for fluoropolymer-based backsheets (Tedlar, Kynar, TPT), non-fluoropolymer backsheets (PET, co-extruded), and advanced multilayer composite technologies.


Primary Research

To gather both qualitative and quantitative insights, supply-side and demand-side stakeholders were interviewed during the primary research phase. CEOs, CTOs of Materials Innovation, heads of regulatory compliance, and worldwide sales directors from manufacturers of solar backsheets, photovoltaic module OEMs, and suppliers of raw materials (manufacturers of PET film and fluoropolymer resin) were examples of supply-side sources. Chief procurement officers from tier-1 photovoltaic module manufacturers, technical directors from utility-scale solar EPC contractors, quality assurance leads from independent power producers (IPPs), and material scientists from photovoltaic testing labs and certification organizations were examples of demand-side sources. Primary research verified product development roadmaps for double-glass versus single-glass module architectures, validated market segmentation across material types and installation categories, and gathered information on supply chain limitations, fluorinated polymer pricing volatility, and recycling/disposal protocol adoption.

Primary Respondent Breakdown:

By Designation: C-level Primaries (30%), Director Level (35%), Others (35%)

By Region: North America (32%), Europe (28%), Asia-Pacific (35%), Rest of World (5%)


Market Size Estimation

Global market valuation was derived through production volume mapping and module gigawatt (GW) installation analysis. The methodology included:

Identification of 50+ key backsheet manufacturers across China, Japan, South Korea, Europe, North America, and India

Product mapping across fluoropolymer-based (Tedlar/PVF, Kynar/PVDF, TPT), non-fluoropolymer (PET, PA, PO), and co-extruded multilayer categories by thickness (≤300μm, 300-500μm, >500μm)

Analysis of reported and modeled annual revenues specific to photovoltaic backsheet divisions and parent company financial disclosures

Coverage of manufacturers representing 75-80% of global supply capacity in 2024

Extrapolation using bottom-up (global module production volume × backsheet area requirement × ASP by material type and region) and top-down (industry revenue validation against module manufacturing cost structures) approaches to derive segment-specific valuations across utility-scale, commercial rooftop, and residential installation end-uses

Download Free Sample

Kindly complete the form below to receive a free sample of this Report

Download PDF ×

We do not share your information with anyone. However, we may send you emails based on your report interest from time to time. You may contact us at any time to opt-out.

















