Radiotherapy Market (2026 - 2035)

Radiotherapy Market Research Report Size, Share, Trend Analysis By Technology (External Beam Radiotherapy, Brachytherapy, Systemic Radiotherapy, Intensity-Modulated Radiation Therapy, Stereotactic Radiosurgery), By Applications (Oncology, Palliative Care, Preoperative, Postoperative, Curative Treatment), By End Use (Hospitals, Cancer Research Centers, Outpatient Facilities), By Treatment Type (Conventional Radiotherapy, Radiotherapy for Targeted Therapy, Combination Therapy) and By Region (North America, Europe, South America, Asia Pacific, Middle East and Africa) - Growth Outlook & Industry Forecast 2025 To 2035
ID: MRFR/HC/0997-HCR 200 Pages Nidhi Mandole, Rahul Gotadki Last Updated: September 15, 2026
Radiotherapy Market
Market Size
Forecast Period2026-2035
CAGR (2026-2035)7.6%
2025 Market SizeUSD 9.09 Billion
2035 Market SizeUSD 18.91 Billion
Key Players
Siemens Healthineers
Elekta AB
Accuray Incorporated
Ion Beam Applications SA
Hitachi Ltd.
Brainlab AG
Opportunities
  • Software-Defined Capacity Expansion
  • Emerging-Market Fleet Buildout
  • Radioligand Therapy Commercialisation

Radiotherapy Market Summary

The Radiotherapy Market closed 2025 at USD 9.09 billion and enters the forecast window at USD 9.78 billion in 2026, climbing to USD 18.91 billion by 2035 on a 7.6% CAGR. Two catalysts anchor that trajectory: the International Atomic Energy Agency's Rays of Hope initiative, which has mobilised more than USD 100 million toward treatment capacity in under-served countries since 2022, and the steady migration of radiation cancer treatment from inpatient wards to reimbursed outpatient settings across OECD health systems [1][5].

Equipment fleets are turning over faster than at any point since the cobalt-to-linac transition. Cobalt-60 units and first-generation 3D conformal platforms are giving way to image-guided, ring-gantry accelerators paired with adaptive planning software that re-contours anatomy between fractions. Vendors now sell software refreshes rather than new vaults, and roughly 38% of installed base upgrades in 2025 involved no civil works at all [11]. Capital deferral of this kind is reshaping how the Radiotherapy Market monetises its installed fleet.

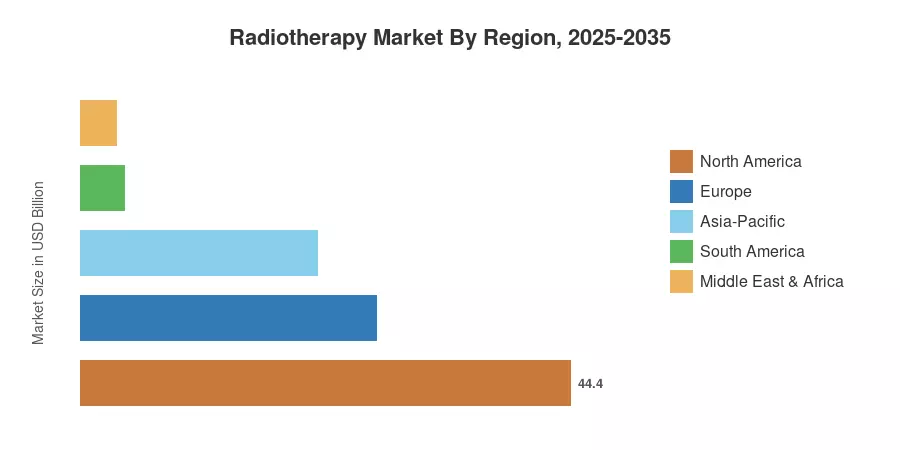
North America holds 44.4% of global revenue, supported by dense accelerator coverage and mature payer codes. Asia-Pacific compounds fastest at 9.6% through 2035 as China's national cancer plan and India's tertiary-hospital buildout add vaults. Europe, at 26.8%, remains the second-largest block but faces financing headwinds. Expect the gap between the top two regions to narrow materially after 2030.


Key Report Takeaways

• By Technology

  • Intensity-modulated radiotherapy held 33.9% of Radiotherapy Market share in 2025, the single largest technology pool.
  • Proton beam therapy is projected to advance at a 9.0% CAGR through 2035, the fastest technology trajectory tracked.
  • Image-guided radiotherapy contributed USD 1.77 billion in 2025 revenue.

• By Therapy Type

  • External beam radiation therapy accounted for 76.4% of therapy-type revenue in 2025.
  • Systemic radiotherapy is forecast to grow at an 8.4% CAGR, the strongest therapy-type expansion in the Radiotherapy Market.


• By End user


  • Hospitals and clinics represented 65.5% of end-user demand.
  • Ambulatory surgery centres post a 10.9% CAGR, the fastest end-user segment.

• By Region

  • North America captured 44.4% of global revenue in 2025.
  • Asia-Pacific expands at a 9.6% CAGR through 2035.
  • Europe generated USD 2.44 billion in 2025.


Market Size and Forecast (2021–2035)

Historical values were reconstructed from vendor equipment revenue disclosures, procurement tender databases, national accelerator registries, and treatment-volume statistics, then reconciled against installed-base counts per million population. Forecast years apply a demand model weighted for incidence growth, fractionation trends, and replacement cycles across the Radiotherapy Market.
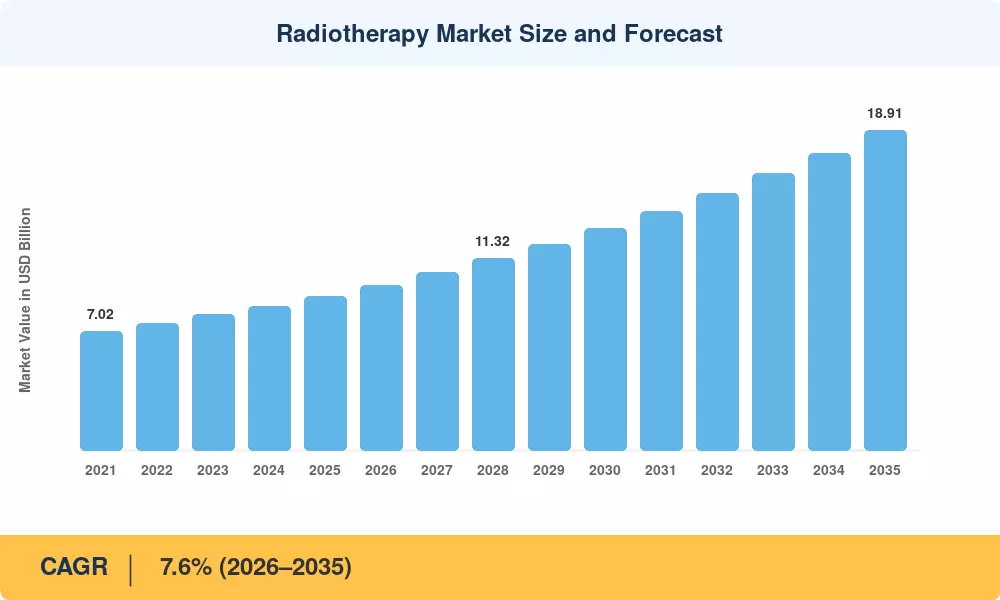
Radiotherapy Market Size and Forecast
Our Impact

Enabled $4.3B Revenue Impact for Fortune 500 and Leading Multinationals

Partnering with 2000+ Global Organizations Each Year

30K+ Citations by Top-Tier Firms in the Industry

Driver Impact Analysis

Driver ~% Impact on CAGR Geographic Relevance Impact Timeline
Rising global cancer incidence ~1.5 pp Global Long-term (≥4 yr)
National cancer control plans and public tenders ~1.3 pp Asia-Pacific Medium-term (2–4 yr)
AI-assisted contouring and adaptive planning ~1.2 pp North America, Europe Medium-term (2–4 yr)
Outpatient reimbursement and hypofractionation ~1.1 pp North America Short-term (≤2 yr)
Radiopharmaceutical approvals and payer coverage ~0.9 pp Global Long-term (≥4 yr)
Aging accelerator replacement cycle ~0.8 pp Europe, Japan Short-term (≤2 yr)
Particle therapy centre buildouts ~0.6 pp Asia-Pacific, Middle East Long-term (≥4 yr)


Cancer Incidence and the Treatment-Capacity Gap

Radiation therapy demand is rising due to an increase in cancer incidence, although treatment capacity is still inconsistent among regions. The current radiotherapy infrastructure is under pressure from growing patient volumes, aging populations, and expanding cancer screening programs, especially in emerging areas where accelerator availability is still scarce. Hospitals are compelled by capacity limitations to adopt higher-throughput systems, increase treatment facilities, and optimize equipment utilization. As providers work to close the gap between patient demand and available treatment capacity, these trends encourage continued investment in linear accelerators, treatment-planning platforms, and related imaging technology.


Artificial Intelligence in Treatment Planning

According to peer-reviewed workflow studies, auto-segmentation systems have reduced the contouring time for head-and-neck plans from approximately 90 minutes to less than 15 minutes, freeing up physician hours that hospitals may use to increase throughput [3]. These modules are priced by vendors as recurring licenses, which increases software gross margins above 70% and extends the deployed fleet's revenue life. Once experimental, adaptive re-planning is now included in over one-third of new Western European tender specifications [13].


Outpatient Reimbursement and Hypofractionation

Centers for Medicare & Medicaid Services' payment policy has progressively favoured shorter courses, and ASTRO guidelines now endorse five-fraction regimens for selected breast and prostate presentations [5]. Shorter courses free vault hours, letting a single accelerator serve 15–20% more patients per year. Providers respond by upgrading rather than expanding, which channels spending toward high-precision platforms and imaging subsystems.

Public Cancer Plans Across Asia-Pacific

China's Healthy China 2030 framework targets a 15% improvement in five-year cancer survival and has underwritten hundreds of provincial accelerator installations since 2021 [9]. India's Ayushman Bharat scheme extends radiation coverage to roughly 500 million beneficiaries, pulling private hospital chains into tier-two cities [10]. Both programmes favour mid-tier linac configurations with local service footprints over flagship particle systems.


Restraints Impact Analysis

Restraint ~% Impact on CAGR Geographic Relevance Impact Timeline
Capital intensity and elevated borrowing costs ~-1.1 pp Europe, South America Medium-term (2–4 yr)
Medical physicist and therapist shortages ~-0.9 pp Global Long-term (≥4 yr)
Radioisotope supply fragility ~-0.7 pp Global Short-term (≤2 yr)
Revenue dilution from shorter treatment courses ~-0.6 pp North America Medium-term (2–4 yr)
Bunker construction and regulatory approval delays ~-0.5 pp Europe, Middle East & Africa Medium-term (2–4 yr)


Financing Costs and Deferred Capital Projects

Before staffing, single-room proton installations cost between $25 and $45 million, whereas multi-room facilities cost more than $100 million [12]. Tender award-to-installation intervals in Germany and Italy extended by an average of seven months between 2022 and 2025, and European hospital companies facing increased debt service have pushed numerous announced projects until 2028 [13]. In response, vendors have created managed-service arrangements that turn capital expenditures into operating costs.


Workforce Scarcity

Six radiation therapists and about two certified medical physicists are needed for each extra treatment vault. According to workforce surveys, accreditation pipelines add three to five years per cohort, and many African and South Asian programs run at half the recommended physicist density [4]. While the equipment can be delivered in months, the personnel needed to commission and operate it cannot.


Isotope Supply Concentration

Lutetium-177, actinium-225 and iridium-192 originate from a small set of reactors and accelerator facilities, several of which are past their design life [6]. A single unplanned outage at a major producer in 2023 delayed dosing schedules across multiple European centres. Buyers now write dual-source clauses into supply agreements, which raises unit costs but protects throughput.


Radiotherapy Market Opportunities

Software-Defined Capacity Expansion

Adaptive planning, auto-contouring and outcomes analytics let providers extract more treatments from existing vaults without civil works. Recurring licence revenue already contributes an estimated 14% of leading vendors' oncology turnover and carries margins roughly double those of hardware [11]. Expect attach-rate competition to intensify as fleets age.

Emerging-Market Fleet Buildout

Sub-Saharan Africa, Central Asia and Andean South America collectively need several hundred additional accelerators to approach WHO coverage benchmarks [2]. Blended finance through IAEA Rays of Hope and multilateral development bank lending is beginning to close bankability gaps [1]. Vendors offering refurbished-plus-service bundles are best placed to capture first installations.

Radioligand Therapy Commercialisation

Targeted radiopharmaceuticals extend treatment into metastatic settings that external beam cannot reach. Approved prostate and neuroendocrine agents have already built dosing networks that new molecules can inherit, compressing launch timelines [6]. Nuclear pharmacy logistics, not clinical evidence, is now the binding constraint.

Outcomes Data Monetisation

Treatment planning systems accumulate dosimetry, imaging and toxicity records at scale. De-identified registries licensed to pharmaceutical sponsors for trial design and to payers for value-based contracting represent a genuine second business model, with early pilots pricing multi-site access in the low seven figures annually [15]. Governance frameworks under the EU Health Data Space will determine how quickly this scales.

Compact Particle Systems

Superconducting single-room designs have cut facility footprints by more than half against the multi-room installations of the 2010s [12]. Hospitals in Japan, Saudi Arabia, and Southeast Asia are evaluating these as replacements for planned photon expansions. Price parity with a two-vault photon build is plausible before 2032.


Radiotherapy Market Future Outlook

Autonomous Treatment Workflows

By the early 2030s, plan generation for standard presentations will be largely machine-authored with physician sign-off rather than physician-authored from scratch. Regulators are already adapting: FDA has cleared several hundred AI-enabled radiological devices, and oncology planning tools represent a growing share of that pipeline [3]. Staffing economics, not algorithm quality, will set the adoption pace.

Service Contracts as the Profit Engine

Vendors increasingly resemble subscription businesses. Multi-year uptime guarantees, software refreshes, and remote diagnostics now generate recurring revenue that exceeds equipment margin over a ten-year fleet life [11]. Hospitals gain budget predictability; suppliers gain visibility that smooths the cyclicality historically associated with the Radiotherapy Market.

Convergence with Nuclear Medicine

Radioligand pipelines will pull radiation oncology departments into closer operational alignment with nuclear medicine, sharing dosimetry expertise, hot-lab infrastructure and isotope logistics [6]. Departments that build combined capability early will capture referral volume that pure external-beam centres cannot serve. Supply security becomes a clinical planning question, not a procurement footnote.

Sustainability and Facility Energy Load

A modern accelerator vault with associated HVAC and imaging draws meaningful continuous power, and European hospital groups now include lifecycle energy disclosure in tender scoring [13]. Standby power management and heat-recovery designs are moving from differentiator to expectation. Expect environmental criteria to carry measurable weight in public awards before 2030.


Regional Market Share Analysis

Region Metric (2025) Primary Investment Themes
North America 44.4% share Fleet modernisation, adaptive software, radioligand infrastructure
Europe 26.8% share Cobalt phase-out, cross-border referral networks, managed services
Asia-Pacific 21.5% share National cancer plans, tier-two hospital buildout, domestic manufacturing
South America 4.0% share Public tender programmes, refurbished equipment, service coverage
Middle East & Africa 3.3% share Sovereign health funds, particle therapy flagships, workforce training
Total 100.0% —

Regional performance in the Radiotherapy Market splits cleanly between replacement-driven mature markets and capacity-driven growth markets. North America and Europe are refreshing installed fleets; Asia-Pacific, the Middle East, and parts of South America are adding rooms for the first time.


North America

Country Metric Key Driver
US 82.1% share of region Dense payer coverage and hypofractionation adoption
Canada 6.4% CAGR Provincial cancer agency equipment renewal cycles
Mexico USD 0.34 billion IMSS network expansion into secondary cities


The United States anchors the Radiotherapy Market through sheer installed density — roughly 12 accelerators per million people — and through payer mechanisms that reward precision delivery [5]. Canadian provincial agencies procure centrally, producing lumpy but predictable multi-unit awards. Mexico's public insurer has prioritised closing a documented north-south access gap, with new units concentrated outside the capital region.

Europe

Country Metric Key Driver
Germany 23.8% share of region Statutory insurance funding and university hospital renewal
UK 17.2% share of region NHS radiotherapy equipment replacement programme
France 15.6% share of region INCa cancer plan and regional authorisation quotas
Italy 11.4% share of region Recovery fund allocations to oncology infrastructure
Spain 9.1% share of region Amancio Ortega Foundation donation programme legacy
Nordic Countries 7.3% CAGR Adaptive planning and proton centre utilisation
Russia USD 0.13 billion Domestic manufacturing substitution
Rest of Europe 5.9% CAGR Central European cobalt-to-linac conversion


European procurement is consolidating into framework agreements that bundle equipment, service and software across multi-hospital trusts [13]. The UK's replacement programme has targeted units older than ten years, a cohort that still represents a meaningful slice of the installed base. Financing cost remains the swing variable — several announced particle projects have slipped past their original commissioning dates.

Asia-Pacific

Country Metric Key Driver
China 41.3% share of region Healthy China 2030 provincial accelerator allocations
India 11.4% CAGR Ayushman Bharat coverage and private chain expansion
Japan 18.7% share of region Heavy-ion leadership and aging fleet replacement
South Korea 9.2% share of region Tertiary hospital precision oncology investment
ASEAN 10.6% CAGR Universal coverage schemes in Thailand, Indonesia, Vietnam
Rest of Asia-Pacific USD 0.11 billion Australian and New Zealand regional service hubs


Asia-Pacific is where the Radiotherapy Market adds the most new rooms per year. China's licensing reform lifted provincial quotas on large medical equipment, unlocking a procurement wave that domestic manufacturers increasingly contest on price [9]. Japan's heavy-ion facilities remain a global reference point for clinical evidence, while India's growth rests on private operators building 30- to 60-bed oncology units in cities that previously had none [10].

South America

Country Metric Key Driver
Brazil 58.4% share of region SUS national radiotherapy expansion plan
Argentina USD 0.05 billion Provincial hospital modernisation
Rest of South America 7.9% CAGR Chilean and Colombian private network growth


Brazil's public health system has run a structured accelerator expansion programme for over a decade, and its tender specifications now routinely include service-level guarantees rather than equipment alone [14]. Currency volatility complicates multi-year contracts across the region, pushing buyers toward local-currency service agreements. Refurbished units retain a legitimate role where capital is scarce, and workloads are moderate.

Middle East & Africa

Country Metric Key Driver
Saudi Arabia 31.7% share of region Vision 2030 health sector transformation
UAE 19.4% share of region Medical tourism and flagship oncology centres
South Africa 16.2% share of region Public-private partnership treatment networks
Egypt 11.8% CAGR Presidential cancer initiative and new capital hospitals
Rest of MEA USD 0.06 billion IAEA-supported first installations


Gulf sovereign programmes fund flagship facilities that punch above regional revenue weight, including particle therapy projects tied to broader medical-tourism ambitions [12]. Sub-Saharan coverage remains the widest gap in global oncology infrastructure, with several countries still operating no accelerator at all [1]. Training partnerships bundled into procurement contracts have become the practical route to commissioning.


Radiotherapy Market By Region, 2025-2035

Radiotherapy Market Segmentation


By Product

Segment Metric (2025) Primary Demand Driver
Radiotherapy Equipment 72.4% share Fleet replacement and new-room installations
Radiotherapy Software 8.9% CAGR Adaptive planning and auto-segmentation licences
Radiotherapy Services USD 1.66 billion Multi-year uptime and applications support contracts


Equipment still carries the revenue base, but the growth story sits in the two lighter-asset lines. Software and service together now exceed a quarter of turnover and are far less exposed to hospital capital cycles.

By Technology

Segment Metric (2025) Primary Demand Driver
Intensity-Modulated Radiotherapy (IMRT) 33.9% share Standard of care across most solid tumours
Image-Guided Radiotherapy (IGRT) 19.5% share Margin reduction and inter-fraction motion control
3D Conformal Radiotherapy 14.2% share Cost-sensitive and high-volume public settings
Stereotactic Technology 8.2% CAGR Oligometastatic and cranial indications
Proton Beam Therapy 9.0% CAGR Paediatric and organ-sparing cases
Volumetric Modulated Arc Therapy USD 0.66 billion Faster delivery times per fraction
Other Technologies 4.8% CAGR Brachytherapy afterloaders and specialist platforms


IMRT remains the workhorse of the Radiotherapy Market because it balances conformality against throughput on hardware most departments already own. Stereotactic radiosurgery and its extracranial equivalents grow faster from a smaller base, driven by evidence in oligometastatic disease that has shifted treatment intent from palliative to curative in selected patients [7]. Proton adoption tracks facility construction more than clinical demand, which is why its CAGR looks steady rather than explosive.

By Therapy Type

Segment Metric (2025) Primary Demand Driver
External Beam Radiation Therapy 76.4% share Broad indication coverage and installed capacity
Brachytherapy USD 1.08 billion Cervical and prostate protocols in high-volume centres
Systemic Radiotherapy 8.4% CAGR Radioligand approvals in prostate and neuroendocrine disease


External Beam Radiation Therapy remains the dominant segment of the Radiotherapy Market because it supports a broad range of cancer indications and integrates established treatment-planning and imaging workflows across hospitals. Systemic Radiotherapy is the fastest-growing segment, supported by increasing adoption of targeted radiopharmaceutical approaches and expanding applications in metastatic cancers. Brachytherapy maintains a significant role in localized treatment, particularly where high radiation doses can be delivered directly to or near the tumour while limiting exposure to surrounding healthy tissue. Together, these modalities reflect the market’s shift toward more precise, patient-specific treatment pathways.

By Application

Segment Metric (2025) Primary Demand Driver
Breast Cancer 26.2% share Screening-driven early detection and short-course regimens
Prostate Cancer 19.4% share Aging male demographics and hypofractionated protocols
Lung Cancer 7.4% CAGR Stereotactic treatment for inoperable early-stage disease
Head & Neck Cancer 11.3% share Complex geometry favouring modulated delivery
Cervical Cancer USD 0.74 billion Brachytherapy boost as guideline standard
Colorectal Cancer 6.5% CAGR Neoadjuvant short-course adoption
Other Applications 10.3% share Sarcoma, lymphoma and palliative indications


Breast cases dominate volume because incidence is high and protocols are standardised, making them the throughput backbone of most departments [1]. Lung is the more interesting growth vector: stereotactic delivery has opened curative-intent treatment to patients previously offered only supportive care, and screening programmes are surfacing exactly that population [7].

By End User

Segment Metric (2025) Primary Demand Driver
Hospitals and Clinics 65.5% share Integrated multidisciplinary oncology pathways
Independent Radiotherapy Centres 21.9% share Focused-factory efficiency and shorter wait times
Ambulatory Surgery Centres 10.9% CAGR Outpatient reimbursement parity
Research Institutes USD 0.38 billion Trial infrastructure and novel modality development


Hospital dominance in the Radiotherapy Market reflects the reality that radiation is one node in a pathway that includes surgery, systemic therapy, and imaging. Ambulatory settings grow fastest where payers reimburse identical codes regardless of site of service, which removes the structural penalty independent operators once faced [5].


Competitive Benchmarking

Concentration is moderate. Estimated HHI sits near 1,780, with the top five suppliers holding roughly 68–72% of global revenue. Two vendors dominate photon delivery hardware, a second tier competes in particle systems and specialised platforms, and a rapidly growing pharmaceutical cohort now participates through radioligand therapies rather than capital equipment. Competitive pressure is shifting from beam specifications toward software ecosystems, service economics, and isotope supply reliability.

Company Est. Revenue Share Range Key Offerings for Radiotherapy Market Strategic Positioning
Siemens Healthineers (Varian) ~28–32% Linac platforms, adaptive therapy, oncology information systems Scale leader integrating imaging and delivery
Elekta AB ~22–26% CT-linacs, MR-linac, brachytherapy afterloaders Closest challenger with strong Europe/Asia footprint
Accuray Incorporated ~5–7% Robotic radiosurgery, helical delivery systems Niche precision specialist, China joint-venture reach
Ion Beam Applications SA ~4–6% Compact and multi-room proton systems, dosimetry Pure-play particle therapy leader
Hitachi Ltd. ~3–5% Proton and carbon-ion systems, spot scanning Engineering-led, strongest in Japan
       
Brainlab AG ~2–4% Cranial radiosurgery planning, positioning software Software-first, vendor-agnostic integration
       
Sumitomo Heavy Industries ~1–3% Particle therapy systems and cyclotrons Asia-focused capital equipment supplier
Mevion Medical Systems ~1–3% Single-room superconducting proton systems Compact-footprint cost disruptor
Curium Pharma ~1–3% Therapeutic isotopes and radiopharmacy logistics Upstream supply security specialist


Recent News & Developments

  • Siemens Healthineers / Varian (March 2024): Expanded its adaptive therapy portfolio with faster on-couch re-planning, targeting departments seeking throughput gains without new vaults [11].
  • Elekta (September 2024): Launched a next-generation CT-linac aimed at high-volume public tenders, emphasising installation speed and service uptime [11].
  • Novartis (March 2025): Secured a broadened label for its prostate radioligand therapy in pre-taxane metastatic disease, materially enlarging the addressable systemic patient pool [6].
  • IAEA (February 2024): Extended Rays of Hope anchor-centre designations to additional African and Asian countries, unlocking blended financing for first installations [1].
  • Accuray (June 2023): Obtained regulatory clearance for its robotic radiosurgery platform in China through its joint venture, opening provincial tender access [9].
  • Ion Beam Applications (November 2024): Booked multiple compact proton system orders across Asia and the Middle East, reflecting the shift toward single-room economics [12].
  • CMS (November 2024): Finalised outpatient payment updates preserving site-neutral treatment of radiation codes, stabilising planning assumptions for independent centres [5].
  • Brainlab (May 2025): Broadened vendor-agnostic planning integrations, positioning software as the neutral layer across mixed-vendor fleets [15].


Radiotherapy Market Report Scope

Parameter Detail
Market Scope Global Radiotherapy Market covering equipment, software and services across external beam, brachytherapy and systemic modalities
Study Period 2021–2035 (Historical 2021–2024; Base Year 2025; Forecast 2026–2035)
CAGR 7.6% (2026–2035)
Market Size Checkpoints USD 9.09 Billion (2025); USD 9.78 Billion (2026); USD 18.91 Billion (2035)
Fastest Growing Segments Ambulatory surgery centres (end user); proton beam therapy (technology); systemic radiotherapy (therapy type); Asia-Pacific (geography)
Companies Profiled 11 major suppliers spanning capital equipment, software and radiopharmaceuticals
Valuation Currency USD Billion

FAQs

What should procurement teams budget for lifecycle costs when entering the Radiotherapy Market?
Service contracts, software subscriptions, and physics staffing typically add 55–70% to initial capital outlay across a ten-year horizon. Vendors increasingly bundle uptime guarantees into multi-year agreements priced per treatment room [19].
How do proton and photon systems compare on daily patient throughput?
Single-room proton units treat roughly 20–25 patients per day against 35–45 for a modern photon vault. Faster gantry rotation and automated positioning are narrowing that gap [12].
Which certifications matter most when qualifying vendors in the Radiotherapy Market?
IEC 60601-2-1 accelerator safety compliance and ISO 13485 quality certification are baseline requirements. European buyers additionally require Medical Device Regulation conformity, which extends launch timelines by nine to fifteen months [8].
Can existing bunkers be reused when upgrading accelerators?
Most vaults built after 2005 accept modern linacs with minor shielding modification, saving USD 1.2–1.8 million per room. Older bunkers frequently fail neutron shielding checks for high-energy configurations [22].
What role do managed-equipment services play in the Radiotherapy Market?
They convert capital spending into operating budget, letting public hospitals add capacity without upfront borrowing. Contracts typically run eight to twelve years and bundle refresh cycles, insurance, and applications training [17].
How exposed is the supply chain to isotope disruption?
Lutetium-177 and actinium-225 depend on a handful of reactors and accelerator facilities worldwide. A single outage can delay patient dosing by weeks, so dual-source contracting is now standard practice [6].
What staffing constraints limit new installations?
Each additional treatment vault requires roughly two medical physicists and six therapists. Training pipelines in emerging economies graduate far fewer specialists than installation plans demand, pushing commissioning past twelve months [4].      
Author
Author Author Profile Nidhi Mandole LinkedIn Senior Research Analyst
She is an extremely curious individual currently working in Healthcare and Medical Devices Domain. Nidhi is comfortably versed in data centric research backed by healthcare educational background. She leverages extensive data mining and analytics tools such as Primary and Secondary Research, Statistical Analysis, Machine Learning, Data Modelling. Her key role also involves Technical Sales Support, Client Interaction and Project management within the Healthcare team. Lastly, she showcases extensive affinity towards learning new skills and remain fascinated in implementing them.
Co-Author Co-Author Profile Rahul Gotadki LinkedIn Research Manager
He holds an experience of about 9+ years in Market Research and Business Consulting, working under the spectrum of Life Sciences and Healthcare domains. Rahul conceptualizes and implements a scalable business strategy and provides strategic leadership to the clients. His expertise lies in market estimation, competitive intelligence, pipeline analysis, customer assessment, etc.

Research Approach


Secondary Research

The secondary research process involved comprehensive analysis of regulatory databases, peer-reviewed oncology journals, radiation physics publications, clinical trial registries, and authoritative health organizations. Key sources included the US Food & Drug Administration (FDA), European Medicines Agency (EMA), International Agency for Research on Cancer (IARC), American Society for Radiation Oncology (ASTRO), European Society for Radiotherapy and Oncology (ESTRO), American Association of Physicists in Medicine (AAPM), National Cancer Institute (NCI) Surveillance, Epidemiology, and End Results (SEER) Program, National Center for Biotechnology Information (NCBI/PubMed), World Health Organization (WHO) Cancer databases, Centers for Medicare & Medicaid Services (CMS) Procedure Data, Organization for Economic Co-operation and Development (OECD) Health Statistics, EU Eurostat Healthcare Database, and national cancer registries from key markets.

Regulatory clearance data for linear accelerators and brachytherapy systems, cancer incidence statistics, radiation therapy procedure volumes, clinical outcomes studies, treatment technology adoption rates, and market landscape analysis for external beam radiotherapy, brachytherapy, intensity-modulated radiation therapy (IMRT), stereotactic radiosurgery (SRS), and systemic radiotherapy treatments were all gathered from these sources.


Primary Research

To gather both qualitative and quantitative insights, supply-side and demand-side stakeholders were interviewed during the primary research process. CEOs, VPs of Engineering & Product Development, medical physicists, heads of regulatory affairs, and commercial directors from manufacturers of linear accelerators, radiation treatment software, brachytherapy devices, and afterloading system OEMs were among the supply-side sources. Board-certified radiation oncologists, chief medical physicists, heads of radiation therapy departments, directors of cancer centers, and procurement leads from community hospitals, academic medical centers, comprehensive cancer centers, and outpatient radiation oncology clinics were among the demand-side sources. Primary study gathered information on clinical workflow optimization, reimbursement coding (CPT/HCPCS) dynamics, and the integration of AI-enabled treatment planning systems. It also verified new system installation pipelines and evaluated trends in technology uptake.

Primary Respondent Breakdown:

By Designation: C-level Primaries (32%), Director Level (30%), Others (38%)

By Region: North America (38%), Europe (25%), Asia-Pacific (32%), Rest of World (5%)


Market Size Estimation

System revenue mapping, process volume analysis, and installed base computations were used to determine the global market valuation. The following were part of the methodology:

Finding more than fifty major software developers and manufacturers in Latin America, Asia-Pacific, Europe, and North America

Product mapping for radiation treatment planning software, brachytherapy afterloaders, proton therapy systems, external beam radiotherapy systems (Linacs), and quality control equipment

Examination of modeled and reported yearly revenues for the portfolios of radiotherapy services, software, and equipment

coverage of producers who will account for 70–75% of the world market in 2024

Segment-specific valuations for conventional radiotherapy, IMRT, stereotactic radiosurgery, brachytherapy, and systemic radiotherapy modalities are obtained through extrapolation using top-down (manufacturer revenue validation across hardware, software, and service segments) and bottom-up (installed base × service contract values + new system sales by country) approaches.

Download Free Sample

Kindly complete the form below to receive a free sample of this Report

Download PDF ×

We do not share your information with anyone. However, we may send you emails based on your report interest from time to time. You may contact us at any time to opt-out.

















