Permanent Magnet Motor Market (2026 - 2035)

Permanent Magnet Motor Market Research Report By Motor Type (Permanent Magnet Synchronous Motor, Brushless DC Motor, Permanent Magnet Stepper Motor, Permanent Magnet Brushed DC Motor), By Magnet Material (Neodymium Iron Boron, Ferrite, Samarium Cobalt, Alnico), By End-Use Industry (Automotive & Electric Mobility, Industrial Machinery, HVAC & Appliances, Energy & Utilities, Aerospace & Defence, Medical & Others) and By Regional (North America, Europe, South America, Asia Pacific, Middle East and Africa) - Growth & Industry Forecast to 2035
ID: MRFR/EnP/5526-HCR 111 Pages Priya Nagrale Last Updated: September 15, 2026
Permanent Magnet Motor Market
Market Size
Forecast Period2026-2035
CAGR (2026-2035)8.4%
2025 Market SizeUSD 48.6 Billion
2035 Market SizeUSD 108.9 Billion
Key Players
Nidec Corporation
ABB Ltd.
Siemens AG
Toshiba Corporation
Mitsubishi Electric
Robert Bosch GmbH
Opportunities
  • Rare-Earth-Lean and Free Architectures
  • Closed-Loop Magnet Recovery
  • Emerging-Market Industrial Retrofit

Permanent Magnet Motor Market Summary

The Permanent Magnet Motor Market reached USD 48.6 billion in 2025 and opens the forecast window at USD 52.7 billion in 2026, climbing to USD 108.9 billion by 2035 at an 8.4% CAGR. Two catalysts anchor that trajectory. The European Union's Ecodesign Regulation (EU) 2019/1781 pushed IE4 efficiency thresholds onto motors between 75 kW and 200 kW from July 2023, effectively closing the door on induction designs in mid-power industrial duty [4]. Meanwhile, global electric vehicle sales crossed 17 million units in 2024, and roughly 85% of those powertrains use permanent-magnet architectures [2].

Quietly, a substitute is occurring on factory floors. Synchronous machines can sustain torque density without the rotor slip losses of legacy squirrel-cage induction motors, the installed-base workhorse across pumps, fans and compressors. Electric motor systems are responsible for about 45% of global power use, according to the International Energy Agency, and efficiency improvements in this class are one of the most cost-effective options for decarbonization [1]. In particular, the US Department of Energy has invested USD 675 million toward critical-materials and magnet manufacturing efforts to facilitate this shift [3].


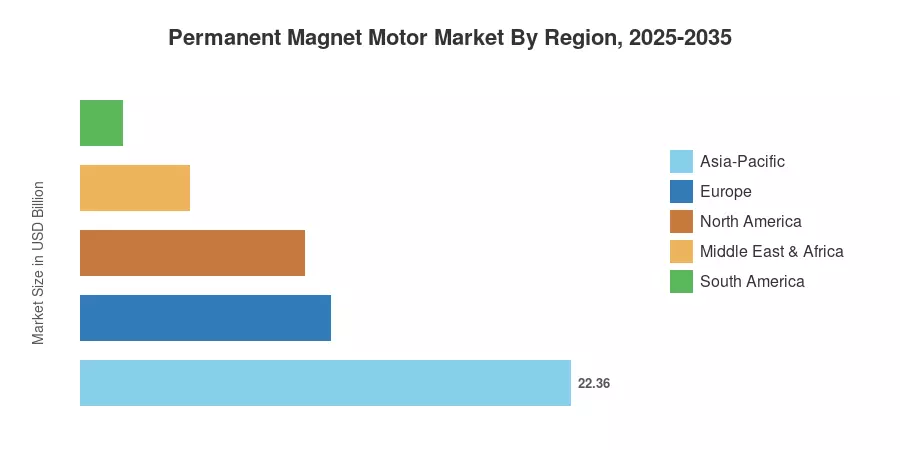
Asia Pacific leads with a 46.0% share backed by Chinese magnet processing capabilities and Japanese motor engineering depth. Middle East & Africa is the fastest-growing region with a CAGR of 10.2% as Gulf industrial diversification initiatives commission new units. Europe is in second place with around USD 11.4 billion in 2025, driven almost entirely by legislative coercion rather than voluntary upgrade cycles. How that growth is distributed will depend on the supply security of rare earths.


Key Report Takeaways

• By Technology

  • Permanent magnet synchronous motors command a 43.5% share of the Permanent Magnet Motor Market in 2025, the single largest technology block
  • Brushless DC machines are expanding at a 9.6% CAGR, the fastest technology growth rate tracked.
  • Neodymium-iron-boron magnet designs account for approximately USD 34.9 billion of 2025 revenue.

• By Sector

  • Automotive and electric mobility applications represent USD 18.7 billion of the Permanent Magnet Motor Market in 2025
  • Industrial machinery holds a 24.8% share, sustained by pump and compressor retrofit mandates.
  • HVAC and appliance demand advances at an 8.9% CAGR through 2035

• By Geography

  • Asia-Pacific holds 46.0% of global revenue, the largest regional block
  • Middle East & Africa posts the strongest regional CAGR at 10.2%
  • North America contributed roughly USD 10.2 billion in 2025


Market Size and Forecast (2021–2035)

The estimates below integrate motor shipment data from national trade statistics, rare-earth production volumes verified against magnet consumption data, and revenue disclosures from twelve publicly listed enterprises. The bottom-up unit modeling was calibrated against top-down electricity consumption benchmarks released by the International Energy Agency [1]. The Permanent Magnet Motor Market estimate assumes that there will not be prolonged rare-earth export embargoes beyond the quota tightening already announced.
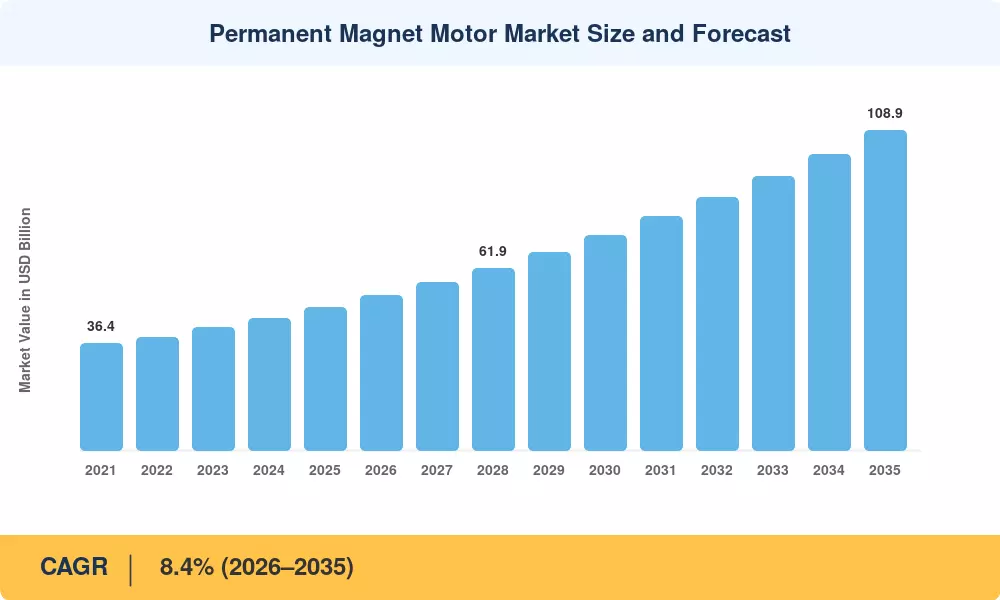
Permanent Magnet Motor Market Size and Forecast
Our Impact

Enabled $4.3B Revenue Impact for Fortune 500 and Leading Multinationals

Partnering with 2000+ Global Organizations Each Year

30K+ Citations by Top-Tier Firms in the Industry

Driver Impact Analysis

Driver ~% Impact on CAGR Geographic Relevance Impact Timeline
Vehicle electrification volumes 2.6 Global Long-term (≥4 yr)
Minimum efficiency performance standards 1.8 EU, US, China, India Short-term (≤2 yr)
Industrial automation and robotics 1.3 Asia-Pacific, Europe Medium-term (2–4 yr)
Renewable generation build-out 1.1 Global Long-term (≥4 yr)
HVAC and appliance efficiency rules 0.9 China, US, India Short-term (≤2 yr)
Aerospace and marine electrification 0.5 North America, Europe Long-term (≥4 yr)
Magnet recycling cost reduction 0.4 EU, Japan Medium-term (2–4 yr)


Electrification of Road Transport

Traction motors are the volume engine behind the Permanent Magnet Motor Market. Global EV sales reached roughly 17 million units in 2024, and the International Energy Agency projects a stock of over 250 million vehicles by 2030 under stated policies [2]. Each battery-electric passenger car consumes between 1.2 and 2.4 kg of neodymium-iron-boron magnet material. India's Production Linked Incentive scheme for automobiles allocated INR 25,938 crore to component localisation, with traction motor assemblies named among eligible advanced automotive technologies [18].

Efficiency Regulation as a Forcing Function

Regulators stopped nudging and started mandating. Ecodesign Regulation (EU) 2019/1781 required IE3 for 0.75–1000 kW motors from July 2021 and IE4 for 75–200 kW from July 2023, thresholds induction machines struggle to hit without disproportionate material cost [4]. NEMA reports that premium-efficiency compliance now covers over 80% of new North American industrial motor sales [20]. IEC 60034-30-2 extended the framework to variable-speed drive-fed machines, closing a loophole that had exempted a large share of installed capacity [21].

Renewable Generation and Direct-Drive Architectures

Wind turbine designers keep choosing permanent-magnet generators for offshore duty because gearboxes fail expensively at sea. IRENA recorded 117 GW of new wind capacity commissioned globally in 2024, with offshore representing a rising share [5]. estimates a single 15 MW direct-drive nacelle carries roughly 4 tonnes of rare-earth magnet material , making each auction round a material demand event.

Industrial Automation Density

Robotics adoption compounds motor demand because articulated arms use six or more servo axes each. Asian manufacturers installed record robot volumes through 2024, and precision positioning requires the torque-per-inertia ratio that only magnet-excited rotors deliver economically. Efficiency gains here are secondary — the purchase decision turns on dynamic response.


Restraints Impact Analysis

Restraint ~% Drag on CAGR Geographic Relevance Impact Timeline
Rare-earth price volatility and export controls 1.4 Global Short-term (≤2 yr)
Capital cost premium vs induction motors 0.8 South America, Africa Medium-term (2–4 yr)
Thermal derating and magnet ageing 0.5 Middle East, South Asia Medium-term (2–4 yr)
Drive electronics dependency and cost. 0.4 Global Short-term (≤2 yr)
Skilled maintenance workforce gaps 0.3 Africa, South America Long-term (≥4 yr)


Concentrated Rare-Earth Supply

China processed roughly 90% of global rare-earth output and controls an even larger share of sintered magnet capacity, according to USGS figures [6]. Beijing tightened its rare-earth management regulations in 2024, formalising state control over mining, smelting and export quotas [8]. Neodymium oxide prices swung more than 60% peak-to-trough between 2022 and 2024, making motor bill-of-materials forecasting genuinely difficult for OEMs signing multi-year supply agreements.

Upfront Cost Versus Payback Reality

Thermal Limits and Field Reliability

Heat is the enemy of remanence. Neodymium magnets lose coercivity as junction temperatures rise, and irreversible losses begin well before the datasheet maximum in poorly ventilated enclosures. Dysprosium additions improve tolerance but raise cost sharply, and the US Department of Energy classifies dysprosium as a critical material with severe near-term supply risk [9]. Robust PM motor demagnetization protection in the drive controller has become a specification line item rather than an afterthought.


Permanent Magnet Motor Market Opportunities

Rare-Earth-Lean and Free Architectures

Ferrite-assisted synchronous reluctance designs deliver IE4 efficiency with a fraction of the neodymium content. The EU Critical Raw Materials Act targets 25% of demand met by recycling by 2030 [7], and manufacturers positioning early on reduced-magnet topologies gain both cost insulation and procurement-desk favour.

Closed-Loop Magnet Recovery

Magnet-to-magnet recycling recovers rare earths from end-of-life motors at roughly 30% lower energy intensity than primary production. Japan's Green Innovation Fund has backed recovery pilots directly [19], and the economics improve every time export quotas tighten.

Emerging-Market Industrial Retrofit

Africa and South Asia carry enormous inventories of oversized, under-loaded induction motors. The World Bank has flagged motor-system efficiency as a high-return intervention in industrial decarbonisation lending [23]. Concessional finance that closes the capital-premium gap would unlock a genuinely large replacement pool.

Condition Monitoring as a Recurring Revenue Line

Embedded sensors turn a one-time sale into a subscription. Vibration, temperature and back-EMF signatures feed predictive maintenance platforms that vendors sell per-asset per-year, monetising data rather than hardware. Service attach rates above 20% materially change vendor economics in the Permanent Magnet Motor Market.

Aviation and Marine Electrification

Regional aircraft and short-sea shipping programs need power-density levels only magnet-excited machines reach today. The International Energy Agency's net-zero pathway assumes meaningful electrification in both segments after 2030 [12], creating a certification-gated but high-margin niche.


Permanent Magnet Motor Market Future Outlook

Material Substitution Becomes Mainstream

Engineering teams will treat neodymium content as a design variable rather than a constant. Ferrite-assisted and reduced-dysprosium topologies already reach IE4 in mid-power ranges, and the US Department of Energy's critical materials assessment explicitly prioritises substitution research alongside supply expansion [9]. Expect rare-earth intensity per kilowatt to fall meaningfully by 2032.

Software-Defined Motor Systems

Control intelligence is migrating into the motor itself. Integrated drives with embedded field-oriented control and self-tuning algorithms reduce commissioning time and enable adaptive efficiency optimisation across varying loads. This shift converts a mechanical commodity into a configurable asset and reshapes competitive positioning in the Permanent Magnet Motor Market.

The Electrification Supercycle

Demand is not one wave but several arriving together. The International Energy Agency's net-zero pathway requires electrification across transport, industrial heat and building systems simultaneously [12], and BloombergNEF projects EV share of new passenger vehicle sales exceeding half of global volume in the early 2030s [10]. Motor manufacturers face a capacity problem, not a demand problem.

Circularity and Disclosure Pressure

Corporate buyers increasingly ask where the magnets came from. EU rules will require recycled-content documentation, and lifecycle disclosure is becoming a procurement gate in the Permanent Magnet Motor Market rather than a marketing exercise [7]. Vendors with verified recovery chains will win tenders that price alone would not deliver.


Regional Market Share Analysis

Region Metric (2025) Primary Investment Themes
Asia-Pacific 46.0% share Magnet supply chain, EV traction, appliance efficiency
Europe USD 11.4 Billion Ecodesign compliance, offshore wind, recycling mandates
North America 21.0% share Reshoring incentives, data centre cooling, defence programs
Middle East & Africa 10.2% CAGR Industrial diversification, desalination pumping
South America USD 1.9 Billion Mining electrification, agricultural processing
Total USD 48.6 Billion —

Regional demand in the Permanent Magnet Motor Market tracks two variables: manufacturing intensity and regulatory stringency. Where both are high, penetration is already deep; where only one is present, growth is faster but from a smaller base.


Asia-Pacific

Country Metric Key Driver
China 54.0% of region Magnet processing and EV output
Japan USD 3.6 Billion Precision servo and robotics exports
India 11.5% CAGR Production Linked Incentive localisation
South Korea 7.2% of region Battery-adjacent powertrain supply
Rest of Asia-Pacific USD 1.8 Billion Appliance manufacturing migration


China's dominance is structural rather than incidental — magnet sintering, motor winding and vehicle assembly sit within a few hundred kilometres of each other in Jiangsu and Zhejiang. Japan retains disproportionate value capture in high-precision servo machines despite lower unit volumes [16]. India's trajectory depends on whether PLI disbursements actually convert into magnet-grade domestic capacity rather than assembly-only operations [18].

Europe

Country Metric Key Driver
Germany 31.0% of region Automotive tier-one supply base
France USD 1.4 Billion Nuclear-adjacent industrial demand
United Kingdom 8.6% CAGR Offshore wind commissioning pipeline
Italy 11.2% of region Pump and compressor manufacturing
Rest of Europe USD 2.1 Billion Nordic recycling and process industry


Regulation drives Europe more than any other region. Compliance deadlines under Ecodesign rules have compressed replacement cycles that would otherwise stretch fifteen years [4], and the Critical Raw Materials Act adds a sourcing dimension that procurement teams now audit [7]. German tier-ones have hedged by qualifying dual magnet suppliers outside China.

North America

Country Metric Key Driver
United States 82.0% of region Federal critical-materials funding
Canada USD 1.2 Billion Mining and resource processing
Mexico 9.4% CAGR Nearshored automotive assembly


Federal policy reshaped the calculus here. The Department of Energy's USD 675 million critical-materials commitment funds domestic magnet production explicitly, targeting the gap between mined feedstock and finished sintered magnets [3]. Mexico benefits from nearshoring without carrying the policy risk, and its assembly base is expanding faster than either northern neighbour.

Middle East & Africa

Country Metric Key Driver
Saudi Arabia 34.0% of region National Industrial Strategy projects
UAE USD 0.6 Billion Logistics automation and cooling
South Africa 8.8% CAGR Mining conveyor electrification
Rest of MEA 24.0% of region Water infrastructure and utilities


Saudi Arabia's National Industrial Strategy targets a substantial increase in manufacturing GDP contribution by 2030, and greenfield plants specify high-efficiency drives from day one rather than retrofitting later [24]. Desalination pumping represents a uniquely large single application in this region, where continuous duty makes the efficiency payback unambiguous.

South America

Country Metric Key Driver
Brazil 62.0% of region Domestic motor manufacturing base
Argentina USD 0.3 Billion Agricultural processing equipment
Chile 9.1% CAGR Copper mining electrification
Rest of South America USD 0.2 Billion Utility and water infrastructure


Brazil is the anomaly — it hosts genuine motor manufacturing scale rather than pure import demand, with WEG operating as a globally competitive exporter [17]. Chilean copper operations are electrifying haulage and grinding circuits, and each conversion carries substantial motor content.


Permanent Magnet Motor Market By Region, 2025-2035

Permanent Magnet Motor Market Segmentation

Segmentation in the Permanent Magnet Motor Market follows three practical axes: how the machine is commutated, what magnet material it uses, and where it ends up installed.

By Motor Type

Segment Metric (2025) Primary Demand Driver
Permanent Magnet Synchronous Motor 43.5% share EV traction and industrial duty
Brushless DC Motor 9.6% CAGR Appliances, HVAC, small automation
Permanent Magnet Stepper Motor USD 5.4 Billion Office equipment and instrumentation
Permanent Magnet Brushed DC Motor 12.2% share Automotive auxiliaries and tools


Synchronous machines dominate the Permanent Magnet Motor Market because they scale cleanly from a few kilowatts to multi-megawatt direct-drive generators without architectural change. Brushless DC designs grow faster from a lower base, riding appliance efficiency rules in China and the retirement of shaded-pole fan motors across HVAC installations [8]. The two categories increasingly blur as drive electronics converge.

By Magnet Material

Segment Metric (2025) Primary Demand Driver
Neodymium Iron Boron USD 34.9 Billion Highest energy product per unit volume
Ferrite 18.5% share Cost-sensitive, rare-earth-free designs
Samarium Cobalt 8.4% CAGR High-temperature aerospace and defence
Alnico 2.1% share Legacy and specialty sensing


Neodymium remains the default despite supply anxiety, simply because nothing else matches its energy density at comparable cost. Ferrite is recovering share as designers accept larger packages in exchange for procurement certainty, a reversal of the last two decades [6].

By End-Use Industry

Segment Metric (2025) Primary Demand Driver
Automotive & Electric Mobility USD 18.7 Billion Traction and auxiliary systems
Industrial Machinery 24.8% share Efficiency mandates and automation
HVAC & Appliances 8.9% CAGR Building energy codes
Energy & Utilities 9.8% share Direct-drive wind generators
Aerospace & Defence USD 2.4 Billion Actuation and more-electric aircraft
Medical & Others 4.6% share Imaging, pumps, surgical robotics


Automotive is the largest and least forgiving segment — programme awards run five to seven years, and pricing pressure is relentless. Industrial machinery offers better margins and steadier replacement economics, which is why several vendors have deliberately capped automotive exposure.


Competitive Benchmarking

It is moderately concentrated, with an estimated HHI of around 780 and the five largest suppliers accounting for around 34–39% of global revenues. Fragmentation continues because the needs of applications are so diverse -- a servo builder and a wind generator supplier hardly compete. Regional champions are well placed in the Permanent Magnet Motor Market where local content or service networks are more important than unit pricing.

Company Est. Revenue Share Range Key Offerings for Permanent Magnet Motor Market Strategic Positioning
Nidec Corporation ~9–12% Traction motors, appliance BLDC, precision spindles Scale leader with vertical magnet integration [13]
ABB Ltd. ~6–9% IE5 synchronous, integrated drive packages Efficiency-tier premium play [14]
Siemens AG ~5–8% Servo, industrial synchronous, digital twins Automation ecosystem bundling [15]
Toshiba Corporation ~4–6% Industrial and marine propulsion motors High-power engineering depth [16]
Mitsubishi Electric ~4–6% Servo systems, HVAC compressor motors Factory automation adjacency
Robert Bosch GmbH ~3–5% EV traction and auxiliary motors Automotive tier-one incumbency
Denso Corporation ~3–5% Traction and thermal system motors OEM-embedded supply relationships
WEG S.A. ~3–5% Industrial synchronous and generator sets Emerging-market cost leadership [17]
Regal Rexnord ~2–4% Commercial HVAC and pump motors North American channel strength
Johnson Electric ~2–4% Micro and sub-fractional motors Miniaturisation specialist


Recent News & Developments

  • Nidec (March 2024): Expanded traction motor capacity in Mexico to serve North American assembly plants, targeting nearshoring demand and shortening logistics exposure for the Permanent Magnet Motor Market [13].
  • European Commission (May 2024): Adopted the Critical Raw Materials Act with binding 2030 benchmarks for extraction, processing and recycling, directly affecting magnet sourcing strategy [7].
  • China MIIT (October 2024): Issued consolidated rare-earth management regulations formalising state control over mining and export quotas, tightening feedstock visibility for foreign buyers [8].
  • ABB (September 2024): Launched an expanded IE5 synchronous reluctance and permanent-magnet portfolio aimed at pump and fan retrofits under EU efficiency tiers [14].


  • Siemens (June 2025): Introduced integrated servo drive systems with embedded condition monitoring for high-axis-count automation cells [15].
  • WEG (November 2024): Commissioned expanded synchronous motor production in Brazil to serve mining electrification contracts across the Andean region [17].
  • Japan METI (February 2025): Extended Green Innovation Fund support to magnet-to-magnet recycling pilot facilities targeting commercial-scale recovery [19].


Permanent Magnet Motor Market Report Scope

Parameter Detail
Market Scope Global revenue from permanent-magnet excited electric machines across synchronous, brushless DC, stepper and brushed DC types, spanning automotive, industrial, HVAC, energy, aerospace and medical end uses
Study Period 2021–2035 (Historical 2021–2024; Base Year 2025; Forecast 2026–2035)
CAGR 8.4% (2026–2035)
Market Size Checkpoints USD 48.6 Billion (2025); USD 52.7 Billion (2026); USD 73.3 Billion (2030); USD 108.9 Billion (2035)
Fastest Growing Segments Brushless DC motors; HVAC & appliances; Middle East & Africa
Companies Profiled Nidec, ABB, Siemens, Toshiba, Mitsubishi Electric, Robert Bosch, Denso, WEG, Regal Rexnord, Johnson Electric, Yaskawa, Allied Motion
Valuation Currency USD, constant 2025 prices

FAQs

How should procurement teams structure magnet supply risk clauses in the Permanent Magnet Motor Market?
Insist on dual-source qualification and index-linked pricing tied to published neodymium oxide benchmarks. Fixed-price multi-year contracts without an escalation mechanism have failed repeatedly since 2022 [6].
What total cost of ownership threshold justifies switching from induction to magnet-excited motors?
Payback generally closes below four years when annual run hours exceed 4,000, and tariffs sit above USD 0.09/kWh. Below those thresholds, retrofit economics rarely justify the capital premium [22].
Do these motors require different maintenance skills than induction machines?
Yes. Technicians must handle live back-EMF at the terminals whenever the shaft rotates, which changes lockout procedures entirely. Bearing and insulation practices otherwise remain familiar [20].
Which certification standards matter most for cross-border sales in the Permanent Magnet Motor Market?
IEC 60034-30-2 governs efficiency classification for drive-fed machines and is referenced by EU, Indian and Chinese regimes. NEMA MG-1 remains the North American reference [21][20].
How does recycled magnet content affect motor performance?
Properly reprocessed sintered magnets deliver remanence within a few percent of virgin material. The constraint is feedstock collection volume, not achievable magnetic properties [19].
What integration challenges arise when retrofitting existing drive systems?
Older drives often lack the rotor position feedback or sensorless algorithms these motors need. Budget for drive replacement alongside the motor rather than assuming compatibility [21].
Where do smaller vendors realistically compete in the Permanent Magnet Motor Market?
Application-specific niches — high-temperature, submersible, explosion-proof or ultra-compact designs — where volumes are too small for scale players. Margins there run considerably above commodity ranges [14].      
Author
Author Author Profile Priya Nagrale LinkedIn Senior Research Analyst
With an experience of over five years in market research industry (Chemicals & Materials domain), I gather and analyze market data from diverse sources to produce results, which are then presented back to a client. Also, provide recommendations based on the findings. As a Senior Research Analyst, I perform quality checks (QC) for market estimations, QC for reports, and handle queries and work extensively on client customizations. Also, handle the responsibilities of client proposals, report planning, report finalization, and execution

Research Approach


Secondary Research

The secondary research process involved comprehensive analysis of technical standards databases, peer-reviewed engineering journals, industry whitepapers, and authoritative energy/transportation organizations. Key sources included the US Department of Energy (DOE) Office of Energy Efficiency and Renewable Energy, International Energy Agency (IEA), International Electrotechnical Commission (IEC), National Electrical Manufacturers Association (NEMA), European Automobile Manufacturers Association (ACEA), Japan Electrical Manufacturers Association (JEMA), China Association of Automobile Manufacturers (CAAM), Organisation Internationale des Constructeurs d'Automobiles (OICA), International Magnetic Association (IMA), US Patent and Trademark Office (USPTO), European Patent Office (EPO), IEEE Xplore Digital Library, ScienceDirect (Elsevier), Springer Nature, ResearchGate, BloombergNEF, and MRFR Energy Insights. These sources were used to collect motor efficiency standards, rare earth material pricing, automotive production statistics, industrial automation adoption rates, and competitive patent landscapes for Neodymium Iron Boron, Samarium Cobalt, Ferrite magnet technologies, and motor topologies including synchronous, brushless DC, and stepper motor architectures.


Primary Research

To gather both qualitative and quantitative information, the primary research process involved interviewing players from both the supply and demand sides. From the supply side, we heard from CEOs, VPs of manufacturing, heads of research and development, and directors of magnetic material procurement from companies that make permanent magnet motors, rare earth magnets, and original equipment manufacturers (OEMs) of motors. Members on the demand side included procurement managers from electric car, robotics, wind turbine, and HVAC system suppliers, as well as directors of automotive propulsion systems, industrial automation engineers, and developers of renewable energy projects. Market segmentation by magnet type was confirmed by primary research, electric vehicle platform timelines were uncovered, and insights on the dynamics of the rare earth supply chain, standards for testing motor efficiency, and measures to mitigate pricing volatility were gleaned.

Primary Respondent Breakdown:

• By Designation: C-level Primaries (32%), Director Level (30%), Others (38%)

• By Region: North America (32%), Europe (30%), Asia-Pacific (28%), Rest of World (10%)


Market Size Estimation

Global market valuation was derived through revenue mapping and unit shipment analysis. The methodology included:

• Identification of 50+ key manufacturers across North America, Europe, Asia-Pacific, and Latin America specializing in synchronous motors, brushless DC motors, and stepper motor technologies

• Product mapping across Neodymium Iron Boron (NdFeB), Samarium Cobalt (SmCo), and Ferrite magnet categories by cooling method (air-cooled vs. liquid-cooled)

• Analysis of reported and modeled annual revenues specific to permanent magnet motor portfolios across transportation, manufacturing, and renewable energy end uses

• Coverage of manufacturers representing 75-80% of global market share in 2024

• Extrapolation using bottom-up (unit shipment × ASP by application and region) and top-down (manufacturer revenue validation) approaches to derive segment-specific valuations for electric vehicle traction motors, industrial servo systems, and wind turbine generators

Download Free Sample

Kindly complete the form below to receive a free sample of this Report

Download PDF ×

We do not share your information with anyone. However, we may send you emails based on your report interest from time to time. You may contact us at any time to opt-out.

















