NATO Airborne Signal Intelligence Market Summary
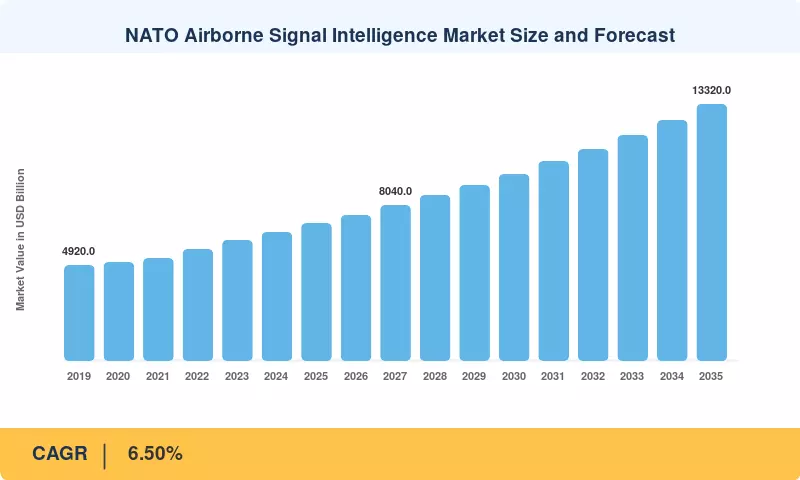
The NATO Airborne Signal Intelligence (SIGINT) Market was valued at USD 7.12 Billion in 2025. It is projected to reach USD 7.56 Billion in 2026, the first year of the forecast window, and USD 13.32 Billion by 2035, a CAGR of 6.50% over 2026–2035. The market grew from USD 4.92 billion in 2019, with the sharpest rise in 2022 (+9.26% YoY), when the security environment on NATO's eastern flank changed, and allied air forces increased ISR sortie rates and procurement [1][2]. Three structural forces sustain growth. The first is rising demand for ISR and electronic warfare (EW) support across manned and unmanned aircraft. The second is the modernization and replenishment of European and North American airborne SIGINT fleets. The third is the continued reallocation of NATO budgets toward defense capabilities as members move toward and beyond the 2% of GDP guideline [1][3].
The market is moving from single-discipline collection toward integrated, software-defined, multi-intelligence architectures. Communications Intelligence (COMINT) remains the largest SIGINT type at USD 3,062.42 Mn in 2025 (43.01% share). Multi-INT / Integrated SIGINT is the fastest-growing type at a 9.05% CAGR, reaching USD 3,226.06 Mn by 2035. Within components, Software is the fastest-growing top-level segment (7.98% CAGR), and AI & Analytics Software leads all sub-segments at 9.72%. Recent industry activity reflects this shift. Saab's March 2026 MoU with Cohere aims to bring AI into GlobalEye onboard processing [13]. L3Harris's July 2026 showcase of missionized business-jet platforms, including the EA-37B Compass Call and ARES, centered on scalable, rapidly deployable ISR and SIGINT capacity for the US and allied operators [9].
Per the Market Research Future (MRFR) model, France is the dominant region by 2025 revenue position, and the US is the fastest-growing region. This reflects France's Archange strategic SIGINT program and broad European platform recapitalization, alongside large US investment in next-generation missionized aircraft and EW platforms [3][4]. UAV-based SIGINT (9.15% CAGR) and Army end users (7.33% CAGR) show that collection is spreading below the strategic tier toward tactical and unmanned layers. Over the outlook period, competitive advantage will shift toward vendors that can deliver open-architecture, AI-enabled mission systems that interoperate across the alliance.
Key Report Takeaways
| Segment Dimension | Key Metric | Notes |
|---|---|---|
| Global Market | USD 7.12 Bn (2025) → USD 13.32 Bn (2035); 6.50% CAGR | Market nearly doubles over the forecast horizon |
| SIGINT Type – Dominant | COMINT: USD 3,062.42 Mn (2025), 43.01% share | Core of legacy strategic and tactical collection |
| SIGINT Type – Fastest | Multi-INT / Integrated SIGINT: 9.05% CAGR | Reaches USD 3,226.06 Mn by 2035 |
| Component – Dominant | Hardware: USD 4,534.85 Mn (2025), 63.69% share | RF receivers and DSP units are the largest sub-segments |
| Component – Fastest | Software: 7.98% CAGR | AI & Analytics Software sub-segment grows at 9.72% |
| Component – Services | Services: USD 1,067.86 Mn (2025), 7.13% CAGR | Upgrades (8.38%) and Training (8.24%) lead services growth |
| Platform – Dominant | Dedicated SIGINT Aircraft: USD 2,269.89 Mn (2025), 31.88% share | RC-135, Archange, PEGASUS and similar programs |
| Platform – Fastest (core) | Maritime Patrol Aircraft: 5.89% CAGR | Driven by P-8A and maritime ESM demand |
| Platform – Overlay | UAV-Based SIGINT: 9.15% CAGR | USD 1,513.62 Mn (2025) → USD 3,762.71 Mn (2035) |
| Application – Dominant | Defense Forces: USD 6,262.97 Mn (2025), 87.96% share | Air Force sub-segment alone accounts for 44.26% |
| Application – Fastest | Homeland Security & Intelligence Agencies: 6.68% CAGR | Armies sub-segment grows at 7.33% within Defense Forces |
| Competitive Structure | Top 5 players hold 52.5% combined share | L3Harris leads at 16.1% |
Market Size and Forecast (2019–2035)
Market Research Future (MRFR) derives market estimates through a combined top-down and bottom-up approach. The top-down view starts from NATO and national defense expenditure data, ISR and EW budget lines, and platform procurement plans [1][2][3][5]. The bottom-up view aggregates platform installed bases, mission-system content per aircraft, retrofit cycles and services revenue disclosed by leading vendors [14][15][16]. Figures are triangulated through primary interviews with defense procurement officials, prime contractors and subsystem suppliers. 2025 is the base year, 2019–2024 are historical, and 2026–2035 are forecast.





 Noah Malgeri
Co-Founder

 Peter Groot koerkamp
Account and Business Manager

 Younghwan Choi
Senior Retail Manager

 Mark Irwin
Management Consultant

 Akif Moroglu
Strategy & Business Development Director

 Guilherme Gomes Martins
Product Management Director

 Joseph Aguayo
Sales Operations & Pricing Manager

 La Terria Dodd
Program Support Specialist

 Rob Kooiker
Group Product Manager HVAC & Fire Protection GMA


