IT Connector Market (2026 – 2035)

IT Connector Market Size, Share and Research Report By Connector Type (PCB Connectors, Connectors, IO/High-Speed Backplane and Pluggable, RF/VSFF Connectors, Circular and Rectangular Connectors, and Microminiature Connectors), By Mounting Configuration (Board-to-Board, Wire-to-Board, and Wire-to-Wire), By Data-Rate Class (≤10 Gbps, 10–25 Gbps, 25–56 Gbps, and ≥56 Gbps PAM4), By End-User Industry (IT and Telecom Including Data Centers, Automotive and E-mobility, Industrial Automation, Medical Devices, Consumer Electronics, and Other End-user Industries), By Application (Servers and Storage, Networking and Switching Equipment, 5G/6G Base Stations, EV Powertrain/ADAS, Factory Robots, and Other Applications), By Material (Standard Thermoplastics and Halogen-Free Compounds), And By Region (North America, Europe, Asia-Pacific, And Rest Of The World) – Industry Forecast Till 2035
ID: MRFR/SEM/41226-HCR 200 Pages Nirmit Biswas, Garvit Vyas Last Updated: October 07, 2026
IT Connector Market
Market Size
Forecast Period2026-2035
CAGR (2026-2035)5.75%
2025 Market SizeUSD 8.21 Billion
2035 Market SizeUSD 14.36 Billion
Key Players
Amphenol Corporation
TE Connectivity
Molex
Foxconn Interconnect Technology
Luxshare Precision
Hirose Electric
Opportunities
  • Cabled Backplanes and Near-Chip Interconnect for AI Racks
  • India and ASEAN Electronics Manufacturing
  • Smart Connectors and Data-Driven Service Models

IT Connector Market Summary

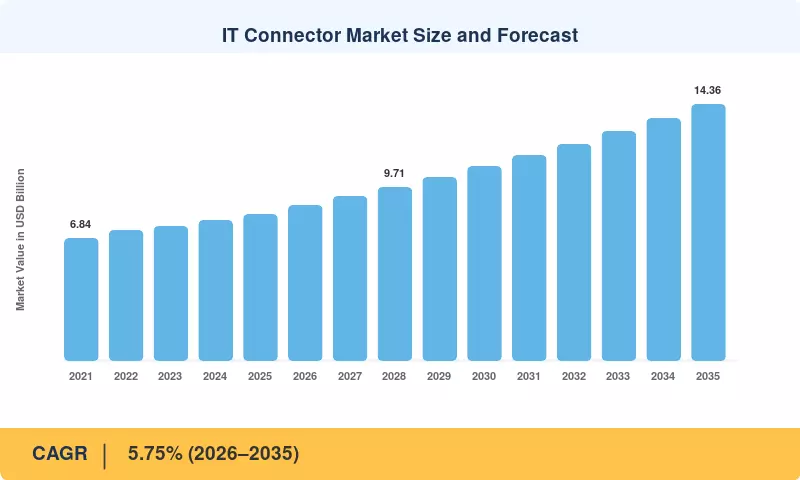
The IT Connector Market was valued at USD 8.21 Billion in 2025 and is projected to reach USD 8.68 Billion in 2026, climbing to USD 14.36 Billion by 2035 at a CAGR of 5.75% over 2026–2035. Two catalysts anchor that path. The U.S. CHIPS and Science Act committed USD 52.7 billion to domestic semiconductor capacity, pulling board assembly and its connector content back onshore [1]. At the same time, the IEA expects global data-centre electricity demand to roughly double to about 945 TWh by 2030 as AI workloads scale [2].

Inside the rack, the technology base is shifting quickly. Legacy 25G NRZ links and parallel ribbon interconnects are giving way to 112G and 224G PAM4 channels, orthogonal backplanes, and twin-ax cabled fabrics; NVIDIA's GB200 NVL72 system alone routes more than 5,000 copper cables through its spine [14]. Suppliers of high-speed data connectors now compete on insertion loss and crosstalk at 56 GHz rather than on pin count, and the IT Connector Market is being repriced around signal integrity.

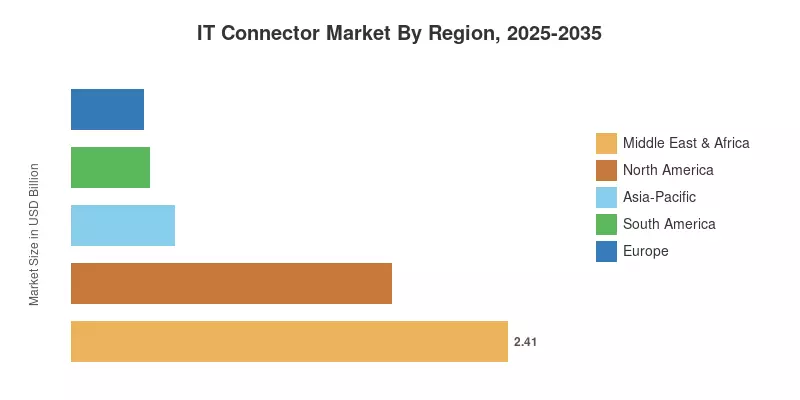
Middle East & Africa holds the largest regional position with a 29.4% share in 2025, lifted by sovereign AI campuses in Saudi Arabia and the UAE. Asia-Pacific ranks second by revenue and is the fastest-growing region at 6.9% CAGR, backed by China's server ecosystem and India's hardware incentives. North America follows, anchored by hyperscale capital spending. Over the next decade, bandwidth per port rather than unit volume will decide which suppliers gain share.

Key Report Takeaways

• By Connector Type

  • PCB Connectors lead the IT Connector Market with a 47.4% share in 2025, reflecting their presence on virtually every motherboard and storage plane.
  • IO/High-Speed Backplane and Pluggable is the fastest-expanding type at 5.92% CAGR through 2035.

• By Mounting Configuration

  • Board-to-Board holds a 37.8% share on the strength of mezzanine and card-edge designs.
  • Wire-to-Board advances at 6.45% CAGR as serviceable harnesses spread into EV battery packs and appliances.

• By Data-Rate Class

  • ≤10 Gbps retains a 50.3% share because most industrial and embedded links do not need more bandwidth.
  • ≥56 Gbps PAM4 is the fastest-growing class in the IT Connector Market at 7.31% CAGR.

• By End-user Industry

  • IT and Telecom (incl. Data Centers) accounts for 39.9% of 2025 revenue.
  • Industrial Automation grows at 6.52% CAGR as edge AI moves onto the factory floor.

• By Application

  • Servers and Storage represent 31.4% of 2025 demand.
  • 5G/6G Base-Stations compound at 6.74% CAGR on radio-unit densification.

• By Material

  • Standard Thermoplastics command a 72.8% share on cost and molding maturity.
  • Halogen-Free Compounds rise at 6.02% CAGR under RoHS and REACH pressure.

• By Region

  • Middle East & Africa is the largest region with a 29.4% share.
  • Asia-Pacific is the fastest-growing region at 6.9% CAGR.
  • North America generated USD 1.77 billion in 2025.

Market Size and Forecast (2021–2035)

Historical values for the IT Connector Market were built bottom-up from supplier revenue disclosures, distributor sell-through data, and server, switch, and base-station shipment volumes, then cross-checked top-down against annual reports of leading interconnect vendors [12][13]. Forecast values apply a calibrated growth path tied to data-centre capacity additions, interface-standard transitions, and vehicle electrification rates [2][5][11].
IT Connector Market Size and Forecast
Our Impact

Enabled $4.3B Revenue Impact for Fortune 500 and Leading Multinationals

Partnering with 2000+ Global Organizations Each Year

30K+ Citations by Top-Tier Firms in the Industry

Driver Impact Analysis

Driver ~% Impact on CAGR Geographic Relevance Impact Timeline
AI and hyperscale data-centre build-out +1.4% Global; North America, MEA, Asia-Pacific Medium-term (2–4 yr)
Transition to 112G/224G PAM4 and PCIe 7.0 +1.0% Global Long-term (≥4 yr)
5G densification and 6G readiness +0.7% Asia-Pacific, Europe Medium-term (2–4 yr)
Semiconductor and electronics reshoring incentives +0.6% North America, Europe, India Long-term (≥4 yr)
Vehicle electrification and ADAS +0.6% China, Europe, North America Long-term (≥4 yr)
Industrial automation and robotics +0.5% Asia-Pacific, Europe Medium-term (2–4 yr)
Gulf sovereign AI campuses +0.4% Middle East & Africa Short-term (≤2 yr)


AI and Hyperscale Data-Centre Build-Out

Hyperscale and AI cluster construction is the largest single growth lever. The IEA estimates data centres consumed about 415 TWh in 2024 and could need roughly 945 TWh by 2030 [2]. Each incremental megawatt of AI capacity carries far more interconnect than conventional compute, because GPU trays, scale-up spines, and liquid-cooled manifolds multiply mating points. NVIDIA's NVL72 rack, with over 5,000 copper cables, shows how one system design can redefine volume demand for cages, headers, and twin-ax assemblies [14].

Transition to 112G/224G PAM4 and PCIe 7.0

Interface standards are moving in lockstep. PCI-SIG released PCIe 7.0 in June 2025 at 128 GT/s [5], the IEEE 802.3dj task force is defining 200 Gb/s-per-lane Ethernet [6], and OIF's CEI-224G work sets channel targets for next-generation backplanes [4]. Every generation forces requalification of contact geometry, plating, and dielectric materials. That shortens replacement cycles and lifts average selling prices per port by an estimated 20–35% over the prior generation.

5G Densification and 6G Readiness

Ericsson projects 5G subscriptions will reach about 6.3 billion by 2030 [25]. Operators are compressing radio units while multiplying antenna elements, which raises demand for SN and MDC duplex fiber interfaces, blind-mate RF links, and IP-rated circular housings at the tower. Asia-Pacific accounts for most new site additions. Open RAN disaggregation adds board-level interconnect between radio, distributed, and centralized units that monolithic base stations never required.

Semiconductor and Electronics Reshoring Incentives

Industrial policy is relocating board assembly. The CHIPS and Science Act's USD 52.7 billion package [1], the EU Chips Act's €43 billion mobilization [16], and India's ₹17,000 crore PLI 2.0 scheme for IT hardware [15] all pull server, laptop, and motherboard assembly toward new geographies. Each new line qualifies local connector supply. That opens share for regional suppliers and lifts demand for fine-pitch mezzanine and board-to-board formats near the point of assembly.

Vehicle Electrification and ADAS

Global electric car sales exceeded 17 million units in 2024 [11]. Zonal architectures and Level 2+ driver assistance require multi-gigabit links between cameras, radar, and central compute, while battery packs need high-current wire-to-board interfaces. Automotive Ethernet and high-speed coaxial designs derived from data-centre products are crossing into vehicle platforms. The result is an addressable base that extends well beyond traditional IT customers into tier-one automotive supply chains.

Industrial Automation and Robotics

The IFR recorded 541,302 new industrial robot installations in 2023. Collaborative robots, autonomous mobile robots, and machine-vision cells need rugged, miniaturized connectors that survive vibration and washdown while carrying Ethernet-class data. Edge AI controllers now bring server-grade interconnect into plants that previously relied on discrete I/O, raising content per production cell.

Gulf Sovereign AI Campuses

Saudi Arabia's Public Investment Fund launched HUMAIN in May 2025 to build national AI infrastructure [23]. In Abu Dhabi, the first 1 GW Stargate UAE cluster within a planned 5 GW campus targets initial capacity in 2026 [24]. These programs concentrate very large GPU deployments into short procurement windows. That produces near-term spikes in rack-level connector orders across the Middle East & Africa.

Restraints Impact Analysis

Restraint impacts are directional estimates of downward pressure on the IT Connector Market growth rate. Like the drivers, they overlap and should not be summed against the headline CAGR.

Restraint ~% Impact on CAGR Geographic Relevance Impact Timeline
Copper and precious-metal price volatility −0.5% Global Short-term (≤2 yr)
Tariffs and trade fragmentation −0.4% North America, China Short-term (≤2 yr)
Copper reach limits and optical substitution −0.4% Global Long-term (≥4 yr)
Halogen-free compliance and requalification costs −0.3% Europe Medium-term (2–4 yr)
Customer concentration and price erosion −0.3% Global Medium-term (2–4 yr)


Copper and Precious-Metal Price Volatility

Copper reached record levels above USD 11,000 per tonne in May 2024 [22], and gold plating costs track bullion. Contacts and shielding form a large share of connector material cost. Annual pricing agreements with OEMs leave suppliers squeezed between quarterly metal swings and fixed customer prices, particularly in commoditized PCB and families.

Tariffs and Trade Fragmentation

The USTR's four-year review of Section 301 actions raised duties on several Chinese electronics categories, including semiconductors to 50% by 2025 [21]. Connector supply chains span China, Southeast Asia, and Mexico. Tariff shifts force dual-sourcing, part requalification, and inventory buffers that delay design-ins and raise landed costs.

Copper Reach Limits and Optical Substitution

At 224G per lane, passive copper reach shrinks to roughly one to two metres [4]. Co-packaged optics and linear-drive pluggables could displace some electrical cages and backplane links in the 2030s. Incumbent copper portfolios lose volume unless suppliers pivot toward optical ferrules and hybrid assemblies.

Halogen-Free Compliance and Requalification Costs

RoHS Directive 2011/65/EU and REACH restrictions on brominated flame retardants are pushing resin changes [7][8]. Qualifying a halogen-free compound to UL 94 V-0, then re-running mating-cycle and thermal tests, can take 12–18 months per product family. Smaller suppliers carry that engineering burden with thinner margins.

Customer Concentration and Price Erosion

A handful of hyperscalers and ODMs control most high-speed demand. Their leverage drives annual price-down requests, often 3–5%, while short platform lifecycles compress tooling payback. Scale players such as Amphenol and TE Connectivity absorb this pressure [12][13]; mid-tier vendors find it harder.

IT Connector Market Opportunities

Cabled Backplanes and Near-Chip Interconnect for AI Racks

Flyover and overpass topologies route signals directly from beside the ASIC to front-panel or backplane cages, eliminating lossy PCB traces. As racks move to 224G lanes, suppliers selling near-chip connectors, twin-ax bundles and certified channel models all capture system-level content, not just single parts. These cable assembly techniques offer larger margins than discrete headers and lead to stickier design successes.


India and ASEAN Electronics Manufacturing

India’s PLI 2.0 plan for IT hardware [15] is bringing in laptop and server assembly, while Vietnam, Malaysia and Thailand are taking up PC and networking manufacturing, moving from China. Local supplies of connectors are thin, leaving room for regional operations and collaborative partnerships. India’s 9.1% CAGR is one of the most appealing country chances in the IT Connector Market.


Smart Connectors and Data-Driven Service Models

Operators can include temperature and current sensing in connectors to anticipate problems in power shelves, busbars and EV chargers before they cause downtime. Suppliers might bundle telemetry dashboards, digital twins of channel performance and configuration tools as subscription services. It turns a one-time component sale into ongoing revenue and gives vendors usage data to improve future designs.


Halogen-Free Material Leadership

EU regulation is tightening limits on halogenated flame retardants [7][8], and automotive OEMs increasingly specify halogen-free housings. Vendors that pre-qualify compounds to UL 94 V-0 and publish full material declarations can shorten customer approval cycles. The material shift is expanding at 6.02% CAGR.

Gulf and African Data-Centre Localization

Saudi Arabia and the UAE are building multi-gigawatt AI campuses [23][24], and South Africa and Egypt are adding colocation capacity for regional cloud regions. Local assembly, kitting, and field-support centres near these sites can win share from importers by cutting lead times.

IT Connector Market Future Outlook

AI Fabrics Redefine Rack Architecture

Scale-up GPU domains are driving the IT Connector Market to rack-as-a-system designs, where copper spines, cabled backplanes and liquid-cooled manifolds are co-engineered. By 2030, electricity demand from data centers is projected to be approximately 945 TWh [2], and the distribution of power and signals will be merged into integrated assemblies. The way forward will be vendors who can authenticate entire channels, not just individual sections.


The Copper–Optics Boundary Moves

Copper will continue to dominate intra-rack linkages through 2030 due to lower cost and power. Co-packaged optics will pull additional traffic to fiber, starting with switch-to-switch links, beyond 224G per lane [4][6]. The boundary is moving, and best equipped to retain content are suppliers with electrical and optical portfolios.


Electrification Brings IT-Grade Interconnect to Vehicles and Factories

EV sales above 17 million units in 2024 [11] and more than 4 million operating industrial robots [10] show how far compute has moved to the edge. Zonal vehicle networks and AI-enabled production cells will adopt multi-gigabit connectors originally designed for servers, broadening the customer base for data-centre suppliers.

Sustainability and Material Disclosure

Regulators and OEMs are asking for full material declarations, halogen-free housings, and recyclable designs [7][8]. Product-level carbon reporting will become a procurement criterion by the early 2030s. Suppliers that publish verified footprints and reduce precious-metal plating will win preference on sustainability-scored tenders.

Regional Market Share Analysis

Region Metric (2025 share / 2025 USD / 2026–2035 CAGR) Primary Investment Themes
North America USD 1.77 Billion (2025) Hyperscale AI clusters, CHIPS Act reshoring
Europe 4.9% (CAGR 2026–2035) EV platforms, RoHS-driven material change
Asia-Pacific 6.9% (CAGR 2026–2035) Server and PC assembly, 5G densification
South America 5.2% (CAGR 2026–2035) Telecom upgrades, regional colocation
Middle East & Africa 29.4% (share) Sovereign AI campuses, Gulf data-centre build-out
Total USD 8.21 Billion (2025) —

Regional demand in the IT Connector Market follows data-centre capital spending, electronics assembly footprints, and telecom rollout schedules. Middle East & Africa leads on concentrated AI campus investment, while Asia-Pacific grows fastest on manufacturing depth.


North America

Country Metric (share of region / USD / CAGR) Key Driver
US 79.2% (share of region) Hyperscale AI capex and CHIPS Act fabs
Canada USD 0.18 Billion (2025) Colocation growth around Montreal and Toronto
Mexico 6.6% (CAGR 2026–2035) Nearshored server and automotive harness assembly


North America's demand is shaped by a few hyperscalers whose AI programs set specifications for the rest of the world. CHIPS Act funding [1] is restoring domestic board assembly, which favors suppliers with U.S. plants. Mexico gains from nearshoring as ODMs shift server and automotive harness lines south of the border to avoid Section 301 exposure [21].

Europe

Country Metric (share of region / USD / CAGR) Key Driver
Germany 24.6% (share of region) Automotive electronics and industrial automation
UK USD 0.21 Billion (2025) Data-centre clusters around London
France 4.6% (CAGR 2026–2035) Telecom and aerospace programs
Italy 9.8% (share of region) Factory machinery and robotics
Spain 5.0% (CAGR 2026–2035) New hyperscale regions near Madrid
Nordic Countries USD 0.10 Billion (2025) Low-carbon data-centre campuses
Russia 5.1% (share of region) Domestic substitution of imported hardware
Rest of Europe 4.2% (CAGR 2026–2035) Electronics assembly in Central Europe


Europe grows more slowly than the global average, but its regulatory weight is outsized. RoHS and REACH [7][8] are steering material choices well beyond EU borders, and the EU Chips Act [16] is funding new fab and packaging capacity. Germany's automotive base anchors demand for high-speed vehicle links, while the Nordic Countries attract energy-hungry AI campuses with renewable power.

Asia-Pacific

Country Metric (share of region / USD / CAGR) Key Driver
China 44.8% (share of region) Server, PC, and EV manufacturing scale
India 9.1% (CAGR 2026–2035) PLI 2.0 for IT hardware
Japan USD 0.33 Billion (2025) Precision connector design and robotics
South Korea 9.6% (share of region) Memory, displays, and 5G infrastructure
ASEAN 8.2% (CAGR 2026–2035) Relocated PC and networking assembly
Rest of Asia-Pacific USD 0.12 Billion (2025) Australian and Taiwanese data centres


Asia-Pacific combines the world's deepest electronics manufacturing base with the largest 5G footprint [25]. China remains dominant, though trade friction is pushing incremental capacity into India and ASEAN. India's PLI 2.0 scheme [15] targets server and laptop assembly, and Japanese suppliers such as Hirose and JAE continue to lead in fine-pitch and miniature designs.

South America

Country Metric (share of region / USD / CAGR) Key Driver
Brazil 55.3% (share of region) Cloud regions in São Paulo and 5G rollout
Argentina 4.8% (CAGR 2026–2035) Telecom network modernization
Rest of South America USD 0.09 Billion (2025) Chilean and Colombian colocation


South America is a smaller, import-dependent region. Brazil hosts most hyperscale investment and has auctioned 3.5 GHz spectrum for 5G, creating steady demand for radio and transport equipment. Currency volatility and import duties raise landed costs, which favors distributors holding local inventory.

Middle East & Africa

Country Metric (share of region / USD / CAGR) Key Driver
Saudi Arabia 31.5% (share of region) HUMAIN and national AI infrastructure
UAE 6.7% (CAGR 2026–2035) Stargate UAE campus in Abu Dhabi
South Africa USD 0.27 Billion (2025) Cloud regions and colocation hubs
Egypt 6.2% (CAGR 2026–2035) Subsea cable landings and data centres
Rest of MEA 22.0% (share of region) Qatar, Kenya, and Nigeria digital programs


Middle East & Africa leads the IT Connector Market on the scale of its sovereign AI commitments. Saudi Arabia's HUMAIN [23] and the UAE's 5 GW Abu Dhabi campus [24] channel very large GPU orders through short procurement cycles. Egypt's role as a subsea cable hub and South Africa's cloud regions add steadier, colocation-driven demand.

IT Connector Market By Region, 2025-2035

IT Connector Market Segmentation

By Connector Type

Segment Metric (2025 share / 2025 USD / 2026–2035 CAGR) Primary Demand Driver
PCB Connectors 47.4% (share) Motherboards, storage planes, industrial controllers
Connectors USD 0.62 Billion (2025) Low-cost ribbon links in legacy equipment
IO/High-Speed Backplane and Pluggable 5.92% (CAGR) QSFP-DD 800 and OSFP cages for AI switching
RF/VSFF Connectors 8.9% (share) 5G small cells and fiber-dense racks
Circular and Rectangular Connectors USD 0.66 Billion (2025) Harsh-duty industrial controls
Microminiature Connectors 6.1% (share) Surgical robotics and small satellites


Across the IT Connector Market, PCB Connectors lead because almost every circuit board needs board-mounted headers, sockets, and mezzanine interfaces, and reshoring incentives [1] are lifting domestic demand for fine-pitch formats. IO/High-Speed Backplane and Pluggable grows fastest as data centres upgrade to 112 Gbps-per-channel cages. RF/VSFF Connectors gain from 5G densification, while Microminiature Connectors find premium niches in robotic surgery and CubeSats where every millimetre counts.

By Mounting Configuration

Segment Metric (2025 share / 2025 USD / 2026–2035 CAGR) Primary Demand Driver
Board-to-Board 37.8% (share) Stacked mezzanine and card-edge sub-assemblies
Wire-to-Board 6.45% (CAGR) Serviceable harnesses in EV packs and appliances
Wire-to-Wire USD 2.08 Billion (2025) Motor drives and HVAC compressors


Mounting choices in the IT Connector Market reflect a trade-off between density and serviceability. Board-to-Board leads because stacked mezzanine and card-edge designs satisfy tight Z-height limits in laptops and switch blades. Wire-to-Board is the fastest-growing configuration as designers favor harnesses that simplify maintenance in battery packs and household appliances. Wire-to-Wire continues to serve motor drives where board space is scarce, and miniaturized sealed variants are widening its use in robotics.

By Data-Rate Class

Segment Metric (2025 share / 2025 USD / 2026–2035 CAGR) Primary Demand Driver
≤10 Gbps 50.3% (share) Industrial sensors, embedded PCs, infotainment
10-25 Gbps USD 2.14 Billion (2025) Enterprise switching and storage links
25-56 Gbps 14.2% (share) 400G networking and PCIe 5.0 platforms
≥56 Gbps PAM4 7.31% (CAGR) AI inference, NVMe-oF, 224G lanes


Data-rate demand in the IT Connector Market remains bottom-heavy by volume. The ≤10 Gbps class leads because most industrial sensors, infotainment units, and embedded controllers have no need for bleeding-edge bandwidth and benefit from longer cable reach. The ≥56 Gbps PAM4 class grows fastest as AI fabrics, disaggregated memory, and storage networks move to 224 Gbps lanes under OIF and IEEE roadmaps [4][6]. The middle classes bridge enterprise refresh cycles.

By End-user Industry

Segment Metric (2025 share / 2025 USD / 2026–2035 CAGR) Primary Demand Driver
IT and Telecom (incl. Data Centers) 39.9% (share) Cloud expansion and campus backbone refresh
Automotive and E-mobility USD 1.44 Billion (2025) ADAS sensor links and battery connectors
Industrial Automation 6.52% (CAGR) Edge AI, cobots, machine vision
Medical Devices 6.8% (share) Imaging and surgical robotics
Consumer Electronics USD 1.31 Billion (2025) Laptops, gaming, and wearables
Other End-user Industries 5.8% (share) Aerospace, defense, and energy


By end user, the IT Connector Market is anchored by IT and Telecom (incl. Data Centers), where hyperscalers' preference for ODM hardware generates high-volume orders for cages, mezzanines, and twin-ax assemblies. Industrial Automation is the fastest-growing industry as edge AI controllers bring server-grade interconnect into plants [10]. Automotive and E-mobility add value through ADAS camera and radar links, and Medical Devices rewards suppliers with certified, miniaturized designs.

By Application

Segment Metric (2025 share / 2025 USD / 2026–2035 CAGR) Primary Demand Driver
Servers and Storage 31.4% (share) AI super-clusters and edge nodes
Networking and Switching Equipment USD 1.68 Billion (2025) 800G and 1.6T switch upgrades
5G/6G Base Stations 6.74% (CAGR) Radio-unit compression and higher antenna counts
EV Powertrain / ADAS 11.6% (share) Zonal architectures and high-current packs
Factory Robots USD 0.74 Billion (2025) Hot-swap servo drives in cobots
Other Applications 15.5% (share) PCs, test equipment, and peripherals


Application demand in the IT Connector Market centers on Servers and Storage, where colocation facilities, regional edge sites, and AI clusters rely on high-speed cages and orthogonal backplanes to balance cost and upgradability. 5G/6G Base-Stations grow fastest as operators shrink radio footprints and adopt SN and MDC duplex fiber connectors in remote radio heads [25]. EV Powertrain / ADAS and Factory Robots follow, with collaborative arms adopting modular connectors for hot-swap servo drives.

By Material

Segment Metric (2025 share / 2025 USD / 2026–2035 CAGR) Primary Demand Driver
Standard Thermoplastics 72.8% (share) Established molding cycles and low cost
Halogen-Free Compounds 6.02% (CAGR) RoHS and REACH limits on halogens


Material selection in the IT Connector Market is shifting gradually. Standard Thermoplastics lead because of proven molding cycles, broad supplier bases, and cost advantages in high-volume parts. Halogen-Free Compounds are the faster-growing material as RoHS and REACH tighten limits on brominated flame retardants [7][8], and suppliers such as TE Connectivity and BizLink run conversion programs. Rapid UL 94 V-0 qualification is becoming a design-in advantage on EU automotive platforms.

Competitive Benchmarking

The IT Connector Market shows medium concentration, with an estimated HHI of roughly 1,150–1,350 and the top five suppliers holding an estimated 52–56% of revenue. Amphenol and TE Connectivity lead on breadth and scale [12][13], while Japanese, Taiwanese, and Chinese vendors compete strongly in fine-pitch, consumer, and server-cable niches. The long tail remains fragmented across regional specialists.

Company Est. Revenue Share Range Key Offerings for IT Connector Market Strategic Positioning
Amphenol Corporation ~14–18% High-speed backplane, pluggable I/O, twin-ax cable Scale leader expanding via acquisitions in data-centre interconnect
TE Connectivity ~11–14% Server I/O, board-to-board, automotive data links Broad portfolio spanning IT, automotive, and industrial
Molex (Koch Industries) ~8–11% Mezzanine, near-ASIC, QSFP-DD and OSFP cages Strong hyperscaler co-design relationships
Foxconn Interconnect Technology ~5–8% Server cable assemblies, CPU sockets, I/O Vertical integration with ODM server assembly
Luxshare Precision ~4–7% Copper cable assemblies, high-speed connectors Fast-rising supplier for AI rack cabling
Hirose Electric ~3–5% Fine-pitch board-to-board, FPC connectors Precision miniaturization specialist
Japan Aviation Electronics (JAE) ~2–4% Automotive and industrial high-speed connectors Strong in vehicle and mobile platforms
Samtec ~2–4% High-speed board-to-board, flyover cable systems Signal-integrity engineering and quick-turn service
BizLink ~2–3% Cable assemblies and halogen-free jacketing Growing role in data-centre and EV harnesses
Yamaichi Electronics ~1–2% Test sockets and high-speed connectors Niche leader in semiconductor test interfaces
Smiths Interconnect ~1–2% Ruggedized RF and high-reliability connectors Defense, space, and medical focus
Aptiv ~1–2% Automotive high-speed data connectors Zonal architecture and vehicle Ethernet supplier


Recent News & Developments


  • European Commission (September 2023): The European Chips Act entered into force, mobilizing more than €43 billion for semiconductor capacity that will pull board-level connector demand into the EU. [16]
  • NVIDIA (March 2024): Unveiled the GB200 NVL72 rack with a copper cable spine of more than 5,000 cables, setting a reference design for rack-scale interconnect volume. [14]
  • Amphenol (May 2024): Completed its roughly USD 2 billion acquisition of Carlisle Interconnect Technologies, strengthening high-reliability and harsh-environment offerings. [19]
  • USTR (May 2024): Concluded the four-year Section 301 review, raising tariffs on several Chinese electronics categories and accelerating supply-chain diversification. [21]
  • PCI-SIG (June 2025): Released the PCIe 7.0 specification at 128 GT/s, triggering a new connector and cable qualification cycle for servers. [5]
  • Ultra Ethernet Consortium (June 2025): Published UEC Specification 1.0 for AI and HPC networking, reinforcing demand for high-bandwidth Ethernet interconnect. [17]
  • Amphenol (August 2025): Agreed to acquire CommScope's Connectivity and Cable Solutions business for about USD 10.5 billion, deepening its fiber and data-centre interconnect reach. [18]

IT Connector Market Report Scope

Parameter Details
Market Scope IT Connector Market covering connectors and related assemblies for IT, telecom, automotive, industrial, medical, and consumer applications
Study Period 2021–2035 (Historical: 2021–2024; Base Year: 2025; Forecast: 2026–2035)
CAGR 5.75% (2026–2035)
Market Size checkpoints USD 8.21 Billion (2025); USD 8.68 Billion (2026); USD 11.48 Billion (2031); USD 14.36 Billion (2035)
Fastest Growing Segments ≥56 Gbps PAM4; 5G/6G Base-Stations; Industrial Automation; Wire-to-Board
Companies Profiled Amphenol, TE Connectivity, Molex, Foxconn Interconnect Technology, Luxshare Precision, Hirose Electric, JAE, Samtec, BizLink, Yamaichi Electronics, Smiths Interconnect, Aptiv
Valuation Currency USD Billion

FAQs

What should buyers check when qualifying suppliers in the IT Connector Market?
Ask for validated channel models and insertion-loss and crosstalk data at the target Nyquist frequency. Footprint-compatible second sources reduce supply risk without board re-spins [4].
How do multi-source agreements shape competition in the IT Connector Market?
Agreements such as QSFP-DD and OSFP publish shared mechanical and electrical specifications. Several vendors can then build interchangeable cages, so competition shifts toward yield, delivery reliability, and thermal performance.
Is copper or optics the better bet for rack-scale AI interconnect?
Copper stays cheaper and lower-power within a rack, roughly up to two metres at 224G. Optics wins between racks, so the IT Connector Market will serve hybrid architectures through the early 2030s [4].
Which certification hurdles slow connector adoption in medical devices?
Medical OEMs require ISO 13485 quality systems, biocompatibility testing, and sterilization resistance for patient-contact parts. Any material change can add a year of requalification.
How does liquid cooling affect demand in the IT Connector Market?
Direct-to-chip cooling adds quick-disconnect fluid couplings and blind-mate manifolds to racks. Nearby electrical connectors also need sealing and corrosion resistance against condensation.
How can procurement teams avoid counterfeit connectors?
Source through franchised distributors and require certificates of conformance with lot traceability. Defense programs often add AS6081-style inspection for any independent-distributor purchase, a practice spreading across the IT Connector Market.
Which emerging use case could add connector demand after 2030?
Quantum computers need cryogenic RF and high-density coaxial interconnects operating near absolute zero. Volumes stay small, but high unit values favor specialist suppliers. IT CONNECTORS REPORT ID: MRFR-SE-42892 FORECAST 2026–2035
Author
Author Author Profile Nirmit Biswas LinkedIn Senior Research Analyst
With 5+ years of expertise in Market Intelligence and Strategic Research, Nirmit Biswas specializes in ICT, Semiconductors, and BFSI. Backed by an MBA in Financial Services and a Computer Science foundation, Nirmit blends technical depth with business acumen. He has successfully led 100+ projects for global enterprises and startups, including Amazon, Cisco, L&T and Huawei, delivering market estimations, competitive benchmarking, and GTM strategies. His focus lies in transforming complex data into clear, actionable insights that drive growth, innovation, and investment decisions. Recognized for bridging engineering innovation with executive strategy, Nirmit helps businesses navigate dynamic markets with confidence.
Co-Author Co-Author Profile Garvit Vyas LinkedIn Vice President - Operations
Garvit Vyas is a Research Analyst with experience in working across multiple industry domains in the market research sector. Over the past four years, he has been actively involved in analyzing diverse markets, gathering industry insights, and contributing to the development of comprehensive research reports. His work includes studying market trends, evaluating competitive landscapes, and supporting data-driven business insights. In the early phase of his career, Garvit worked on cross-domain research projects, which helped him build a strong foundation in market analysis, data interpretation, and industry intelligence across various sectors. Later, he transitioned into the Quality Control (QC) function, where he focuses on reviewing and refining research reports and marketing collaterals to ensure accuracy, consistency, and high editorial standards. His responsibilities include validating research data, improving report structure, and maintaining the overall quality of published content. Garvit is committed to maintaining strong research integrity and delivering reliable insights that support informed business decision-making.
Download Free Sample

Kindly complete the form below to receive a free sample of this Report

Download PDF ×

We do not share your information with anyone. However, we may send you emails based on your report interest from time to time. You may contact us at any time to opt-out.