Home Equity Lending Market (2026 – 2035)

Home Equity Lending Market Size, Share and Research Report By Product Type (Fixed Rate Loans, and Home Equity Line of Credit), By Provider (Banks, Credit Unions, Non-Banking Financial Institutions, and Others), And By Mode (Online, and Offline) – Industry Forecast Till 2035

ID: MRFR/BS/22873-HCR 200 Pages Nirmit Biswas, Aarti Dhapte Last Updated: October 07, 2026
Home Equity Lending Market
Market Size
Forecast Period2026-2035
CAGR (2026-2035)5.34%
2025 Market SizeUSD 365.2 Billion
2035 Market SizeUSD 614.3 Billion
Key Players
Bank of America
TD Bank Group
Citizens Financial Group
Wells Fargo
PNC Financial Services
U.S. Bancorp
Opportunities
  • Untapped Equity in Asia-Pacific and Emerging Markets
  • Open-Banking Data and Embedded Distribution
  • Second-Lien Securitization and Forward-Flow Capital

Home Equity Lending Market Summary

The global Home Equity Lending Market was valued at USD 365.2 Billion in 2025 and is projected to reach USD 384.6 Billion in 2026, climbing to USD 614.3 Billion by 2035 at a CAGR of 5.34% over 2026–2035. Two catalysts anchor that outlook. U.S. mortgage holders alone sit on roughly USD 11,000 Billion of tappable equity [2], and the Federal Reserve easing cycle that began in September 2024 has lowered the prime rate most revolving lines reference [6]. With first-lien refinancing uneconomic for borrowers locked into sub-4% mortgages, second mortgage lending has become the default route to household liquidity.

Lenders are retiring paper-heavy, branch-centric workflows built around full interior appraisals and manual income checks. In their place come automated valuation models, digital title and lien searches, real-time income verification, and e-closing platforms. Freddie Mac's appraisal alternatives and FHFA's June 2024 conditional approval of an agency closed-end second-lien purchase product [5][7] show secondary-market infrastructure catching up with front-end digitization, compressing approval times from weeks to days.

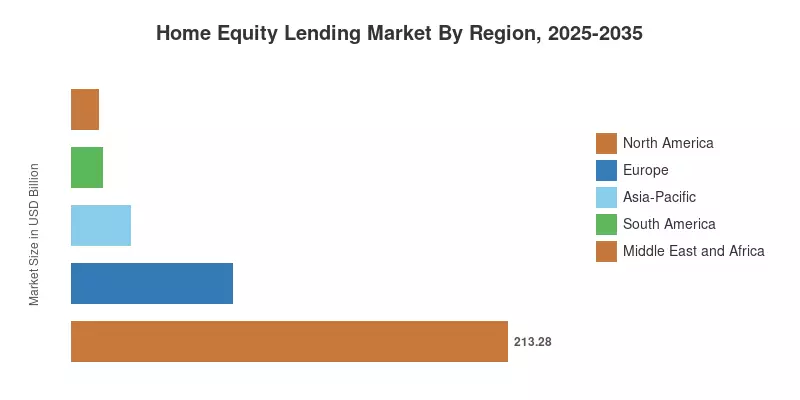
North America dominates the Home Equity Lending Market with a 58.4% share in 2025, anchored by deep U.S. equity reserves and a mature bank and credit union network. Asia-Pacific is the fastest-growing region at a 7.86% CAGR, led by Australia's redraw and offset culture and expanding property-backed credit in India. Europe ranks second, driven by renovation finance tied to building energy-efficiency mandates [20]. Over the forecast period, growth will hinge less on rate levels than on how quickly lenders convert idle equity into flexible, digitally delivered credit.

Key Report Takeaways

• By Product Type

  • Home Equity Line of Credit held a 70.5% share of the Home Equity Lending Market in 2025, reflecting borrower preference for draw-as-needed flexibility.
  • Fixed Rate Loans are projected to expand at a 3.07% CAGR through 2035 as payment-certainty seekers fund single-purpose projects.

• By Provider

  • Banks accounted for a 54.3% share in 2025, supported by deposit-funded pricing and servicing retention.
  • Non-Banking Financial Institutions are forecast to post an 8.95% CAGR, the fastest among provider types.
  • Credit Unions captured an 18.2% share, leaning on member pricing and higher CLTV tolerance.

• By Mode

  • Offline channels retained a 75.1% share in 2025 because notarization, appraisal, and disclosure rules still favor in-person closings.
  • Online origination is set to grow at a 9.14% CAGR as e-signature and remote ID verification mature.

• By Region

  • North America led the Home Equity Lending Market with a 58.4% share in 2025.
  • Asia-Pacific is the fastest-growing region at a 7.86% CAGR.
  • Europe generated USD 78.9 Billion in 2025, with the United Kingdom as its largest contributor.

Market Size and Forecast (2021–2035)

Market Research Future sized the Home Equity Lending Market on the value of credit extended each year through new originations and line draws, across revolving lines and closed-end equity products offered by banks, credit unions, and nonbank lenders. Primary inputs include central bank household credit statistics, regulatory call report data, credit bureau origination counts, and lender disclosures [1][11][16][21], validated through interviews with lending executives and servicing specialists. Historical values for 2021–2024 are reconciled against reported activity, 2025 serves as the base year, and 2026–2035 projections reflect rate, house price, and channel assumptions.
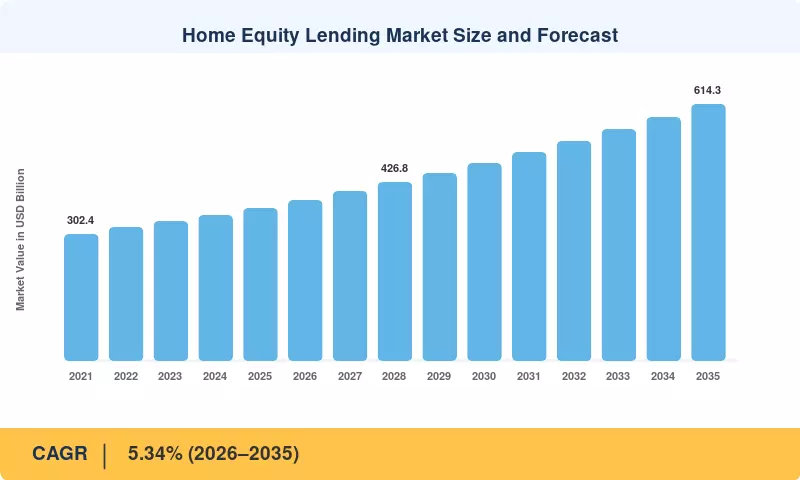
Home Equity Lending Market Size and Forecast
Our Impact

Enabled $4.3B Revenue Impact for Fortune 500 and Leading Multinationals

Partnering with 2000+ Global Organizations Each Year

30K+ Citations by Top-Tier Firms in the Industry

Driver Impact Analysis

Driver ~% Impact on CAGR Geographic Relevance Impact Timeline
Record tappable homeowner equity +1.4% North America, Europe, Australia Long-term (≥4 yr)
Mortgage rate lock-in effect +1.1% United States, Canada Medium-term (2–4 yr)
Monetary easing cycle +0.8% Global Short-term (≤2 yr)
Renovation demand and aging housing stock +0.7% North America, Europe Long-term (≥4 yr)
Debt consolidation demand +0.6% North America, South America Short-term (≤2 yr)
Digital origination and automated valuation +0.6% Global Medium-term (2–4 yr)
Agency entry into second liens +0.4% United States Medium-term (2–4 yr)


Record Tappable Homeowner Equity

U.S. mortgage holders entered 2025 with roughly USD 11,000 Billion of tappable equity, the amount available while preserving a 20% equity cushion, according to ICE's Mortgage Monitor [2]. Well under 1% of that pool is withdrawn in a typical quarter, leaving a deep reservoir for lenders to tap. Comparable equity build-ups in Canada, the United Kingdom, and Australia, where house prices rose sharply between 2019 and 2024, extend this driver well beyond the forecast midpoint.

Mortgage Rate Lock-In Effect

Monetary Easing Cycle

Federal Reserve cuts, starting with a 50-basis-point move in September 2024 and resuming in September 2025, lowered the prime rate that most revolving lines reference [6]. Because line pricing resets within a billing cycle, relief reaches borrowers faster than in any other mortgage product. Lower payments encourage higher draw utilization and new applications, a short-term effect that supports 2026–2027 volume growth even before house prices move.

Renovation Demand and Aging Housing Stock

Harvard's Joint Center for Housing Studies projects U.S. owner improvement and repair spending of about USD 500 Billion annually [9]. The median owner-occupied U.S. home is now roughly 40 years old, pushing households toward roof, HVAC, and accessibility upgrades that suit staged draws. Europe faces similar pressure from Directive (EU) 2024/1275, which requires member states to cut average residential primary energy use by 16% by 2030 [20].

Debt Consolidation Demand

U.S. credit card balances reached USD 1,210 Billion in the second quarter of 2025, with average card APRs above 20% [1]. Moving revolving card debt into a secured line priced near prime can roughly halve a borrower's interest cost, making consolidation one of the most common stated borrowing purposes. A similar logic holds in South America, where unsecured consumer rates in Brazil and Chile sit far above collateralized alternatives.

Digital Origination and Automated Valuation

Automated valuation models and property data analytics now let many lenders waive full appraisals on smaller lines. In contrast, Freddie Mac's appraisal alternatives have normalized automated collateral evaluation in the secondary market [7]. Lenders running end-to-end digital workflows report closing times falling from 30–45 days to under two weeks. Those efficiency gains cut origination costs and widen the economically viable loan-size range, particularly for balances under USD 100,000.

Agency Entry into Second Liens

FHFA's June 2024 conditional approval of Freddie Mac's closed-end second-lien purchase product introduced agency liquidity into a segment previously funded almost entirely by bank balance sheets and private securitization [5]. Even a limited pilot standardizes underwriting, documentation, and pricing benchmarks. If scaled, agency demand would lower funding costs for independent lenders and credit unions lacking deposit franchises, intensifying competition in the medium term.

Restraints Impact Analysis

Restraint ~% Impact on CAGR Geographic Relevance Impact Timeline
Prime-linked pricing and rate volatility −0.7% Global Short-term (≤2 yr)
Home price softening in select markets −0.5% United States, Canada Medium-term (2–4 yr)
Capital rules and supervisory scrutiny −0.4% United States, Europe Medium-term (2–4 yr)
Closing friction and notarization rules −0.3% United States, Europe Short-term (≤2 yr)
Household leverage and credit stress −0.3% North America, South America Long-term (≥4 yr)


Prime-Linked Pricing and Rate Volatility

The U.S. prime rate held at 7.50% for most of 2025 before the September cut [6], keeping revolving-line pricing far above the sub-4% first-lien rates many borrowers hold. Because most lines float, any reversal in policy rates passes straight into monthly payments. That exposure discourages larger draws among payment-sensitive households and caps utilization even where approved limits are generous.

Home Price Softening in Select Markets

ICE data show year-over-year home price declines spreading across more U.S. metros during 2025, concentrated in Florida, Texas, and parts of the Mountain West [2]. Falling values erode CLTV headroom and can trigger line freezes, as happened widely in 2008–2010. Canada carries similar risk, and OSFI's Guideline B-20 already limits the revolving portion of combined facilities to 65% loan-to-value [18].

Capital Rules and Supervisory Scrutiny

The 2023 U.S. Basel III endgame proposal would raise risk weights on higher-LTV residential exposures at large banks [13], while NCUA guidance in late 2024 urged credit unions to stress-test payment shock at draw-period end [8]. Heavier capital and model requirements raise the cost of holding second liens on the balance sheet, nudging some depositories toward tighter overlays or loan sales.

Closing Friction and Notarization Rules

The Mortgage Bankers Association tracks remote internet notarization legislation in more than 40 states [12], but county recording methods, title requirements and identity constraints still push many closings into physical settings. Every step in person adds days and cost. That friction can push origination expense so high for modest balances that lines under $50,000 are only marginally profitable.


Household Leverage and Credit Stress

In Q2 2025, U.S. household debt was USD 18,390 Billion, and significant delinquency transitions for credit cards and auto loans surged above pre-pandemic levels [1]. Lenders are answering with higher FICO floors and lower CLTV caps, shrinking the pool of eligible borrowers. Consumer stress over the longer term would moderate volume growth even where the housing collateral stays good.


Home Equity Lending Market Opportunities

Five opportunity areas stand out for lenders, technology providers, and investors in the Home Equity Lending Market through 2035.

Untapped Equity in Asia-Pacific and Emerging Markets

Asia-Pacific's 7.86% CAGR still leaves large white space. India's housing finance companies are expanding loan-against-property books as land records digitize, while Chinese banks are cautiously reopening property-backed consumer credit following sector stabilization measures. In Australia, redraw and offset features already normalize equity access [17], giving lenders a tested template for product design in less mature markets across the region.

Open-Banking Data and Embedded Distribution

The CFPB's Section 1033 Personal Financial Data Rights regulation [10] set up a framework for consumer-permissioned account data, and banks and aggregators are building the rails while the government reconsiders the rule. Cash-flow data enables lenders to insure self-employed and gig-economy borrowers; platforms may monetize pre-qualified equity offers embedded in banking apps and contractor checkout flows. This model moves acquisition spend from broad advertising to precision placement.


Second-Lien Securitization and Forward-Flow Capital

Since 2023, KBRA and other agencies have rated a number of nonbank-sponsored agreements, with securitizations backed by HELOCs and closed-end seconds that are rated to rise [15]. Insurers and asset managers looking for floating-rate, mortgage-backed returns are entering forward-flow agreements with originators. Lenders that create securitization-ready data tapes and servicing standards can recycle capital at a faster rate and go beyond the constraints of a balance sheet.


Green Retrofit Finance in Europe

Directive (EU) 2024/1275 requires member states to prioritize renovation of the worst-performing residential buildings [20], creating multi-year demand for heat pumps, insulation, and rooftop solar. Banks can pair equity-secured credit with preferential pricing tied to verified energy performance certificate upgrades, aligning these books with green bond eligibility criteria. The United Kingdom and Germany offer the deepest addressable bases.

Retirement Liquidity for Older Homeowners

Homeowners aged 62 and above hold about USD 14,000 Billion in housing wealth, according to the NRMLA/RiskSpan index [24], yet reverse mortgages reach only a small fraction of them. Equity lines with interest-only draws and longer repayment terms can serve retirees who want liquidity without surrendering future appreciation. Lenders combining in-branch advice with simplified digital servicing can capture this underserved cohort.

Home Equity Lending Market Future Outlook

Four themes will shape the Home Equity Lending Market over the next decade.

AI Underwriting and Automated Collateral Valuation

By 2030, machine-learning underwriting and automated valuation are likely to clear most lines below USD 250,000 without manual appraisal review. Freddie Mac's expanding appraisal alternatives [7] and the 2024 interagency quality control standards for automated valuation models set guardrails that make broader adoption defensible. Lenders that master explainable models will price risk more finely and approve applicants in hours rather than weeks.

Platform Economics and Embedded Equity Access

Distribution is moving from branch counters and broker desks to platforms where homeowners already manage money. Bank apps, personal-finance aggregators, and contractor marketplaces will embed pre-approved equity offers powered by permissioned data [10]. White-label technology providers that give community banks and credit unions fintech-grade speed will capture a growing share of the origination stack, even as balance-sheet ownership stays with depositories.

Capital Markets Depth for Second Liens

Second-lien securitization and forward-flow sales will become a primary funding channel for nonbank originators [15]. Should FHFA convert Freddie Mac's pilot into a permanent product [5], agency participation would standardize residential equity financing much as conforming loans standardized first liens. Deeper capital markets lower borrower pricing and narrow the funding advantage depositories currently enjoy.

Demographic Wealth and Retirement Liquidity

Baby boomers control the largest share of U.S. housing wealth, and the 62-plus cohort's equity alone approaches USD 14,000 Billion [24]. Between 2026 and 2035, longer lifespans and thin retirement savings will push more retirees to unlock housing wealth while aging in place. Products blending interest-only draws, longer terms, and estate-friendly features will compete directly with reverse mortgages and home equity investment contracts.

Regional Market Share Analysis

Region Key Metric Primary Investment Themes
North America 58.4% share (2025) Tappable equity, rate lock-in, agency second-lien liquidity
South America 4.1% share (2025) Collateral law reform, consolidation of high-cost consumer debt
Europe USD 78.9 Billion (2025) Further advances, energy retrofit finance
Asia-Pacific 7.86% CAGR (2026–2035) Redraw and offset products, loan against property
Middle East and Africa USD 13.1 Billion (2025) Home ownership programs, Sharia-compliant equity finance
Total USD 365.2 Billion (2025) —

North America remains the anchor of the Home Equity Lending Market, while Asia-Pacific delivers the fastest expansion. Regional differences stem from equity accumulation, product familiarity, legal frameworks for second liens, and the prevalence of floating-rate lending.


North America

Country Key Metric Key Driver
United States 91.2% of region (2025) Record tappable equity and rate lock-in
Canada 5.62% CAGR (2026–2035) Readvanceable mortgage structures


The United States generates the bulk of regional activity in the Home Equity Lending Market, with outstanding HELOC balances above USD 400 Billion in 2025 [1] and a growing closed-end segment financed by independent lenders. FHFA's second-lien pilot [5] and evolving data-access rules shape the product and distribution roadmap. Canada's growth rests on readvanceable mortgages that combine an amortizing first lien with a revolving line, though OSFI's 65% LTV cap on the revolving portion restrains limits [18].

South America

Country Key Metric Key Driver
Brazil 46.8% of region (2025) Property-secured credit expansion
Chile 6.30% CAGR (2026–2035) Bank-led mortgage refinancing


Brazil dominates regional activity, where property-secured personal credit has grown as banks and fintech platforms price it well below unsecured consumer loans. Law 14,711/2023, the Legal Framework for Guarantees, eased enforcement of fiduciary liens and allowed a single property to secure multiple loans, widening lender appetite. Chile's deep, bank-dominated mortgage market supports gradual adoption, with lenders bundling equity draws into refinancing offers.

Europe

Country Key Metric Key Driver
United Kingdom 34.5% of region (2025) Further advances and second-charge lending
Germany USD 14.2 Billion (2025) Renovation finance under energy rules
France 4.10% CAGR (2026–2035) Property-backed consumer credit


Bank of England statistics show further advances and second-charge mortgages holding a stable slice of UK lending [21], with second-charge lenders benefiting as households avoid remortgaging off low fixed rates. In Germany, land charges can be reused as security for top-up loans, which lenders increasingly direct toward retrofit projects aligned with the EU buildings directive [20]. France grows more slowly because the High Council for Financial Stability rules cap borrower debt-to-income at 35%.

Asia-Pacific

Country Key Metric Key Driver
Australia 31.0% of region (2025) Offset and redraw facilities
China 9.40% CAGR (2026–2035) Property-backed consumer credit recovery
Japan USD 8.7 Billion (2025) Equity release for older owners
India 11.20% CAGR (2026–2035) Loan against property growth


Australia holds the largest regional share because offset accounts, redraw facilities, and line-of-credit mortgages are mainstream products tracked closely by the Reserve Bank of Australia [17]. India posts the fastest growth as housing finance companies scale loan-against-property books for small business owners. China's trajectory depends on property stabilization, while Japanese lenders target older owners with equity-release structures suited to an aging population.

Middle East and Africa

Country Key Metric Key Driver
United Arab Emirates 7.10% CAGR (2026–2035) Equity release for freehold owners
Saudi Arabia 24.5% of region (2025) Vision 2030 home ownership targets
South Africa USD 3.9 Billion (2025) Access bonds and further loans


South Africa runs the most mature equity-access market in the region, where access bonds let borrowers redraw prepaid principal. Saudi Arabia benefits from Vision 2030's target of 70% home ownership, which enlarges the collateral base for Sharia-compliant equity finance. Growth in the UAE reflects freehold ownership by expatriates and central bank LTV rules permitting equity release on completed properties.

Home Equity Lending Market By Region, 2025-2035

Home Equity Lending Market Segmentation

By Product Type

Segment Key Metric Primary Demand Driver
Fixed Rate Loans 3.07% CAGR (2026–2035) Payment certainty for single-purpose projects
Home Equity Line of Credit 70.5% share (2025) Flexible draws for staged expenses


Home Equity Line of Credit products lead the Home Equity Lending Market and grow faster than closed-end alternatives because revolving draws match episodic needs such as tuition, phased renovations, solar installations, and medical bills. Interest accrues only on drawn balances, an advantage when rates are elevated. Fixed Rate Loans hold a defensive niche among borrowers who want a locked payment, while hybrid products that fix an initial tranche are blurring the boundary.

By Provider

Segment Key Metric Primary Demand Driver
Banks 54.3% share (2025) Deposit-funded pricing and cross-sell
Credit Unions 18.2% share (2025) Member pricing and higher CLTV tolerance
Non-Banking Financial Institutions 8.95% CAGR (2026–2035) Cloud-native, mobile-first underwriting
Others USD 23.7 Billion (2025) Brokers, insurers, and specialty lenders


Banks dominate the Home Equity Lending Market through low-cost deposit funding and servicing retention that deepens relationships across checking, mortgage, and wealth products. Credit Unions compete on price and often accept higher CLTVs for members. Non-Banking Financial Institutions grow fastest, using real-time income verification and automated valuations, then monetizing through securitization or forward-flow sales; FDIC research flags their reliance on warehouse lines as a liquidity risk [11].

By Mode

Segment Key Metric Primary Demand Driver
Online 9.14% CAGR (2026–2035) E-signature, remote ID, and digital closing
Offline 75.1% share (2025) Notarization, appraisals, and borrower trust


Offline channels still anchor the Home Equity Lending Market because notarization laws, physical appraisals, and borrower caution keep many closings in branches or title offices. Older homeowners, who hold the most equity, remain largely branch-oriented. Online origination grows fastest as younger borrowers start applications digitally, and leading lenders now run omni-channel journeys in which applicants upload documents by phone but sign at a title office.

Competitive Benchmarking

The Home Equity Lending Market is fragmented, with an estimated HHI below 500 and the top five providers controlling roughly 20–25% of global origination value. Large U.S. and Canadian banks hold the biggest books, but thousands of community banks and credit unions, alongside fast-growing nonbank platforms, compete regionally. Rivalry centers on approval speed, margin over prime, CLTV limits, and draw flexibility.

Company Est. Revenue Share Range Key Offerings for Home Equity Lending Strategic Positioning
Bank of America ~5–7% Equity lines with fixed-rate conversion options, digital application Deposit-led cross-sell to relationship clients [25]
TD Bank Group ~3–5% Home Equity FlexLine in Canada and U.S. equity lines Cross-border scale with readvanceable structures
Citizens Financial Group ~3–5% Equity lines and closed-end equity products Major HELOC originator in the U.S. Northeast
Wells Fargo ~3–5% Servicing of a large legacy equity portfolio Portfolio management focus after pausing new originations in 2020
PNC Financial Services ~3–4% Choice Home Equity Line of Credit Branch and digital hybrid across national footprint
U.S. Bancorp ~2–4% Equity lines and fixed-rate installment options Midwest and West relationship banking
Figure Technology Solutions ~2–4% Blockchain-recorded equity lines with fast funding White-label and partner distribution [23]
Truist Financial ~2–3% Equity lines for Southeast homeowners Regional cross-sell with wealth services
Navy Federal Credit Union ~1–3% Fixed-rate equity products and lines at high CLTVs Member-focused military community lender
Rocket Companies ~1–3% Digital second-lien equity products Recapture from a large servicing book [22]


Recent News & Developments

  • FHFA (June 2024): Granted conditional approval for Freddie Mac to purchase certain closed-end second mortgages, opening agency liquidity to second liens and setting standardized underwriting benchmarks. [5]
  • Federal Reserve (September 2024): Cut the federal funds rate by 50 basis points, the first cut of the cycle, lowering prime-linked line pricing within weeks. [6]
  • CFPB (October 2024): Finalized the Personal Financial Data Rights rule under Section 1033, enabling permissioned account data for underwriting and embedded distribution. [10]
  • NCUA (Q4 2024): Issued supervisory guidance urging credit unions to stress-test payment shock as lines move from draw to repayment periods. [8]
  • Rocket Companies (March 2025): Agreed to acquire Mr. Cooper Group in an all-stock deal, adding millions of servicing clients that form a recapture pool for equity products. [22]
  • Federal Reserve (September 2025): Resumed easing with a 25-basis-point cut after holding rates through mid-2025, supporting draw activity heading into 2026. [6]
  • Figure Technology Solutions (September 2025): Listed on Nasdaq, giving the Home Equity Lending Market a publicly traded nonbank originator focused on digital equity lines. [23]

Home Equity Lending Market Report Scope

Parameter Details
Market Scope Value of credit extended in the Home Equity Lending Market through Fixed Rate Loans and Home Equity Line of Credit products, segmented by Product Type, Provider, Mode, and Region
Study Period 2021–2035 (Historical: 2021–2024; Base Year: 2025; Forecast: 2026–2035)
CAGR 5.34% (2026–2035)
Market Size checkpoints 2025: USD 365.2 Billion; 2026: USD 384.6 Billion; 2030: USD 473.6 Billion; 2035: USD 614.3 Billion
Fastest Growing Segments Online (9.14% CAGR); Non-Banking Financial Institutions (8.95% CAGR); Asia-Pacific (7.86% CAGR)
Companies Profiled Bank of America, TD Bank Group, Citizens Financial Group, Wells Fargo, PNC Financial Services, U.S. Bancorp, Figure Technology Solutions, Truist Financial, Navy Federal Credit Union, Rocket Companies
Valuation Currency USD Billion

FAQs

How do lenders set maximum borrowing limits in the Home Equity Lending Market?
Most lenders cap combined loan-to-value at 80–85%, and some credit unions extend to 90% for prime borrowers. Automated valuation models increasingly replace full appraisals on smaller lines, cutting approval times to days [7].
Is interest on home equity borrowing tax-deductible in the United States?
Only when proceeds buy, build, or substantially improve the home securing the debt, under IRS Publication 936 rules. Interest on funds used for debt consolidation or tuition is not deductible [19].
What distinguishes the draw period from the repayment period on a line of credit?
Draws typically run 10 years with interest-only payments, followed by a 15–20-year amortizing repayment phase. That transition can double monthly payments, which is why payment-shock testing has become a supervisory focus across the Home Equity Lending Market [8].
How does a property sale affect an open line in the Home Equity Lending Market?
The outstanding balance must be repaid from sale proceeds at closing, after which the lender releases its lien. Some lenders also charge an early-closure fee if the line is terminated within the first two to three years [4].
What credit profile do lenders typically require?
Most banks look for FICO scores of 680 or higher and total debt-to-income ratios below 43%. Applicants above 740 usually secure the narrowest margins over prime and the highest CLTV limits [16].
Author
Author Author Profile Nirmit Biswas LinkedIn Senior Research Analyst
With 5+ years of expertise in Market Intelligence and Strategic Research, Nirmit Biswas specializes in ICT, Semiconductors, and BFSI. Backed by an MBA in Financial Services and a Computer Science foundation, Nirmit blends technical depth with business acumen. He has successfully led 100+ projects for global enterprises and startups, including Amazon, Cisco, L&T and Huawei, delivering market estimations, competitive benchmarking, and GTM strategies. His focus lies in transforming complex data into clear, actionable insights that drive growth, innovation, and investment decisions. Recognized for bridging engineering innovation with executive strategy, Nirmit helps businesses navigate dynamic markets with confidence.
Co-Author Co-Author Profile Aarti Dhapte LinkedIn AVP - Research
A consulting professional focused on helping businesses navigate complex markets through structured research and strategic insights. I partner with clients to solve high-impact business problems across market entry strategy, competitive intelligence, and opportunity assessment. Over the course of my experience, I have led and contributed to 100+ market research and consulting engagements, delivering insights across multiple industries and geographies, and supporting strategic decisions linked to $500M+ market opportunities. My core expertise lies in building robust market sizing, forecasting, and commercial models (top-down and bottom-up), alongside deep-dive competitive and industry analysis. I have played a key role in shaping go-to-market strategies, investment cases, and growth roadmaps, enabling clients to make confident, data-backed decisions in dynamic markets.

Research Approach


Secondary Research

The secondary research process involved comprehensive analysis of regulatory databases, financial publications, banking industry reports, and authoritative economic institutions. Key sources included the US Federal Reserve System (FederalReserve.gov), Consumer Financial Protection Bureau (CFPB), Federal Housing Finance Agency (FHFA), Federal Deposit Insurance Corporation (FDIC), National Credit Union Administration (NCUA), Mortgage Bankers Association (MBA), American Bankers Association (ABA), US Department of Housing and Urban Development (HUD), European Central Bank (ECB), European Banking Authority (EBA), Bank for International Settlements (BIS), International Monetary Fund (IMF) Financial Stability Reports, World Bank Global Financial Development Database, Organisation for Economic Co-operation and Development (OECD) Housing Finance Statistics, national central banks from key markets (Bank of England, Bank of Canada, Reserve Bank of Australia, People's Bank of China), and housing finance agency reports from major economies.

Mortgage origination statistics, interest rate trends, housing price indices, consumer credit data, and market landscape analysis for fixed-rate home equity loans, adjustable-rate products, home equity lines of credit (HELOCs), and hybrid lending instruments were gathered from these sources.


Primary Research

In order to gather both qualitative and quantitative insights, supply-side and demand-side stakeholders were interviewed during the primary research process. CEOs, chief lending officers, heads of retail banking, heads of mortgage operations, chief risk officers, and heads of digital banking from commercial banks, credit unions, mortgage lenders, and fintech lending platforms were among the supply-side sources. Branch managers, loan officers, mortgage brokers, financial advisors, and consumer lending experts from local banks, national banking chains, regional banks, and digital-first lending platforms made up demand-side sources. In addition to gathering information on lending adoption trends, pricing tactics, risk assessment techniques, and regulatory compliance dynamics, primary research verified market segmentation and product pipeline timescales.

Primary Respondent Breakdown:

By Designation: C-level Primaries (32%), Director Level (30%), Others (38%)

By Region: North America (38%), Europe (25%), Asia-Pacific (28%), Rest of World (9%)


Market Size Estimation

Global market valuation was derived through revenue mapping and loan origination volume analysis. The methodology included:

Identification of 50+ key lenders across North America, Europe, Asia-Pacific, and Latin America

Product mapping across home improvement loans, debt consolidation loans, education financing, and investment-purpose lending

Interest rate structure analysis across fixed-rate, adjustable-rate, and hybrid-rate products

Loan term analysis covering 15-year, 20-year, 30-year fixed, and 10-year/15-year adjustable options

Loan-to-Value (LTV) ratio segmentation across 80% or less, 80-90%, 90-95%, and over 95% categories

Loan amount tier analysis from less than $50,000 to more than $250,000

Analysis of reported and modeled annual revenues specific to home equity lending portfolios

Coverage of lenders representing 72-78% of global market share in 2024

Extrapolation using bottom-up (origination volume × average loan size × fee structure by country) and top-down (lender revenue validation) approaches to derive segment-specific valuations

Download Free Sample

Kindly complete the form below to receive a free sample of this Report

Download PDF ×

We do not share your information with anyone. However, we may send you emails based on your report interest from time to time. You may contact us at any time to opt-out.