Healthcare Analytics Market (2026 - 2035)

Healthcare Analytics Market Research Report: Size, Share, Trend Analysis By Applications (Predictive Analytics, Descriptive Analytics, Prescriptive Analytics, Mobile Health Analytics), By Deployment Mode (On-Premise, Cloud-Based, Hybrid), By Component (Software, Hardware, Services), By End Use (Healthcare Providers, Payer Organizations, Pharmaceutical Companies, Research Institutions) and By Regional (North America, Europe, South America, Asia Pacific, Middle East and Africa) - Growth Outlook & Industry Forecast 2025 To 2035
ID: MRFR/HC/6349-HCR 100 Pages Vikita Thakur, Rahul Gotadki Last Updated: September 15, 2026
Healthcare Analytics Market
Market Size
Forecast Period2026-2035
CAGR (2026-2035)20.9%
2025 Market SizeUSD 53.20 Billion
2035 Market SizeUSD 354.90 Billion
Key Players
Optum
Oracle Health
IQVIA
Veradigm
SAS Institute
IBM
Opportunities
  • Managed Analytics for Mid-Market Providers
  • Real-World Evidence as a Revenue Line
  • Emerging-Market Leapfrog Deployments

Healthcare Analytics Market Summary

The Healthcare Analytics Market was valued at USD 53.20 Billion in 2025 and opens the forecast window at USD 64.30 Billion in 2026, climbing to USD 354.90 Billion by 2035 at a 20.9% CAGR. Two catalysts anchor that trajectory. The first is the shift of provider revenue into outcome-based contracts — CMS has committed to placing all traditional Medicare beneficiaries in accountable care relationships by 2030, which turns measurement from a reporting chore into a payment mechanism [1]. The second is capital: health systems and payers directed roughly USD 12.4 Billion into data infrastructure and analytics tooling during 2024 alone [4].

Legacy enterprise data warehouses, built for retrospective quarterly reporting, are being retired. Replacing them are cloud-native lakehouse architectures, federated query layers, and machine-learning pipelines that surface signals within hours rather than weeks. The US TEFCA framework and the HTI-1 rule have forced interoperability upgrades across certified electronic health record platforms, and the ONC estimated compliance-related IT spending at more than USD 3.1 Billion across certified vendors and their customers [2].

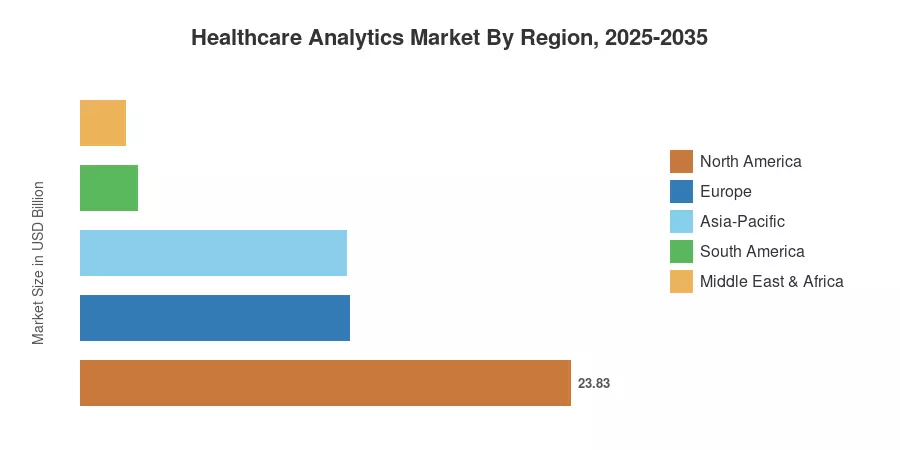
Regionally, North America holds 44.8% of the Healthcare Analytics Market, sustained by reimbursement reform and dense claims data. Asia-Pacific grows fastest at a 24.3% CAGR as China, India, and Japan digitize national health records. Europe sits second with a 24.6% share, propelled by the European Health Data Space regulation. Expect the competitive centre of gravity to move from dashboard vendors toward firms that can prove clinical and financial lift.


Key Report Takeaways

• By Analytics Type


  • Descriptive analytics held 42.4% of the Healthcare Analytics Market in 2025, still the default entry point for reporting-led buyers.
  • Predictive analytics is scaling at a 22.9% CAGR as risk-stratification models move from pilots into production.


• By Component


  • Software accounted for USD 29.37 Billion of 2025 revenue, the largest component slice.
  • Services are the fastest-growing component at a 23.1% CAGR, driven by managed-analytics demand.


• By Region

  • North America generated USD 23.83 Billion in 2025 revenue
  • Asia-Pacific is advancing at a 24.3% CAGR, the fastest of any region
  • Europe holds a 24.6% share, with Germany the single largest national contributor


Market Size and Forecast (2021–2035)

Estimates combine vendor revenue disclosures, health-system IT budget surveys, payer technology spend filings, and public procurement records, triangulated against installed-base counts for certified EHR platforms. Historical figures reflect audited or reported revenue where available; forecast values apply segment-weighted adoption curves.
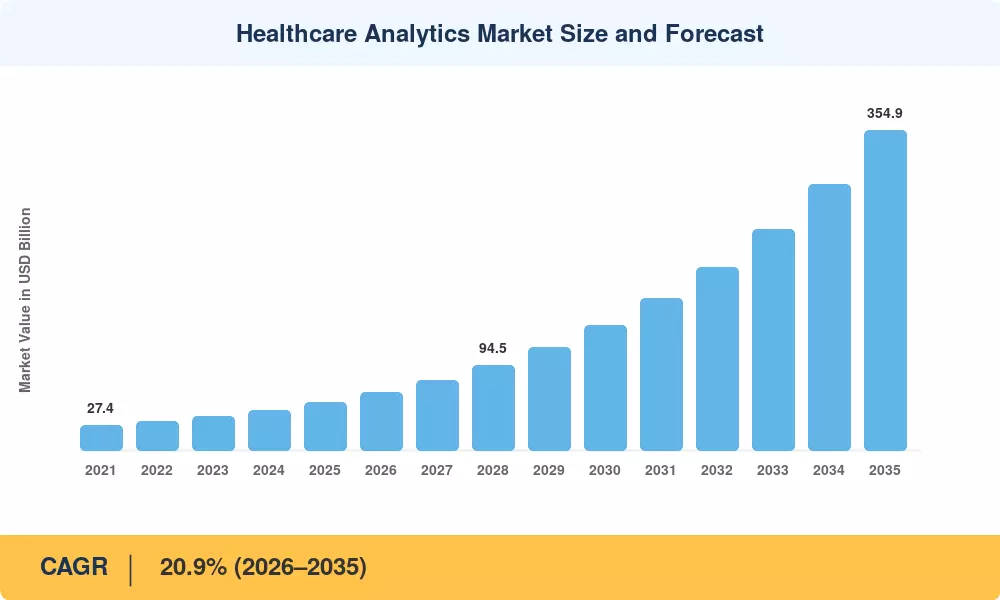
Healthcare Analytics Market Size and Forecast
Our Impact

Enabled $4.3B Revenue Impact for Fortune 500 and Leading Multinationals

Partnering with 2000+ Global Organizations Each Year

30K+ Citations by Top-Tier Firms in the Industry

Driver Impact Analysis

Driver ~% Impact on CAGR Geographic Relevance Impact Timeline
Value-based and outcome-linked reimbursement 5.1 North America, Europe Medium-term (2–4 yr)
Cloud and lakehouse migration economics 4.3 Global Short-term (≤2 yr)
Interoperability mandates (TEFCA, EHDS) 3.6 North America, Europe Medium-term (2–4 yr)
Declining genomic sequencing cost 2.7 Global Long-term (≥4 yr)
Payer fraud, waste and abuse detection 2.4 North America Short-term (≤2 yr)
Imaging volume growth and AI triage 1.9 Asia-Pacific, Europe Long-term (≥4 yr)
Clinical documentation burden reduction 1.6 North America Short-term (≤2 yr)


Reimbursement Reform Converts Measurement Into Revenue

Payment design now decides analytics budgets. The Medicare Shared Savings Program covered 10.8 million beneficiaries in 2024 and returned USD 2.4 Billion in shared savings, the seventh consecutive year of net savings [1]. Accountable care organizations cannot earn those distributions without attribution logic, risk adjustment, and leakage tracking — capabilities that sit squarely inside the Healthcare Analytics Market. Systems that fail to instrument their cost-of-care curves forfeit upside.

Cloud Economics Collapse Time-to-Insight

Migration has stopped being an IT preference and become a unit-cost argument. Health systems moving from on-premise warehouses to elastic architectures report 38–46% reductions in query cost per terabyte and cut model retraining cycles from weeks to days [5]. That compression matters because predictive models decay quickly against shifting case mix.

Interoperability Rules Manufacture Data Supply

Regulation is creating the raw material. HTI-1 requires certified developers to support standardized API access, and the ONC has estimated aggregate compliance investment above USD 3.1 Billion [2]. Europe's Health Data Space regulation, adopted in 2025, obliges member states to stand up secondary-use access bodies [6]. More governed data flowing across institutional boundaries directly widens the addressable base.


Restraints Impact Analysis

Restraint ~% Drag on CAGR Geographic Relevance Impact Timeline
Ransomware and breach exposure 3.2 North America, Europe Short-term (≤2 yr)
Data-engineering talent scarcity and cost 2.8 Global Medium-term (2–4 yr)
Fragmented data quality and coding variance 2.1 Asia-Pacific, South America Long-term (≥4 yr)
Capital constraints at mid-size providers 1.7 Global Medium-term (2–4 yr)
Cross-border privacy and residency limits 1.3 Europe, Middle East & Africa Long-term (≥4 yr)


Security Incidents Freeze Procurement Cycles

Breaches do more damage than their remediation line items suggest. The US HHS breach portal logged health-data exposure affecting more than 180 million individuals across 2023–2024, and average incident cost in the sector reached USD 9.8 Million [11]. Boards respond by diverting discretionary spend into perimeter security and by lengthening vendor security reviews from weeks to two or three quarters.

Talent Costs Outpace Software Budgets

Scarcity has become the binding constraint at mid-size systems. Median US compensation for senior healthcare data engineers rose 23% between 2022 and 2025, and roughly 41% of surveyed hospital CIOs cite staffing as the primary blocker to analytics expansion [12]. This is precisely why managed-service delivery is growing faster than licences.

Dirty Data Undermines Model Trust

Quality problems compound quietly. Audits of hospital coding across emerging markets found 12–19% discrepancy rates between clinical documentation and submitted diagnosis codes [13]. Models trained on that substrate produce confident but wrong outputs, and a single visible failure can stall an enterprise rollout for a year.


Healthcare Analytics Market Opportunities

Managed Analytics for Mid-Market Providers

Hospitals under 300 beds seek outcomes, not platforms. Fully managed subscriptions that bundle pipeline operations, model monitoring and clinical validation turn a capital project into an operating line – the fastest way around the talent limitation discussed in.


Real-World Evidence as a Revenue Line

Pharma sponsors will pay for longitudinal data. Health systems have it. De-identified cancer and cardiometabolic cohorts now support regulatory submissions, with real-world evidence accepted by the FDA in support of 41 label extensions between 2022 and 2025 [14]. The most obvious new business model in the Healthcare Analytics Market is governed data monetization.


Emerging-Market Leapfrog Deployments

More than 700 million health IDs have been created under India’s Ayushman Bharat Digital Mission, while Indonesia’s SATUSEHAT portal already combines records from over 30,000 facilities [15]. These systems totally skip the old warehouse generation, and favor vendors who are cloud native with low-cost delivery models.


Ambient Documentation and Charting Recovery

It’s a quantitative, budget-approved outcome that eliminates physician charting time. Deployments that combine ambient collection with structured extraction have yielded 60-90 minutes per clinician each day, providing an analytics beachhead inside clinical workflow rather than the back office [10].


Payer-Side Fraud and Payment Integrity

Improper payments across US federal health programs exceeded USD 85 Billion in fiscal 2024 [8]. Graph-based network detection materially outperforms rules engines here, and payers can underwrite the spend against recovered dollars — an unusually short payback case.


Healthcare Analytics Market Future Outlook

Autonomous Analytics Operations

Pipeline maintenance is the hidden cost of analytics, and automated machine-learning operations are attacking it directly. By 2030 we expect a majority of production clinical models to be retrained on automated schedules with drift monitoring rather than manual intervention, cutting the engineering headcount per model by roughly half [12].

Platform Economics and Consolidation

Buyers are tiring of point solutions. Procurement is consolidating around three or four enterprise data platforms per system, and specialist vendors increasingly sell as applications on those platforms rather than as standalone stacks — a structural shift that reshapes the competitive map.

Genomic and Multimodal Integration

Sequencing cost per genome has fallen below USD 200 at scale, and the NIH All of Us program has enrolled over 800,000 participants with genomic and EHR linkage [7]. Multimodal cohorts of that depth make precision-medicine analytics commercially viable outside academic centres.

Privacy-Preserving Computation

Federated learning and synthetic data generation resolve the tension between sovereignty rules and model quality. The World Health Organization has flagged governed cross-border analysis as essential to pandemic preparedness, and technical approaches that never move raw records will define the compliant architecture of the 2030s within the Healthcare Analytics Market [18].


Regional Market Share Analysis

Region Metric (2025) Primary Investment Themes
North America 44.8% share Value-based care, payment integrity, ambient documentation
Europe USD 13.09 Billion Health data space compliance, secondary-use platforms
Asia-Pacific 24.3% CAGR National record digitization, imaging AI
South America 5.2% share Public-hospital reporting, private-payer modernization
Middle East & Africa USD 2.18 Billion Sovereign health cloud, capacity planning
Total USD 53.20 Billion —

Regional performance across the Healthcare Analytics Market diverges sharply by reimbursement design and data-governance maturity.


North America

Country Metric Key Driver
US 87.4% of region Medicare accountable care expansion [1]
Canada USD 2.14 Billion Provincial health data platform renewals
Mexico 20.6% CAGR IMSS digitization and private hospital growth


Concentration of claims data gives North America an advantage no other region can replicate quickly. CMS innovation models covered more than 41 million lives in 2024, and each model carries mandatory quality reporting [1]. Payers, meanwhile, are rebuilding payment-integrity stacks after the improper-payment disclosures of the last two fiscal years [8].

Europe

Country Metric Key Driver
Germany 23.1% of region Hospital Future Act digital funding [16]
UK USD 2.68 Billion NHS federated data platform rollout
France 15.4% of region Health Data Hub secondary-use access
Italy 9.2% of region PNRR-funded hospital IT modernization
Spain 21.7% CAGR Regional interoperability programs
Nordic Countries USD 1.11 Billion Mature registry infrastructure
Russia 3.1% of region State insurance reporting
Rest of Europe 20.4% CAGR Cross-border cohort research


Germany's Krankenhauszukunftsgesetz allocated EUR 4.3 Billion to hospital digitization with explicit interoperability conditions, and disbursement continued through 2025 [16]. The European Health Data Space adds a second layer by obliging member states to permit governed secondary use of health records [6].

Asia-Pacific

Country Metric Key Driver
China 34.6% of region Tiered hospital rating IT requirements
India 27.8% CAGR Ayushman Bharat Digital Mission scale [15]
Japan USD 2.29 Billion Ageing-population capacity analytics
South Korea 11.3% of region K-Health data platform
ASEAN 25.1% CAGR SATUSEHAT and regional equivalents [15]
Rest of Asia-Pacific USD 0.74 Billion Donor-funded surveillance programs


Scale is the story. India crossed 700 million digital health IDs, and the region's imaging volumes are growing faster than radiologist supply, which makes triage automation a capacity question rather than a cost question [9][15].

South America

Country Metric Key Driver
Brazil 58.3% of region ANS reporting obligations, private payer scale
Argentina USD 0.36 Billion Provincial health system consolidation
Rest of South America 22.4% CAGR Chilean and Colombian insurer modernization


Brazil's supplementary health sector covers roughly 51 million lives under regulated reporting, giving private payers a clear analytics mandate [13]. Public-sector adoption lags on budget cycles.

Middle East & Africa

Country Metric Key Driver
Saudi Arabia 31.9% of region Vision 2030 health cluster restructuring [17]
UAE USD 0.51 Billion Riayati and Malaffi exchange platforms
South Africa 14.2% of region Private hospital group reporting
Egypt 24.8% CAGR Universal health insurance rollout
Rest of MEA USD 0.29 Billion Development-financed surveillance


Saudi Arabia's health cluster model reorganizes delivery around accountable regional entities, which requires population-level measurement infrastructure the Kingdom did not previously maintain [17]. Sovereign residency requirements shape vendor selection across the region.


Healthcare Analytics Market By Region, 2025-2035

Healthcare Analytics Market Segmentation

By Analytics Type

Analytics maturity determines where budget lands across the Healthcare Analytics Market.

Segment Metric (2025) Primary Demand Driver
Descriptive 42.4% share Regulatory and quality reporting
Diagnostic USD 13.09 Billion Variation and root-cause analysis
Predictive 22.9% CAGR Risk stratification and readmission control
Prescriptive 11.2% share Care-pathway and capacity optimization


Descriptive tooling remains dominant because reporting is non-optional; every accredited institution needs it before anything else. Predictive workloads grow far faster, though, as readmission, deterioration, and no-show models finally clear validation and move into live workflow. The gap between the two growth rates is the clearest signal of where new spending is heading.

By Component

Component mix inside the Healthcare Analytics Market is shifting toward delivered outcomes.

Segment Metric (2025) Primary Demand Driver
Software USD 29.37 Billion Platform standardization
Services 23.1% CAGR Talent scarcity and managed delivery
Hardware 12.2% share On-premise imaging and edge inference


Software carries the largest revenue block, but services are the interesting line. Buyers who cannot hire data engineers are buying the function instead, and implementation partners are converting project work into recurring managed contracts.

By Delivery Mode

Segment Metric (2025) Primary Demand Driver
On-Premise 44.2% share Legacy estates and residency rules
Cloud-Based 22.6% CAGR Elastic compute economics
Hybrid USD 7.29 Billion Phased migration architectures


On-premise installations remain the dominant delivery model within the digital pathology market, backed by hospitals' deep-rooted legacy IT estates, stringent data residency rules, and the heavy reliance on local data center infrastructure to secure sensitive patient diagnostics. Meanwhile, cloud-based solutions represent the fastest-growing delivery segment, propelled by the need for elastic compute economics to handle massive whole-slide image storage and cross-site multi-user access.

By Application

Segment Metric (2025) Primary Demand Driver
Financial / Revenue-Cycle 37.7% share Denial management and payment integrity
Clinical USD 16.70 Billion Quality measures and clinical decision support
Operational / Administrative 18.6% share Staffing, throughput and supply cost
Population Health Management 23.8% CAGR Risk-bearing contract performance


Revenue-cycle work still funds the category because denial recovery produces cash within a quarter. Population health management grows fastest as providers accept downside risk and need population health insights to manage it.

By End User

End-user demand across the Healthcare Analytics Market splits between commercial research and care delivery.

Segment Metric (2025) Primary Demand Driver
Life-Science Companies 41.5% share Real-world evidence and trial feasibility
Healthcare Providers 23.9% CAGR Risk contracts and margin pressure
Payers USD 10.32 Billion Fraud detection and network design
Others 5.3% share Government and research institutes


The life science segment continues to be the leading end-user category for the healthcare analytics market, due to the need to harness real-world evidence (RWE) and enhance the viability of clinical trials through enhanced data insights. Healthcare providers are the fastest-expanding segment, driven by the urgent need to adopt value-based risk contracts and ongoing operational margin constraints.


Competitive Benchmarking

Concentration is moderate. The top five vendors hold an estimated 31–36% of revenue, with an approximate HHI near 480 — fragmented enough that specialist entrants still win enterprise deals, consolidated enough that platform vendors set architectural standards. Competition increasingly turns on validated clinical outcomes rather than feature checklists.

Company Est. Revenue Share Range Key Offerings for Healthcare Analytics Market Strategic Positioning
Optum (UnitedHealth Group) ~9–12% Payment integrity, risk adjustment, real-world data Payer-integrated scale leader
Oracle Health ~7–10% EHR-native reporting, enterprise data platform Installed-base defence
IQVIA ~6–9% Real-world evidence, trial feasibility, commercial analytics Life-science franchise depth
Veradigm ~4–6% Ambulatory data networks, research datasets Data-asset licensing model
SAS Institute ~3–5% Fraud detection, statistical modelling Regulated-analytics specialist
IBM ~3–5% Data fabric, governance, AI tooling Infrastructure and governance layer
Health Catalyst ~2–4% Data operating system, outcomes improvement services Provider-focused managed delivery
Inovalon ~2–4% Quality measurement, risk score accuracy Payer quality-reporting niche
Cotiviti ~2–4% Payment accuracy, network analytics Recovery-linked commercial model
Innovaccer ~1–3% Unified patient record, population health platform Cloud-native challenger
Arcadia ~1–3% Value-based care performance, network insights Risk-contract specialist


Recent News & Developments

  • CMS (November 2023): Finalized the Making Care Primary model across eight states, expanding mandatory performance measurement into primary care practices [1]
  • ONC/ASTP (January 2024): HTI-1 final rule took effect, requiring standardized API access and algorithm transparency attributes from certified developers [2]
  • European Parliament (April 2024): Adopted the European Health Data Space regulation, establishing secondary-use access bodies across member states [6]
  • Oracle Health (September 2024): Released a next-generation EHR built on a unified cloud data platform, signalling a rebuild rather than a migration of its legacy estate [5]
  • IQVIA and NVIDIA (January 2025): Announced an expanded collaboration to build domain-specific foundation models for clinical and commercial life-science workflows [14]
  • Innovaccer (March 2025): Acquired a healthcare AI assistant vendor to extend its platform into ambient clinical documentation [10]
  • India ABDM (June 2025): Crossed 700 million health account registrations, with linked records exceeding 500 million [15]
  • HHS OCR (September 2025): Proposed strengthened HIPAA Security Rule requirements, including mandatory asset inventories and encryption for regulated entities [11]


Healthcare Analytics Market Report Scope

Parameter Detail
Market Scope Global healthcare analytics software, hardware and services across providers, payers, life-science firms and public agencies
Study Period 2021–2035 (Historical 2021–2024; Base Year 2025; Forecast 2026–2035)
CAGR 20.9% (2026–2035)
Market Size Checkpoints USD 53.20 Billion (2025); USD 64.30 Billion (2026); USD 354.90 Billion (2035)
Fastest Growing Segments Predictive analytics; services; cloud-based delivery; population health management; healthcare providers
Companies Profiled 11 vendors including Optum, Oracle Health, IQVIA, Veradigm, SAS Institute, IBM, Health Catalyst, Inovalon, Cotiviti, Innovaccer, Arcadia
Valuation Currency USD Billion

FAQs

What contract structure should buyers negotiate when entering the Healthcare Analytics Market?
Tie a portion of vendor fees to validated outcome metrics such as denial-rate reduction or readmission decline. Insist on data-portability clauses and documented model performance thresholds before renewal [20].
How should a hospital evaluate build-versus-buy for analytics infrastructure?
Building rarely pays below roughly 400 beds because pipeline maintenance requires three to five permanent engineers. Buy the platform, build only the models that encode institutional clinical judgement [12].
Which integration failures most often derail deployments in the Healthcare Analytics Market?
Master patient index mismatches and inconsistent local coding practice cause most stalled projects. Budget three to six months for identity resolution and terminology mapping before expecting usable output [13].
Do algorithm transparency rules apply to internally developed models?
Certified developer transparency attributes cover supplied predictive decision support, not purely internal tools. Health systems deploying homegrown models still carry liability and should document training data and validation independently [2].
What differentiates payer-side vendors from provider-side vendors in the Healthcare Analytics Market?
Payer vendors optimize for claims completeness and recovery economics; provider vendors optimize for clinical workflow latency. Cross-selling between the two rarely succeeds without substantial re-engineering [8].
Is federated learning practical today for multi-institution research?
Yes for model training on structured EHR data, and several European consortia now run it in production. Imaging and genomic workloads remain harder because of bandwidth and harmonization overhead [18].
How much should organizations budget for ongoing model governance?
Plan 18–25% of initial deployment cost annually for monitoring, revalidation and bias auditing. Underfunding governance is the most common cause of silent model failure post-launch [21].      
Author
Author Author Profile Vikita Thakur LinkedIn Senior Research Analyst
She holds an experience of about 5+ years in market research and business consulting projects for sectors such as life sciences, medical devices, and healthcare IT. She possesses a robust background in data analysis, market estimation, competitive intelligence, pipeline analysis market trend identification, and consumer behavior insights. Her expertise lies in technical Sales support, client interaction and project management, designing and implementing market research studies, conducting competitive analysis, and synthesizing complex data into actionable recommendations that drive business growth.
Co-Author Co-Author Profile Rahul Gotadki LinkedIn Research Manager
He holds an experience of about 9+ years in Market Research and Business Consulting, working under the spectrum of Life Sciences and Healthcare domains. Rahul conceptualizes and implements a scalable business strategy and provides strategic leadership to the clients. His expertise lies in market estimation, competitive intelligence, pipeline analysis, customer assessment, etc.

Research Approach


Secondary Research

The secondary research process involved comprehensive analysis of health IT regulatory databases, healthcare informatics journals, health policy publications, and authoritative health technology organizations. Key sources included the US Department of Health and Human Services (HHS), Office of the National Coordinator for Health Information Technology (ONC), Centers for Medicare & Medicaid Services (CMS), Centers for Disease Control and Prevention (CDC), Agency for Healthcare Research and Quality (AHRQ), National Institutes of Health (NIH) Health IT Portfolio, European Commission Health and Digital Executive Agency (HADEA), European Health Data Space (EHDS) regulations, NHS Digital (UK), Australian Institute of Health and Welfare (AIHW), World Health Organization (WHO) Digital Health Department, and OECD Health Statistics. These sources were utilized to collect health IT adoption statistics, regulatory compliance data (including HITECH Act and HIPAA implementations), interoperability standards (FHIR, HL7), clinical data exchange metrics, reimbursement policy changes, and healthcare digitalization trends across predictive analytics platforms, electronic health record integrations, population health management systems, and cloud-based healthcare infrastructure.


Primary Research

In order to acquire qualitative and quantitative insights that were specific to the adoption of health informatics and clinical data analytics, interviews were conducted with supply-side and demand-side stakeholders during the primary research process. Chief Technology Officers (CTOs), Chief Data Officers (CDOs), Vice Presidents of Healthcare Solutions, Heads of Regulatory Affairs for Health IT, and commercial directors from healthcare analytics software vendors, EMR/EHR system integrators, and medical device data platform providers comprised supply-side sources. Chief Information Officers (CIOs) from hospital systems, Chief Analytics Officers (CAOs) from integrated delivery networks, health informatics directors from payer organizations, clinical data scientists from pharmaceutical R&D divisions, and procurement leads from academic medical centers and accountable care organizations (ACOs) comprised demand-side sources. The primary research validated market segmentation across software and service components, confirmed AI/ML algorithm deployment timelines, and garnered insights on clinical workflow integration patterns, SaaS pricing models, data interoperability challenges, and cybersecurity compliance expenditures.

Primary Respondent Breakdown:

By Designation: C-level Primaries (30%), Director Level (35%), Others (35%)

By Region: North America (38%), Europe (25%), Asia-Pacific (28%), Rest of World (9%)


Market Size Estimation

Global market valuation was derived through revenue mapping and health data transaction volume analysis. The methodology included:

Identification of over 50 essential technology vendors and service providers in North America, Europe, Asia-Pacific, and Latin America who specialize in health analytics platforms

Product and solution mapping across predictive analytics, descriptive reporting tools, prescriptive clinical decision support, and mobile health monitoring platforms

Analysis of reported and modeled annual revenues specific to healthcare analytics software licenses, implementation services, and ongoing support contracts

Coverage of technology vendors and consulting firms representing 72-78% of global market share in 2024

Extrapolation using bottom-up (hospital bed count × IT spend per bed × analytics allocation factor by country) and top-down (vendor revenue validation against health IT market reports) approaches to derive segment-specific valuations for cloud-based versus on-premise deployments, provider versus payer end-user segments, and specialty-specific analytics (clinical, financial, operational, and population health)

Download Free Sample

Kindly complete the form below to receive a free sample of this Report

Download PDF ×

We do not share your information with anyone. However, we may send you emails based on your report interest from time to time. You may contact us at any time to opt-out.

















