Golf Equipment Market

Key Players: Acushnet Holdings (Titleist, FootJoy), Callaway Golf (Topgolf Callaway Brands), TaylorMade Golf, PING, Cobra Golf (Puma SE), SRI Sports (Cleveland, Srixon, XXIO), Bridgestone Golf, Mizuno

Golf Equipment Market

Golf Equipment Market Size, Share, Industry Trend & Analysis Research Report By Product Type (Golf Club, Golf Balls, Apparel, Others), By Category (Mass, Premium), By End Use (Adult, Kids/Children), By Distribution Channel (Offline Channel, Online Channel), By Geography (North America, Europe, Asia-Pacific, South America, Middle East & Africa) - Forecast to 2035
ID: MRFR/CG/20793-HCR
128 Pages
Pradeep Nandi
Last Updated: June 16, 2026
 

Golf Equipment Market Summary

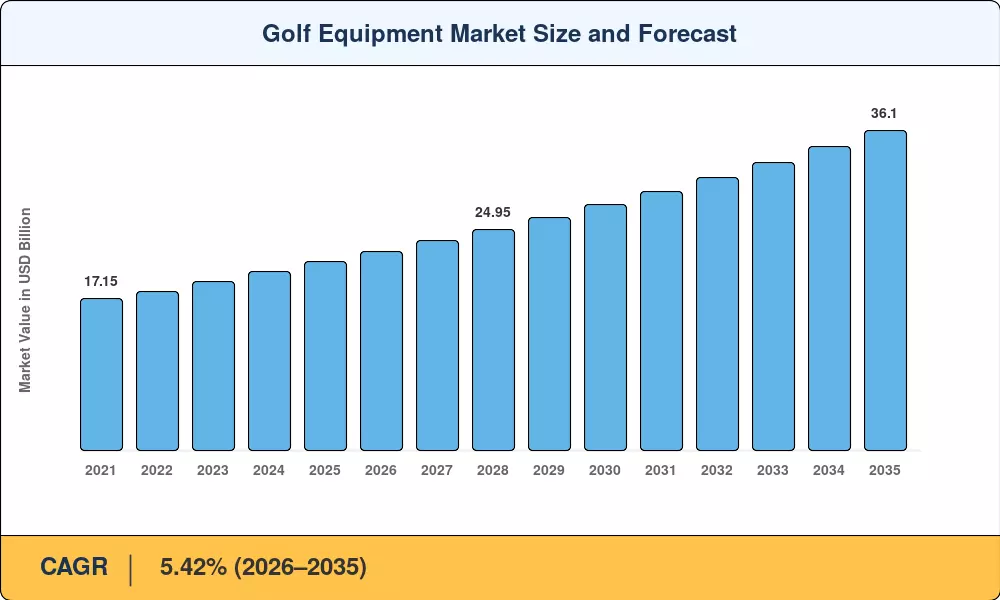
The golf equipment market reached a valuation of USD 21.30 Billion in 2025, driven by record on-course participation rates and a broadening demographic of active golfers across North America, Europe, and Asia-Pacific. Market Research Future (MRFR) projects the golf equipment market to expand from USD 22.45 Billion in 2026 to USD 36.10 Billion by 2035, registering a compound annual growth rate of 5.42% during the 2026–2035 forecast window. The U.S. National Golf Foundation recorded over 41 million on-course and off-course participants in 2024, a figure that underpins sustained demand for golf clubs, irons and drivers, golf balls and accessories, and performance apparel [2]. Government-backed youth development programs and collegiate golf scholarships have further cemented the sport's pipeline of new consumers.

A technology change is changing how players choose and use equipment. Gone are the days of legacy forged-blade irons and manually fitted putters, which are being replaced by AI-optimized clubhead designs, sensor-embedded grips, and portable golf technology and launch monitors that deliver real-time swing statistics. Money moving into R&D can be seen in the example of Callaway’s 2024 expenditure of over USD 65 million in computational clubface engineering [3]. The R&A and USGA [4] have led the way in sustainability standards that are forcing manufacturers to incorporate recycled polymers and bio-based urethane coverings in golf balls and accessories.


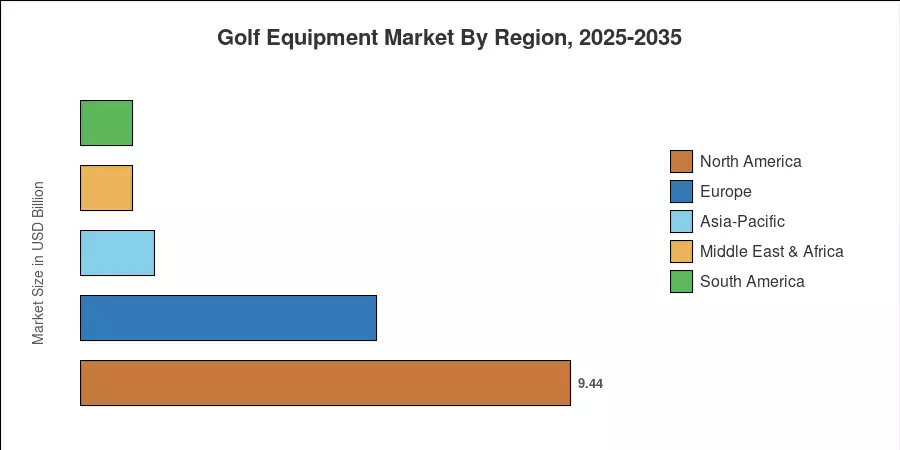
North America is the largest market for golf equipment, with 44.3% of the market share, supported by a huge network of over 16,000 courses and a strong retail infrastructure. Asia-Pacific is the fastest-growing region with a predicted CAGR of 6.68%. The growth here is attributable to golf tourism in Japan and course-construction booms in South Korea and China. Europe retains the second greatest share with approximately 26.8%, bolstered by strong involvement in the UK and Nordic Countries The golf equipment industry will likely experience steady growth through 2035 as premiumization trends intensify and electric golf carts and equipment become more common.


Key Report Takeaways

• By Product Type

  • Golf clubs captured a 41.8% revenue share of the golf equipment market in 2025, reflecting enduring demand for golf clubs, irons and drivers across all skill levels
  • Apparel is forecast to post the fastest segment CAGR of 5.21% through 2035, as athleisure-influenced golf fashion attracts younger demographics
  • Golf balls and accessories accounted for approximately USD 5.11 Billion in 2025 revenue, supported by premium multi-layer ball launches

• By Category

  • The mass segment held 66.7% of the golf equipment market share in 2025
  • Premium equipment is expected to expand at a 5.59% CAGR through 2035

• By Geography

  • North America dominates with a 44.3% share of the golf equipment market, anchored by the United States' established retail ecosystem
  • Asia-Pacific is anticipated to register the quickest CAGR of 6.68%, fueled by golf tourism and rising middle-class participation


Market Size and Forecast (2021–2035)

Market Research Future (MRFR) proprietary estimation framework merges bottom-up revenue analysis across product verticals, distributor sell-through data, import-export statistics and triangulation with business filings. Historical numbers (2021–2024) are reconciled with trade association reports from the National Golf Foundation, The R&A and the Golf Datatech consortium[2][5].

Golf Equipment Market Size and Forecast
Our Impact
Enabled $4.3B Revenue Impact for Fortune 500 and Leading Multinationals
Partnering with 2000+ Global Organizations Each Year
30K+ Citations by Top-Tier Firms in the Industry
 

Driver Impact Analysis

Driver ~% Impact on CAGR Geographic Relevance Impact Timeline
Rising on-course & off-course participation +1.1% Global Short-term (≤2 yr)
AI-optimized club design & golf technology and launch monitors +0.9% North America, Europe Medium-term (2–4 yr)
Female & minority golfer influx +0.7% North America, Asia-Pacific Medium-term (2–4 yr)
Urban golf entertainment venues (Topgolf, simulators) +0.6% Global Short-term (≤2 yr)
Sustainability mandates & recycled materials adoption +0.5% Europe, North America Long-term (≥4 yr)
Electric golf carts and equipment proliferation +0.4% North America, Asia-Pacific Long-term (≥4 yr)
Government youth & collegiate golf grants +0.3% North America, South America Medium-term (2–4 yr)


Surging Participation Rates

The NGF reported that total U.S. golfers exceeded 41.1 million in 2024, marking the fifth consecutive year of growth [2]. Off-course formats—driving ranges, simulators, and entertainment complexes—added 12.8 million participants, many of whom subsequently purchased starter sets of golf clubs, irons and drivers. This broadening base has shortened replacement cycles for golf balls and accessories, creating a reliable volume tailwind for the golf equipment market.

AI-Driven Equipment Innovation

Manufacturers are deploying machine-learning algorithms to optimize clubface thickness maps, resulting in measurably higher ball speeds across the strike zone. TaylorMade allocated USD 48 million to its 2024 AI R&D program, producing the Qi35 driver line [3]. Portable golf technology and launch monitors from brands such as Trackman and Garmin are now priced below USD 600, democratizing performance data that was once limited to tour professionals.

Inclusion-Led Growth

Women represented 26% of new golfers in 2024, up from 19% in 2019 [8]. Brands including Callaway and PING have responded with dedicated fitting studios and gender-specific shaft profiles. The PGA WORKS initiative invested USD 12 million to expand minority-access programs across 350 college campuses, ensuring a diverse pipeline of future equipment purchasers for the golf equipment market.

Urban Golf Entertainment Expansion

Sports entertainment remains a critical component of the golf ecosystem. Topgolf, a subsidiary of Topgolf Callaway Brands, continues to lead this sector with over 100 venues globally. The proliferation of indoor simulator lounges in major metropolitan markets across Asia-Pacific, Europe, and North America is further exposing a casual, urban audience to the sport, effectively converting entertainment-seekers into consistent equipment and apparel consumers.


Restraints Impact Analysis

Restraint ~% Impact on CAGR Geographic Relevance Impact Timeline
Rising raw-material & manufacturing costs −0.5% Global Short-term (≤2 yr)
Weather unpredictability & climate disruption −0.4% Europe, North America Long-term (≥4 yr)
High price barrier for premium equipment −0.3% South America, MEA Medium-term (2–4 yr)
Counterfeit equipment on e-commerce platforms −0.2% Asia-Pacific Short-term (≤2 yr)
Declining course availability in urban markets −0.2% Europe, North America Long-term (≥4 yr)


Escalating Input Costs

Rising global commodity prices, particularly for specialized metals and carbon-fiber composites, have placed pressure on manufacturing budgets. These input costs impact the production of high-performance components like drivers and fairway woods. Manufacturers are navigating these pressures through supply chain optimization and by leveraging manufacturing efficiencies to mitigate the impact on retail pricing.


Climate and Seasonality Risk

The European Golf Association estimated that extreme weather events in 2023 caused 14% fewer playable days across the UK and Northern Europe [12]. Shortened playing seasons reduce the annual consumption of golf balls and accessories and slow the replacement cadence for golf clubs, irons and drivers, tempering growth in otherwise mature markets.

Counterfeit Proliferation

The rise of unauthorized replicas in online marketplaces remains a significant challenge for the golf industry, particularly in international markets. Premium equipment manufacturers actively engage in intellectual property protection and utilize consumer education initiatives to differentiate legitimate, high-performance equipment from fraudulent products, ensuring consumers receive the quality and performance associated with authorized brand standards.


Golf Equipment Market Opportunities

Next-Generation Golf Technology and Launch Monitors

Consumer-grade launch monitors priced under USD 500 are unlocking a new accessories category. Brands that bundle golf technology and launch monitors with club purchase programs can deepen engagement and shorten upgrade cycles

Direct-to-Consumer & Subscription Models

Online channels are projected to grow at a 4.5% - 6.7% CAGR through 2035 Companies such as Sub70 and Stix Golf have proven that direct-to-consumer models reduce distribution costs by 30–35%, creating margin headroom for the golf equipment market to reinvest in product innovation [16].

Emerging-Market Course Development

Golf course construction in India, Vietnam, and the UAE is accelerating, with an estimated 180 new courses planned through 2030. Each new facility generates incremental demand for electric golf carts and equipment, golf bag and trolley solutions, and bulk golf balls and accessories purchasing.

Sustainability-Linked Premiumization

Consumers under age 35 show a 42% willingness-to-pay premium for equipment made from recycled or bio-based materials [4]. Manufacturers who credibly certify sustainable supply chains can capture both margin uplift and brand loyalty in the golf equipment market

Data Monetization via Connected Equipment

The integration of sensor technology into grips and shafts is transforming hardware into a source of performance data. This "Data-as-a-Service" capability allows for the aggregation of swing analytics that support coaching platforms and personalized player development. As digital ecosystems continue to grow, this segment is emerging as a critical value-add that differentiates premium brands from traditional commodity hardware.


Golf Equipment Market Future Outlook

AI and Connected Equipment Ecosystem

By 2030, an estimated 35% of new clubs sold will embed performance sensors that sync with mobile coaching platforms [18]. This connectivity loop will transform how consumers interact with golf technology and launch monitors, shifting purchasing from episodic to subscription-augmented models across the golf equipment market.

Premiumization and Customization Supercycle

Custom-fit equipment continues to be a high-growth, high-margin category, significantly outperforming mass-market "off-the-rack" sales. The integration of 3D-printing into manufacturing processes is enabling rapid prototyping, which is projected to lower the barrier for mass customization, allowing premium benefits to reach a broader segment of mid-tier golfers.


Electrification of On-Course Mobility

Electric golf carts and equipment are transitioning from lead-acid to lithium-ion platforms, reducing weight by 30% and extending range to 50+ miles per charge [9]. Regulatory incentives in California and the EU targeting zero-emission course operations will accelerate fleet turnover through 2035.

ESG and Circular-Economy Integration

Governing bodies, led by the R&A’s Golf Course 2030 initiative, are pushing for stringent sustainability standards, including a 50% reduction in carbon emissions by 2030. Manufacturers that align with these goals by implementing circular-economy practices—such as club trade-in, refurbishment, and the use of recycled materials—are better positioned to maintain brand relevance and consumer trust.


Golf Equipment Market Segmentation

By Product Type

Segment Metric Primary Demand Driver
Golf Club 41.8% share (2025) Driver and iron replacement cycles
Golf Balls USD 5.11 Billion (2025) Multi-layer premium ball launches
Apparel 5.21% CAGR Athleisure crossover trend
Others (golf bag and trolley, accessories) USD 3.45 Billion (2025) Lightweight materials innovation


The golf equipment market is anchored by golf clubs, where demand for golf clubs, irons and drivers remains the single largest revenue contributor. Titanium-composite drivers incorporating AI-optimized face geometries accounted for over 58% of club-segment sales in 2024 [3]. Golf balls and accessories represent the second-largest product category; Titleist's Pro V1 family alone commands roughly 47% of the premium ball sub-segment [21].

By Category

Segment Metric Primary Demand Driver
Mass 66.7% share (2025) Accessibility for entry-level golfers
Premium 5.59% CAGR Custom fitting, advanced materials


The golf equipment market benefits from a dual-speed dynamic: mass-category products deliver volume through big-box retail and online platforms, while premium equipment drives margin expansion. Premium golf technology and launch monitors, high-end golf clubs, irons and drivers, and luxury golf bag and trolley lines together form the fastest-value-creation tier of the golf equipment market.

By End Use

Segment Metric Primary Demand Driver
Adults 91.0% share (2025) Established recreational spending patterns
Kids / Children 5.92% CAGR Junior development programs & school partnerships


Adult golfers dominate the golf equipment market, though the kids segment is accelerating as PGA Junior League participation surpassed 120,000 registrants in 2024 [10]. Brands offering scaled-down golf clubs, irons and drivers and colorful golf balls and accessories for junior players are capitalizing on early brand imprinting.

By Distribution Channel

Segment Metric Primary Demand Driver
Offline Channel 71.4% share (2025) In-store fitting, tactile trial
Online Channel 6.35% CAGR DTC brands, convenience, competitive pricing


Offline retail maintains dominance in the golf equipment market because golfers overwhelmingly prefer hands-on testing before purchasing clubs, golf bags and trolley solutions. Still, online channels are rapidly closing the gap as virtual fitting tools and augmented-reality try-on features mature [16].


Regional Market Share Analysis

Region Metric Primary Investment Themes
North America 44.3% share (2025) Premiumization; electric golf carts and equipment adoption
Europe 26.8% share (2025) Sustainability regulation; golf tourism
Asia-Pacific 6.68% CAGR (2026–2035) Course construction; middle-class participation
South America USD 1.00 Billion (2025) Youth development programs
Middle East & Africa USD 1.01 Billion (2025) Resort-linked golf tourism
Total USD 21.30 Billion (2025)

The golf equipment market exhibits distinct regional demand patterns shaped by course density, disposable income, and cultural affinity for the sport.


North America

Country Metric Key Driver
United States 78.2% of regional share Largest installed course base; retail density
Canada 12.5% of regional share Growing municipal golf programs
Mexico 9.3% of regional share Resort-linked tourism expansion


The United States alone hosts over 16,000 golf courses, sustaining annual replacement demand for golf clubs, irons and drivers, golf balls and accessories, and golf bag and trolley products. The PGA of America's 2024 merchandise report valued pro-shop retail at USD 3.6 Billion, underscoring the depth of the golf equipment market within this region [19].

Europe

Country Metric Key Driver
Germany 5.31% CAGR Corporate golf culture expansion
United Kingdom 28.7% of regional share Established links with tradition
France USD 0.72 Billion Rising municipal-course access
Italy 4.95% CAGR Golf tourism along Mediterranean coast
Spain USD 0.53 Billion Resort-linked demand
Nordic Countries 14.2% of regional share High per-capita participation
Russia 2.1% of regional share Emerging private-club segment
Rest of Europe 11.8% of regional share Eastern European course development


Sustainability mandates from the European Commission are accelerating the shift toward recycled-material golf balls and accessories and energy-efficient electric golf carts and equipment across EU-member courses [4].

Asia-Pacific

Country Metric Key Driver
China 6.95% CAGR Lifting of prior construction bans; urban simulators
India 7.12% CAGR 180+ new courses planned through 2030
Japan 31.4% of regional share Mature market; premiumization focus
South Korea 24.8% of regional share Screen-golf culture driving equipment trials
ASEAN USD 0.41 Billion Golf tourism in Thailand and Vietnam
Rest of Asia-Pacific 8.6% of regional share Australia & New Zealand participation growth


South Korea's indoor screen-golf industry, valued at an estimated USD 1.8 Billion domestically, funnels millions of casual players toward purchasing their own golf clubs, irons and drivers and golf technology and launch monitors [20].

South America

Country Metric Key Driver
Brazil 52.3% of regional share São Paulo metropolitan golf clubs
Argentina 28.1% of regional share Historic country-club tradition
Rest of South America 19.6% of regional share Chile & Colombia resort courses


Government grants in Brazil allocated BRL 45 million to youth golf academies in 2024, stimulating entry-level demand within the golf equipment market [10].

Middle East & Africa

Country Metric Key Driver
Saudi Arabia 5.82% CAGR Vision 2030 sports diversification
UAE 34.7% of regional share Luxury tourism & flagship courses
South Africa 28.5% of regional share Established participation base
Egypt 4.89% CAGR Red Sea resort development
Rest of MEA 15.3% of regional share Gradual awareness building


The UAE's portfolio of internationally branded courses—Emirates Golf Club, Yas Links, Trump International Dubai—drives high per-capita spending on premium golf bag and trolley products and electric golf carts and equipment.


Golf Equipment Market By Region, 2025-2035
 

Competitive Benchmarking

The golf equipment market is highly concentrated, with the top five players accounting for an estimated 55–62 percent of global revenue. The Herfindahl-Hirschman Index (HHI) is between 1,200 and 1,500, suggesting a competitive market yet one controlled by established incumbents with a strong brand loyalty and endorsements by tour players.

Company Est. Revenue Share Range Key Offerings Strategic Positioning
Acushnet Holdings (Titleist, FootJoy) ~14–17% Premium balls, vokey wedges, golf bag and trolley lines Tour-validated premium brand
Callaway Golf (Topgolf Callaway Brands) ~13–16% Drivers, irons, entertainment venues Vertically integrated play-to-purchase ecosystem
TaylorMade Golf ~11–14% AI-designed drivers, golf balls and accessories Innovation-led R&D leadership
PING ~6–8% Custom-fit irons, putters Engineering precision, fitting network
Cobra Golf (Puma SE) ~4–6% Golf clubs irons and drivers, speed-zone tech Youth-oriented brand, lifestyle crossover
SRI Sports (Cleveland, Srixon, XXIO) ~5–7% Irons, wedges, premium golf balls Multi-brand portfolio across price tiers
Bridgestone Golf ~3–5% Tour-grade golf balls and accessories Ball-fitting technology leadership
Mizuno ~2–4% Forged irons, performance apparel Craftsmanship positioning in the Asia-Pacific
Club Car (Textron) ~2–3% Electric golf carts and equipment Fleet electrification partnerships
Garmin / Bushnell ~1–3% Golf technology and launch monitors, GPS devices Connected-equipment ecosystem


Recent News & Developments

  • TaylorMade Golf (January 2025): Launched the Qi35 driver series featuring AI-computed variable-thickness faces, achieving a 6% increase in average ball speed across the hitting area [3].
  • Callaway Golf (October 2024): Callaway continues its Asia-Pacific expansion by increasing the adoption of its Toptracer range technology, which is now installed in over 50 driving ranges across South Korea.


  • USGA (June 2024): The USGA and R&A implemented Model Local Rule G-11 to restrict the use of detailed green-reading materials in competition, independent of equipment COR standards.


Golf Equipment Market Report Scope

Parameter Detail
Market Scope Global golf equipment market spanning clubs, balls, apparel, bags, trolleys, carts, and technology accessories
Study Period 2021–2035
CAGR 5.42% (2026–2035)
Base-Year Market Size USD 21.30 Billion (2025)
Forecast Endpoint USD 36.10 Billion (2035)
Fastest Growing Segments Kids/Children (by end use); Online Channel (by distribution); Asia-Pacific (by region)
Companies Profiled Acushnet, Callaway, TaylorMade, PING, Cobra, SRI Sports, Bridgestone, Mizuno, Textron (Club Car), Garmin
Valuation Currency USD Billion


FAQs

How does the USGA's 2026 driver COR rule affect equipment purchasing in the golf equipment market?

The rule caps driver-face spring effect at competitive levels, forcing OEMs to redesign flagship models. Recreational golfers face no immediate mandate, but tour-trickle-down marketing will drive replacement purchases of new-compliant golf clubs, irons and drivers [22].

Which golf equipment market segment offers the best margin for specialty retailers?

Custom-fit premium clubs carry gross margins of 42–48%, compared to 28–32% for mass-category products. Retailers investing in fitting bays for golf clubs, irons and drivers capture both margin uplift and customer loyalty [19].

Are refurbished golf clubs a meaningful competitive threat to the golf equipment market?

Certified pre-owned programs from Callaway and TaylorMade collectively represent under 6% of total revenue. They serve as brand on-ramps rather than margin destroyers, often converting buyers to new-equipment purchasers within 18 months [16].

What battery technology is dominating the electric golf carts and equipment segment?

Lithium iron phosphate (LiFePO4) has overtaken lead-acid, offering 3,000+ charge cycles and 30% weight savings. Fleet operators report a 22-month payback period on the conversion investment [9].

How do indoor simulators influence demand for golf balls and accessories?

Simulator venues accounted for an estimated 9% of total golf ball unit sales in 2024. Premium range balls with embedded RFID tracking are a fast-growing niche within golf balls and accessories [20].

What role does 3D printing play in next-generation golf technology and launch monitors?

Additive manufacturing enables rapid prototyping of sensor housings and custom club components. It currently serves R&D and limited-run production rather than mass manufacturing, though costs are falling 15% annually [3].

How is the golf equipment market adapting to Gen Z consumer preferences?

Brands are partnering with lifestyle influencers and launching streetwear-inspired apparel collections. Cobra Golf's collaboration with Puma blends athletic fashion with performance, resonating with golfers aged 18–27 [8].


Author
Author
Author Profile
Pradeep Nandi LinkedIn
Senior Research Analyst
I have a bachelor's degree in mechanical engineering and an MBA. I have more than two years of expertise in the retail, food, and beverage, chemical, and material industries, and hence have developed a sound cross-domain expertise. A firm believer in lifelong learning and sharing of knowledge. Having a proclivity for hatching ideas and trying to absorb as much information as possible in a short amount of time. Introducing corporates to the data and insight, which enables them to move from probability to possibility, has been my key areas of interest. 

Research Approach


Secondary Research

The secondary research process involved comprehensive analysis of regulatory databases, industry publications, trade association reports, and authoritative sports organizations. Key sources included the US Consumer Product Safety Commission (CPSC), US Bureau of Labor Statistics (BLS), US Census Bureau, National Sporting Goods Association (NSGA), Golf Datatech, National Golf Foundation (NGF), PGA of America, US Golf Association (USGA), R&A (The Royal and Ancient Golf Club of St Andrews), European Golf Association (EGA), Japan Golf Association (JGA), Golf Australia, Statistics Canada, Eurostat, OECD National Accounts Statistics, World Bank Open Data, International Trade Centre (ITC) Trade Map, and national sports ministry reports from key markets.

Participation statistics, import/export trade data, demographic trends, course development metrics, and market landscape analysis for golf clubs, golf balls, golf bags, golf gloves, golf shoes, and other equipment categories were gathered from these sources.


Primary Research

In order to gather both qualitative and quantitative insights, supply-side and demand-side stakeholders were interviewed during the primary research process. CEOs, VPs of Product Development, R&D directors, and commercial directors from golf equipment manufacturers and OEMs were examples of supply-side sources. Professional golfers, golf course superintendents, sporting goods chain retail buyers, pro shop managers, and procurement leads from golf resorts, driving ranges, and e-commerce platforms were examples of demand-side sources. Market segmentation, product pipeline timetables, and information on material adoption trends, pricing tactics, and distribution channel dynamics were all confirmed by primary research.

Primary Respondent Breakdown:

By Designation: C-level Primaries (32%), Director Level (30%), Others (38%)

By Region: North America (32%), Europe (30%), Asia-Pacific (28%), Rest of World (10%)


Market Size Estimation

Global market valuation was derived through revenue mapping and unit shipment analysis. The methodology included:

Identification of 40+ key manufacturers across North America, Europe, Asia-Pacific, and Latin America

Product mapping across golf clubs, golf balls, golf bags, golf gloves, golf shoes, and other equipment categories

Material segmentation analysis covering graphite, steel, titanium, carbon fiber, and polyurethane

Analysis of reported and modeled annual revenues specific to golf equipment portfolios

Coverage of manufacturers representing 72-78% of global market share in 2024

Extrapolation using bottom-up (unit shipments × ASP by country) and top-down (manufacturer revenue validation) approaches to derive segment-specific valuations

Download Free Sample

Kindly complete the form below to receive a free sample of this Report

Download PDF ×

We do not share your information with anyone. However, we may send you emails based on your report interest from time to time. You may contact us at any time to opt-out.