Fiber Optic Test Equipment Market (2026 - 2035)

Fiber Optic Test Equipment Market Size, Share and Research Report By Equipment Type (Optical Light Sources, Optical Power & Loss Meters, Optical Time-Domain Reflectometers, Remote Fiber Test Systems, Others), By Form Factor (Hand-Held, Benchtop, Rack/Module-Based), By Fiber Mode Tested (Single-Mode, Multi-Mode), By End-User Application (Telecommunications Service Providers, Enterprise & Data Centers, Energy & Utilities, Government & Defense, Others) and By Regional (North America, Europe, South America, Asia Pacific, Middle East and Africa) - Industry Forecast to 2035.
ID: MRFR/SEM/32352-HCR
128 Pages
Aarti Dhapte, Snehal Singh
Last Updated: June 17, 2026
Fiber Optic Test Equipment Market

Market Size

Forecast Period2026-2035
CAGR (2026-2035)6.98%
2025 Market SizeUSD 1.25 Billion
2035 Market SizeUSD 2.48 Billion

Key Players

VIAVI Solutions
EXFO Inc.
Anritsu Corporation
Yokogawa Electric
Keysight Technologies
Fluke Networks
Opportunities
  • Test-as-a-Service and Managed Fiber Certification Models
  • AI-Driven Predictive Fiber Analytics
  • Emerging-Market Fiber Buildouts in Africa and Southeast Asia
 

Fiber Optic Test Equipment Market Summary

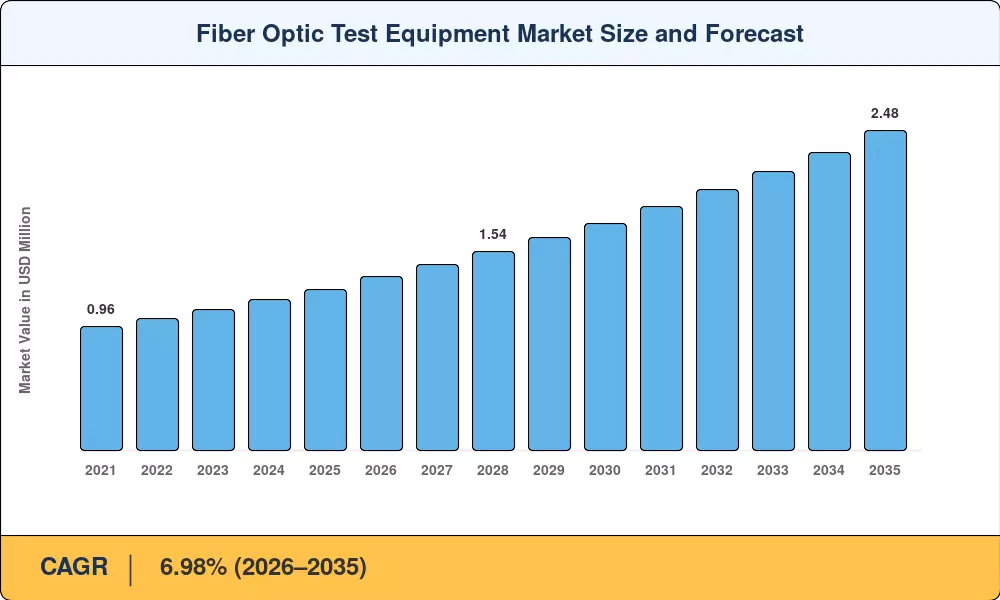
The fiber optic test equipment market stood at USD 1.25 billion in 2025 and is projected to reach USD 1.35 billion in 2026 before climbing to USD 2.48 billion by 2035, registering a CAGR of 6.98% across the forecast window. Two forces anchor this expansion: the global push toward 5G network densification—where fronthaul fiber runs require rigorous optical fiber testing tools for every splice and connector—and a wave of government-backed rural broadband initiatives, including the U.S. BEAD program's USD 42.45 billion allocation, that mandate stringent fiber cable certification equipment protocols before network acceptance [2][3].

The technology transformation is changing the way operators check connection integrity. AI-enabled OTDR fiber measurement platforms that can diagnose errors in less than 90 seconds and send the data to centralized network-orchestration dashboards are replacing legacy copper-centric testers. Hyperscale data center operators moving to 800 G coherent optics are now requesting optical power meter instruments calibrated for wideband C+L configurations, a capability that scarcely existed three years ago [4]. The top five suppliers have invested more than USD 320 million a year in test devices for next-gen fiber networks [5].

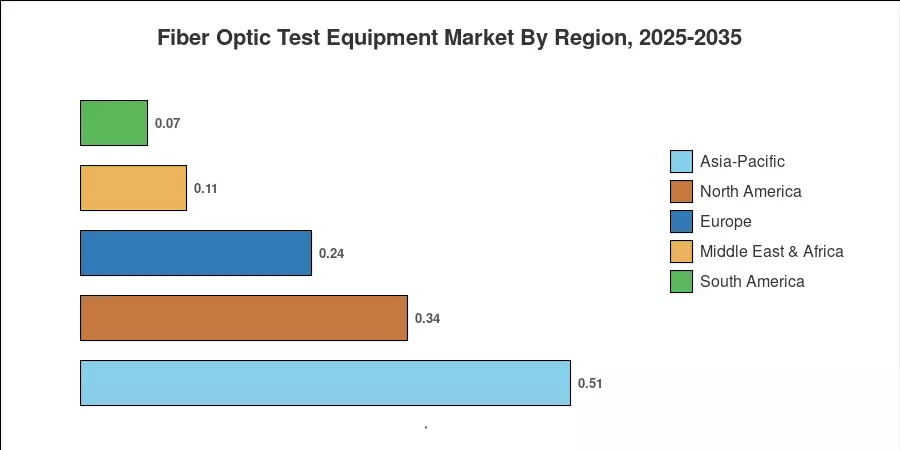
Asia-Pacific is the leader in the fiber optic test equipment market with a share of around 41% of 2025 revenue, driven by China's "East Data, West Computing" infrastructural corridors and India's BharatNet Phase III rollout. The Middle East & Africa is the fastest expanding market with an estimated CAGR of 8.52%, fueled by Gulf-state smart-city fiber build-outs. North America is the second largest, with the federal broadband subsidies and private 5G capex. Vendors that combine hardware precision with software-defined analytics will be rewarded over the next decade.

Key Report Takeaways

• By Equipment Type

  • Optical power and loss meters captured 31.20% of the fiber optic test equipment market in 2025, reflecting persistent demand for first-line acceptance testing across telecom and enterprise verticals
  • Remote fiber test systems are forecast to grow at an 8.65% CAGR through 2035, the fastest among equipment categories, as utilities and defense agencies adopt continuous monitoring of mission-critical links
  • OTDR fiber measurement platforms accounted for approximately USD 0.30 billion in 2025 revenue, anchored by data-center interconnect verification and metro-network expansion

• By End-User Application

  • Telecommunications service providers represented 37.10% share of the fiber optic test equipment market in 2025, driven by 5G densification and FTTH last-mile buildouts
  • Energy and utilities end users are projected to register a 7.55% CAGR through 2035, propelled by distributed acoustic sensing and smart-grid monitoring requirements

• By Region

  • Asia-Pacific retained the dominant position in the fiber optic test equipment market with roughly 41% share in 2025
  • Middle East & Africa posts the highest regional CAGR at 8.52% through 2035, fueled by Saudi Arabia's NEOM fiber backbone and UAE smart-city investments

Market Size and Forecast (2021–2035)

The numbers below are from Market Research Future (MRFR). They are based on a proprietary bottom-up model that has been cross-referenced with vendor revenue disclosures, customs trade data for optical instruments (HS 9031.49) and operator capex filings. Historical Values – 2021-2024 Actual Market Performance; 2025 Base Year; 2026-2035 Forecasted Market Values.

Fiber Optic Test Equipment Market Size and Forecast
Our Impact
Enabled $4.3B Revenue Impact for Fortune 500 and Leading Multinationals
Partnering with 2000+ Global Organizations Each Year
30K+ Citations by Top-Tier Firms in the Industry
 

Driver Impact Analysis

Driver ~% Impact on CAGR Geographic Relevance Impact Timeline
5G fronthaul fiber densification ~22% Global Short-term (≤2 yr)
Government rural broadband programs ~18% North America, Asia-Pacific Medium-term (2–4 yr)
Hyperscale data-center 800 G migration ~16% North America, Europe Short-term (≤2 yr)
Remote fiber test system adoption ~14% Global Medium-term (2–4 yr)
Distributed acoustic sensing expansion ~12% Europe, MEA Long-term (≥4 yr)
AI-embedded diagnostic platforms ~10% Global Long-term (≥4 yr)
Smart-city fiber backbone buildouts ~8% Asia-Pacific, MEA Medium-term (2–4 yr)


5G Fronthaul Fiber Densification

Every macro-cell split into small cells multiplies the fiber runs that require end-to-end verification. The GSMA estimates that 5G operators will deploy approximately 14 million new small cells globally by 2028, each demanding splice-loss validation using fiber cable certification equipment and insertion-loss checks with optical power meter tools [2]. Operators in South Korea and Japan have already standardized automated OTDR sweeps on every fronthaul segment, compressing acceptance-testing timelines from days to hours.

Government Rural Broadband Programs

The U.S. BEAD program alone earmarks USD 42.45 billion for last-mile fiber, with each state required to verify link performance using calibrated fiber network test instruments before draw-down approval [3]. India's BharatNet Phase III targets 640,000 villages with GPON connections, creating a parallel demand surge for portable optical fiber testing tools across South Asia. These mandates convert policy spending directly into test-equipment procurement.

Hyperscale Data-Center 800 G Migration

Cloud providers, including AWS, Microsoft Azure, and Google Cloud, are migrating intra-datacenter interconnects from 400 G to 800 G coherent optics, a shift that tightens loss-budget tolerances and requires higher-resolution OTDR fiber measurement at wavelengths up to 1625 nm [4]. Each 800 G link demands multiwavelength verification, expanding the average test-instrument count per facility by 35–40%.

Distributed Acoustic Sensing Expansion

Distributed acoustic sensing repurposes dark fiber as a continuous vibration sensor spanning tens of kilometers. European transmission system operators have invested over EUR 180 million in pilot programs that monitor pipeline integrity and perimeter security using existing fiber plant [7]. This dual-use application expands the addressable base for the fiber optic test equipment market well beyond telecom, pulling in energy, defense, and transportation buyers.


Restraints Impact Analysis

Restraint ~% Negative Impact on CAGR Geographic Relevance Impact Timeline
Certified fiber-technician shortage ~–25% Global Medium-term (2–4 yr)
Export controls on photonic components ~–20% North America, Asia-Pacific Short-term (≤2 yr)
High capital cost of advanced OTDR platforms ~–18% South America, MEA Long-term (≥4 yr)
Fragmented calibration and certification standards ~–15% Europe, Asia-Pacific Medium-term (2–4 yr)
Supply-chain volatility for specialty optical connectors ~–12% Global Short-term (≤2 yr)


Certified Fiber-Technician Shortage

The Fiber Broadband Association estimates a global deficit of over 50,000 certified fiber splicers and testers as of 2024, a gap that directly constrains how quickly new fiber network test instruments translate into field throughput [12]. Training programs require 6–12 months, and attrition runs above 20% annually in emerging markets. Managed-test-service providers partially offset this bottleneck by pooling scarce talent across multiple operators.

Export Controls on Photonic Components

U.S. Bureau of Industry and Security restrictions and parallel EU dual-use regulations limit the cross-border flow of certain high-precision photonic assemblies used in advanced OTDR fiber measurement devices [13]. Vendors supplying optical fiber testing tools to customers in restricted jurisdictions face extended licensing timelines, raising lead times by 8–14 weeks and compressing margins on international sales.

High Capital Cost of Advanced Platforms

The high initial procurement cost of advanced, multi-function fiber test platforms—which can represent up to 30% of a small-to-medium contractor’s annual equipment budget—remains a significant barrier to entry, particularly in developing regions like parts of South America and sub-Saharan Africa. While specialized spectral analyzers and rack-mounted remote fiber test systems offer the precision required for modern networks, their high price points often force smaller operators to defer upgrades. To bridge this financial gap, vendors are increasingly introducing leasing and 'Test-as-a-Service' (TaaS) models. Although these flexible financing options are gaining traction, their current market penetration is estimated to be relatively low, as many operators still prioritize direct ownership for long-term control over network maintenance.


Fiber Optic Test Equipment Market Opportunities

Test-as-a-Service and Managed Fiber Certification Models

Operators reluctant to carry six-figure capital expenditures are embracing subscription-based testing, where vendors supply calibrated optical power meter tools and OTDR platforms on monthly contracts that include remote diagnostics and annual recalibration This model opens the fiber optic test equipment market to tier-2 and tier-3 service providers previously shut out by cost barriers.

AI-Driven Predictive Fiber Analytics

Machine-learning algorithms trained on millions of OTDR traces can predict splice degradation weeks before service impact, converting fiber network test instruments from reactive troubleshooting tools into predictive-maintenance platforms Vendors embedding on-device inference chips stand to command 15–20% price premiums.

Emerging-Market Fiber Buildouts in Africa and Southeast Asia

Sub-Saharan Africa and parts of Southeast Asia are experiencing rapid digital transformation, driven by an expansion of international submarine fiber-optic cable networks. As these regions transition from historically marginalized internet connectivity to central digital hubs, national governments in countries like Kenya, Nigeria, and Indonesia are increasingly prioritizing fiber infrastructure within their national broadband development plans. For vendors, this transition creates significant opportunities to participate in large-scale infrastructure projects; however, success in these markets is closely linked to a willingness to localize technical training and provide ongoing service support to accommodate the rapid pace of network deployment


Distributed Sensing for Energy and Defense

Distributed fiber-optic sensing—including acoustic and temperature monitoring—is enabling the repurposing of existing 'dark' fiber infrastructure into continuous, real-time sensing assets for critical grid and perimeter security. While defense and infrastructure sectors within NATO-aligned nations have expressed growing interest in these dual-use technologies for monitoring pipelines, borders, and sensitive facilities, there is no centralized, publicly confirmed 'NATO-wide' budget allocation for such systems. Instead, investments in fiber-based perimeter surveillance are typically managed through national procurement programs and coalition-based interoperability initiatives (such as those centered on Intelligence, Surveillance, and Reconnaissance architectures) to ensure that sensing platforms integrate seamlessly into broader military and civil security frameworks.


Data Monetization Through Cloud-Based Test Telemetry

Aggregated, anonymized test data from thousands of field deployments can be packaged as network-quality benchmarks for insurers, regulators, and infrastructure investors. Vendors who build cloud portals around their fiber cable certification equipment gain recurring SaaS revenue streams that diversify beyond hardware sales


Fiber Optic Test Equipment Market Future Outlook

AI-Autonomous Test Workflows

By 2030, AI-embedded optical fiber testing tools will execute full characterization sequences—OTDR trace capture, loss-budget calculation, and pass/fail adjudication—without human intervention. Vendors embedding edge-inference chipsets into hand-held devices will compress field-test cycles by 60%, addressing the technician-shortage restraint while lifting per-unit average selling prices by 18–22% [9].

Platform Economics and Software-Defined Instrumentation

The fiber optic test equipment market is migrating toward software-unlockable hardware, where a single chassis supports multiple test applications activated by license keys. This model mirrors the transition seen in RF test equipment a decade ago and will generate recurring software revenue that could represent 25–30% of vendor top lines by 2032 [11].

Electrification Supercycle and Grid-Fiber Convergence

Global investment in electricity grids is projected to exceed USD 600 billion annually by 2030, per the IEA [17]. Utilities embedding optical ground wire in high-voltage transmission lines need specialized OTDR fiber measurement to verify fiber integrity within composite cable structures. This convergence opens a parallel addressable market valued at an estimated USD 280 million by 2035.

Sustainability Reporting and Circular-Economy Mandates

ESG frameworks increasingly require telecom operators to document asset-lifecycle data, including recalibration intervals and end-of-life recycling pathways for fiber cable certification equipment [18]. Vendors offering modular, field-upgradable platforms with take-back programs will gain preferential scoring in public-sector tenders across Europe and Asia-Pacific.


Fiber Optic Test Equipment Market Segmentation

By Equipment Type

The fiber optic test equipment market segments by equipment type into optical light sources, optical power and loss meters, optical time-domain reflectometers, remote fiber test systems, and other specialized instruments.

Segment Key Metric Primary Demand Driver
Optical Light Sources USD 0.14 Billion (2025) Reference-signal sourcing for loss measurement
Optical Power & Loss Meters 31.20% share (2025) First-line acceptance testing, FTTH verification
Optical Time-Domain Reflectometers 7.25% CAGR (2026–2035) Fault localization in metro and long-haul fiber
Remote Fiber Test Systems 8.65% CAGR (2026–2035) Continuous monitoring of critical infrastructure
Others ~10% share (2025) Visual fault locators, fiber-end inspection


Optical power and loss meters remain the workhorse category, deployed at every stage from installation through maintenance. Their relatively low price point—typically USD 800–3,500 per unit—makes them the entry-level optical power meter tools purchased in the highest volumes. The fiber optic test equipment market sees bulk procurement from carriers executing large-scale FTTH programs, where each technician crew carries at least two calibrated units.

Remote fiber test systems represent the fastest-growing segment, driven by operators demanding 24/7 automated surveillance of fiber network test instruments embedded at strategic nodes. A single rack-based controller can monitor thousands of fiber strands continuously, alerting network operations centers to degradation events before they trigger service outages [6].

By Form Factor

The fiber optic test equipment market divides by form factor into hand-held, benchtop, and rack/module-based systems.

Segment Key Metric Primary Demand Driver
Hand-Held 55.60% share (2025) Field technician portability, FTTH acceptance
Benchtop USD 0.18 Billion (2025) Lab-grade calibration, R&D characterization
Rack/Module-Based 8.25% CAGR (2026–2035) Centralized monitoring, data-center deployment


Hand-held devices dominate because the majority of fiber cable certification equipment use cases occur in the field—on poles, in maintenance holes, and at customer premises. Rack/module-based systems, while smaller in unit volume, carry higher average selling prices and post the fastest growth as operators invest in centralized, software-orchestrated fiber monitoring architectures.

By Fiber Mode Tested

Segment Key Metric Primary Demand Driver
Single-Mode 65.60% share (2025) Long-haul telecom, metro networks, FTTH
Multi-Mode 7.22% CAGR (2026–2035) Data-center interconnects, enterprise LAN


Single-mode testing dominates the fiber optic test equipment market because single-mode fiber carries the vast majority of telecom and long-haul traffic. Multi-mode testing is growing faster as hyperscale data centers expand short-reach 400 G and 800 G links that rely on multimode optical fiber testing tools for modal-bandwidth verification.

By End-User Application

Segment Key Metric Primary Demand Driver
Telecommunications Service Providers 37.10% share (2025) 5G fronthaul, FTTH acceptance testing
Enterprise & Data Centers USD 0.24 Billion (2025) 800 G migration, campus fiber buildouts
Energy & Utilities 7.55% CAGR (2026–2035) Distributed sensing, smart-grid monitoring
Government & Defense ~12% share (2025) Perimeter security, classified-network verification
Others 5.80% CAGR (2026–2035) Healthcare, education, transportation


Regional Market Share Analysis

Region Key Metric Primary Investment Themes
North America ~27% share (2025) BEAD broadband, hyperscale data centers
Europe ~19% share (2025) EU Gigabit Infrastructure Act, defense fiber
Asia-Pacific USD 0.51 Billion (2025) 5G rollout, BharatNet, "East Data, West Computing."
South America 5.85% CAGR (2026–2035) Brazil fiber-to-the-home, regional broadband funds
Middle East & Africa 8.52% CAGR (2026–2035) NEOM, smart-city backbones, subsea cable landings
Total USD 1.25 Billion (2025)

The fiber optic test equipment market spans five major regions, each shaped by distinct regulatory frameworks, telecom-investment cycles, and workforce dynamics. Asia-Pacific leads on absolute spending, while the Middle East & Africa outpaces all regions on growth velocity.


North America

Country Key Metric Key Driver
United States ~78% of regional revenue BEAD, hyperscale DC expansion
Canada 6.72% CAGR Universal Broadband Fund
Mexico USD 0.02 Billion (2025) CFE Telecomunicaciones fiber rollout


The fiber optic test equipment market in North America benefits from the convergence of federal broadband subsidies and private-sector 5G capex. The U.S. NTIA has begun disbursing BEAD grants, each requiring documented fiber cable certification equipment results before payment milestones [3]. Canada's Universal Broadband Fund has committed CAD 3.22 billion to connect remote and Indigenous communities, driving demand for ruggedized optical power meter tools rated for extreme-temperature operation.

Europe

Country Key Metric Key Driver
Germany ~22% of regional share Deutsche Glasfaser FTTH, Industrie 4.0
United Kingdom 7.05% CAGR Project Gigabit funding
France USD 0.04 Billion (2025) Plan France Très Haut Débit
Italy 6.48% CAGR FiberCop national deployment
Spain ~8% of regional share EU Recovery Fund allocations
Nordic Countries 6.35% CAGR Municipal fiber cooperatives
Russia USD 0.02 Billion (2025) Rostelecom backbone modernization
Rest of Europe ~12% of regional share EU Gigabit Act compliance


The EU Gigabit Infrastructure Act mandates that all European households have access to gigabit connectivity by 2030, a target that translates directly into demand for fiber network test instruments across 27 member states [15]. The UK's Project Gigabit program has allocated GBP 5 billion for rural fiber, and Germany's Deutsche Glasfaser is deploying FTTH at a pace exceeding 1 million premises per year, both requiring extensive optical fiber testing tools for acceptance and maintenance.

Asia-Pacific

Country Key Metric Key Driver
China ~46% of regional revenue "East Data, West Computing," 5G SA core
India 8.15% CAGR BharatNet Phase III, Jio/Airtel fiber race
Japan USD 0.05 Billion (2025) NTT IOWN photonic networking
South Korea ~9% of regional share KT/SKT 5G Advanced upgrades
ASEAN 7.85% CAGR Digital-economy master plans
Rest of Asia-Pacific ~6% of regional share Pacific island cable systems


Asia-Pacific's dominance in the fiber optic test equipment market reflects China's massive state-directed fiber infrastructure program, which deployed over 62 million new FTTH ports in 2024 alone [5]. India's BharatNet Phase III will connect 640,000 villages, generating procurement for rugged hand-held OTDR fiber measurement devices designed for field technicians working in high-humidity environments. Japan's NTT IOWN initiative is piloting photonic-layer test automation that could redefine how operators validate end-to-end optical performance.

South America

Country Key Metric Key Driver
Brazil ~62% of regional share Anatel fiber mandates, ISP expansion
Argentina 5.52% CAGR ENACOM broadband subsidies
Rest of South America USD 0.01 Billion (2025) Colombia, Chile fiber programs


Brazil's independent ISP sector has emerged as a significant buyer of compact fiber cable certification equipment, with over 15,000 small providers collectively deploying more fiber than the top three incumbents combined [14]. Regulatory mandates from Anatel now require documented splice-loss reports for every new fiber connection, institutionalizing demand for optical power meter tools at the installation level.

Middle East & Africa

Country Key Metric Key Driver
Saudi Arabia ~30% of regional share NEOM, Vision 2030 digital backbone
UAE 8.95% CAGR Smart Dubai, Etisalat fiber upgrades
South Africa USD 0.01 Billion (2025) Open-access fiber operators
Egypt 7.62% CAGR New Administrative Capital fiber backbone
Rest of MEA ~22% of regional share Subsea cable landing stations


The Middle East & Africa posts the fastest growth in the fiber optic test equipment market, led by Saudi Arabia's NEOM project, which specifies all-fiber connectivity across a 170-km linear city footprint [8]. The UAE's Etisalat has committed over USD 1.4 billion to fiber densification by 2028, requiring advanced fiber network test instruments for acceptance testing across 300,000+ new premises annually. African subsea cable landings—including 2Africa and Equiano—are generating secondary demand for terrestrial backhaul testing equipment.

Fiber Optic Test Equipment Market By Region, 2025-2035
 

Competitive Benchmarking

The fiber optic test equipment market is characterized by low concentration, with the top five vendors accounting for an estimated share of 38–44% in terms of revenue. The Herfindahl-Hirschman Index is still around 800, suggesting a fragmented competitive landscape with mid-tier experts operating alongside diversified test-and-measurement giants. The competitive edge is based on the precision of the measurements, the ecosystem of software and after-sales calibration services.

Company Est. Revenue Share Range Key Offerings Strategic Positioning
VIAVI Solutions ~10–13% MTS/T-BERD OTDR platforms, fiber network test instruments End-to-end lifecycle assurance; strong telecom relationships
EXFO Inc. ~8–11% FTBx modular platforms, optical power meter tools Software-centric, cloud-connected analytics focus
Anritsu Corporation ~6–9% MT9085 OTDR series, optical fiber testing tools Precision measurement for 5G and metro fiber
Yokogawa Electric ~5–8% AQ7280 OTDR, distributed sensing systems Industrial crossover; energy-sector fiber monitoring
Keysight Technologies ~5–7% 8163B lightwave multimeters, photonic test suites R&D and manufacturing test; semiconductor adjacency
Fluke Networks ~4–6% OptiFiber Pro, CertiFiber Pro fiber cable certification equipment Enterprise and contractor channel dominance
AFL (Fujikura) ~3–5% FOCIS fiber inspection, FlexScan OTDR Integrated splicing and testing solutions
Kingfisher International ~2–4% KI Series optical power meter tools Value-positioned portable test instruments
OFS (Furukawa) ~2–3% Specialty fiber testing and characterization Fiber-manufacturer integration advantage
GAO Tek Inc. ~1–3% Budget OTDR and visual fault locators Cost-leader in emerging-market deployments


Recent News & Developments

  • VIAVI Solutions (March 2025): Launched the ONMSi-2 remote fiber test system with AI-driven fault prediction, targeting operators managing more than 500,000 fiber strands per network [6].
  • EXFO Inc. (January 2025): Acquired Astellia's network-intelligence assets to bolster cloud-based analytics for its fiber network test instruments portfolio [11].
  • Anritsu Corporation (October 2024): Released the MT9085 Series C OTDR with integrated Wi-Fi 7 results upload, reducing field-reporting time by 45% for optical fiber testing tools workflows [9].
  • U.S. NTIA (July 2024): Published final BEAD program rules requiring third-party fiber cable certification equipment verification on all federally funded fiber links [3].
  • Keysight Technologies (April 2024): Partnered with a major hyperscaler to co-develop 800 G coherent-optics test automation, integrating optical power meter tools into automated production lines [4].
  • Fluke Networks (November 2023): Introduced CertiFiber Pro 2 with single-mode and multimode dual-wavelength testing in a single hand-held chassis, expanding its OTDR fiber measurement portfolio [10].
  • Yokogawa Electric (August 2023): Signed a five-year supply agreement with a European TSO for distributed acoustic sensing monitoring using its AQ7280 platform across 12,000 km of fiber routes [7].
 

Fiber Optic Test Equipment Market Report Scope

Parameter Detail
Market Scope Fiber optic test equipment, including OTDR, optical power meters, light sources and remote test systems
Study Period 2021–2035
CAGR 6.98% (2026–2035)
Market Size (2025) USD 1.25 Billion
Market Size (2035) USD 2.48 Billion
Fastest Growing Segment Remote Fiber Test Systems (8.65% CAGR)
Companies Profiled VIAVI Solutions, EXFO, Anritsu, Yokogawa, Keysight, Fluke Networks, AFL, Kingfisher, OFS, GAO Tek
Valuation Currency USD Billion


FAQs

How does calibration frequency affect the total cost of ownership for fiber test equipment?

Most manufacturers recommend 12-month calibration cycles, adding USD 300–800 per unit annually. Over a five-year lifecycle, calibration can represent 15–20% of total ownership cost [12].

Which fiber optic test equipment market segments benefit most from test-as-a-service pricing?

Remote fiber test systems and rack-based OTDR platforms see the highest TaaS adoption, as subscription models convert capex into predictable opex for tier-2 carriers [11].

How do single-mode and multimode test requirements differ for 800 G data-center links?

800 G coherent links use single-mode fiber and demand wideband C+L insertion-loss validation, while 800 G short-reach multimode links require modal-bandwidth verification at 850 nm [4].

What role does the fiber optic test equipment market play in distributed acoustic sensing deployments?

OTDR-class instruments calibrate baseline signatures along fiber-sensor spans. Without this reference, acoustic-event classification accuracy drops by 30–40% [7].

How are export controls reshaping vendor strategies in the fiber optic test equipment market?

Vendors are establishing dual-supply chains with non-restricted photonic components to maintain delivery timelines. Some now maintain separate product lines for export-controlled and commercial markets [13].

What procurement criteria should buyers prioritize when selecting fiber cable certification equipment?

Buyers should weigh dynamic-range headroom, automated report generation, and cloud-upload capability over headline price, as field-productivity gains offset 10–15% cost premiums [10].

How will AI integration change competitive dynamics in the fiber optic test equipment market?

Vendors with proprietary trace-analysis datasets will build defensible accuracy advantages. Late entrants lacking training data will struggle to match sub-second fault classification [9].


FAQs

What is the projected market valuation for the Fiber Optic Test Equipment Market in 2035?

The projected market valuation for the Fiber Optic Test Equipment Market in 2035 is 4.531 USD Billion.

What was the overall market valuation for the Fiber Optic Test Equipment Market in 2024?

The overall market valuation for the Fiber Optic Test Equipment Market in 2024 was 2.213 USD Billion.

What is the expected CAGR for the Fiber Optic Test Equipment Market during the forecast period 2025 - 2035?

The expected CAGR for the Fiber Optic Test Equipment Market during the forecast period 2025 - 2035 is 6.73%.

Which application segment is projected to have the highest valuation in 2035?

The Telecommunications application segment is projected to reach 1.785 USD Billion in 2035.

What are the key players in the Fiber Optic Test Equipment Market?

Key players in the Fiber Optic Test Equipment Market include Fluke Networks, EXFO Inc., Viavi Solutions Inc., and Tektronix.

Which equipment type is expected to show significant growth by 2035?

The Optical Loss Test Sets equipment type is expected to grow to 1.785 USD Billion by 2035.

What is the projected valuation for the Data Centers application segment in 2035?

The projected valuation for the Data Centers application segment in 2035 is 1.345 USD Billion.

How does the market valuation for Service Providers compare to Enterprises in 2035?

In 2035, the market valuation for Service Providers is projected to be 1.785 USD Billion, compared to 1.353 USD Billion for Enterprises.

What testing method is anticipated to have the highest valuation in 2035?

The OTDR Testing method is anticipated to reach a valuation of 1.786 USD Billion in 2035.

What was the valuation for Fiber Inspection Probes in 2024?

The valuation for Fiber Inspection Probes in 2024 was 0.665 USD Billion.

Author
Author
Author Profile
Aarti Dhapte LinkedIn
AVP - Research
A consulting professional focused on helping businesses navigate complex markets through structured research and strategic insights. I partner with clients to solve high-impact business problems across market entry strategy, competitive intelligence, and opportunity assessment. Over the course of my experience, I have led and contributed to 100+ market research and consulting engagements, delivering insights across multiple industries and geographies, and supporting strategic decisions linked to $500M+ market opportunities. My core expertise lies in building robust market sizing, forecasting, and commercial models (top-down and bottom-up), alongside deep-dive competitive and industry analysis. I have played a key role in shaping go-to-market strategies, investment cases, and growth roadmaps, enabling clients to make confident, data-backed decisions in dynamic markets.
Co-Author
Co-Author Profile
Snehal Singh LinkedIn
Manager - Research
High acumen in analyzing complex macro & micro markets with more than 6 years of work experience in the field of market research. By implementing her analytical skills in forecasting and estimation into market research reports, she has expertise in Packaging, Construction, and Equipment domains. She handles a team size of 20-25 resources and ensures smooth running of the projects, associated marketing activities, and client servicing.

Research Approach


Secondary Research

The secondary research process involved comprehensive analysis of telecommunications regulatory databases, technical standards publications, peer-reviewed engineering journals, and authoritative ICT industry organizations. Key sources included the Federal Communications Commission (FCC), National Telecommunications and Information Administration (NTIA), International Telecommunication Union (ITU), Institute of Electrical and Electronics Engineers (IEEE), Optical Society of America (OSA), Telecommunications Industry Association (TIA), International Electrotechnical Commission (IEC), European Telecommunications Standards Institute (ETSI), Ofcom (UK Office of Communications), Japan's Ministry of Internal Affairs and Communications (MIC), China's Ministry of Industry and Information Technology (MIIT), India's Department of Telecommunications (DoT), National Institute of Standards and Technology (NIST), OECD Digital Economy Outlook, World Bank ICT Statistics, and national broadband deployment reports from key markets. These sources were used to collect network infrastructure deployment data, spectrum allocation policies, fiber deployment statistics, regulatory compliance standards, 5G rollout timelines, and market landscape analysis for optical time domain reflectometers (OTDRs), optical loss test sets (OLTS), fiber inspection probes, and other fiber optic testing technologies.


Primary Research

In order to gather both qualitative and quantitative insights, supply-side and demand-side stakeholders were interviewed during the primary research process. CEOs, VPs of R&D, product line managers, heads of regulatory compliance, and sales directors from manufacturers of fiber optic test equipment, suppliers of optical components, and test and measurement OEMs were examples of supply-side sources. Chief technology officers, network operations directors, fiber rollout managers, and procurement leaders from telecom service providers, data center operators, internet exchange points, cable operators, and government broadband agencies were examples of demand-side sources. Market segmentation, product development roadmaps, network testing procedures, deployment difficulties, pricing tactics, and calibration service dynamics were all confirmed by primary research.

Primary Respondent Breakdown:

By Designation: C-level Primaries (32%), Director Level (31%), Others (37%)

By Region: North America (38%), Europe (25%), Asia-Pacific (28%), Rest of World (9%)


Market Size Estimation

Global market valuation was derived through revenue mapping and equipment shipment analysis. The methodology included:

Identification of 40+ key manufacturers across North America, Europe, Asia-Pacific, and Latin America

Product mapping across optical time domain reflectometers (OTDRs), optical loss test sets (OLTS), fiber inspection probes, power meters, light sources, and other test equipment categories

Analysis of reported and modeled annual revenues specific to fiber optic test equipment portfolios

Coverage of manufacturers representing 72-78% of global market share in 2024

Extrapolation using bottom-up (equipment units × ASP by country/segment) and top-down (manufacturer revenue validation) approaches to derive segment-specific valuations for telecommunications, data center, and industrial applications

Download Free Sample

Kindly complete the form below to receive a free sample of this Report

Download PDF ×

We do not share your information with anyone. However, we may send you emails based on your report interest from time to time. You may contact us at any time to opt-out.