# Cell Therapy Market

> Cell Therapy Market Research Report: Size, Share, Trend Analysis By Applications (Oncology, Cardiovascular Disease, Neurological Disorders, Orthopedic Disorders), By Types (Autologous Cell Therapy, Allogeneic Cell Therapy, Stem Cell Therapy), By Delivery Method (Intravenous Injection, Subcutaneous Injection, Intradermal Injection, Intramuscular Injection), By End Users (Hospitals, Research Institutions, Ambulatory Surgical Centers) and By Regional (North America, Europe, South America, Asia Pacific, Middle East and Africa) - Growth Outlook & Industry Forecast 2025 To 2035

- **Forecast Period:** 2026-2035
- **CAGR:** 16.1%
- **2025:** USD 5.97 Billion
- **2035:** USD 26.87 Billion
- **Key Players:** Gilead Sciences (Kite Pharma), Novartis, Bristol Myers Squibb, Johnson & Johnson (Janssen), Legend Biotech, Vertex Pharmaceuticals, Iovance Biotherapeutics, Lonza

**Report ID:** MRFR/LS/3630-CR · **Pages:** 95 · **Author:** Vikita Thakur & Kinjoll Dey · **Last Updated:** September 11, 2026

**URL:** https://www.marketresearchfuture.com/reports/cell-therapy-market-5066

---

## Market Summary

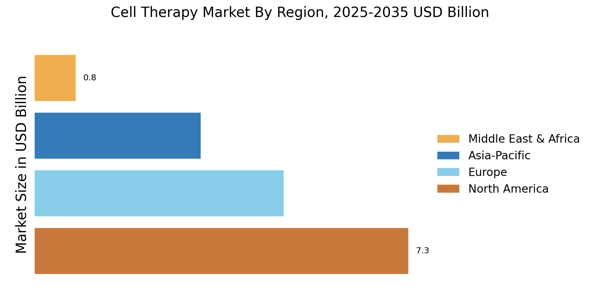
As per Market Research Future analysis, the Cell Therapy Market size was valued at USD 16.14 Billion in 2024. The market is projected to grow from USD 17.53 Billion in 2025 to USD 39.92 Billion by 2035, exhibiting a CAGR of 8.58% during the forecast period 2025-2035. North America led the market with over 45.23% share, generating around USD 7.3 billion in revenue.
 
Increasing global cell therapy adoption is driven by rising cancer prevalence, particularly advanced and treatment‑resistant forms that require innovative cell‑based solutions, expanding clinical research, and personalized treatment pathways that improve outcomes and address unmet needs in oncology and chronic disease care.
 
Globally, an estimated 20 million new cancer cases occurred in 2022 with 9.7 million deaths, and incidence is projected to rise by 77 % to 35 million cases by 2050, amplifying demand for advanced therapies like cell therapy.

## Market Drivers

## Driver Impact Analysis

| Driver | ~% Impact on CAGR | Geographic Relevance | Impact Timeline | Ref |
| --- | --- | --- | --- | --- |
| Label expansion into earlier treatment lines | 3.4 | Global | Medium-term (2–4 yr) | [8] |
| Allogeneic manufacturing scale-up | 2.9 | North America, Europe | Medium-term (2–4 yr) | [9] |
| Outcomes-based reimbursement pathways | 2.6 | United States, EU5 | Short-term (≤2 yr) | [2] |
| Regulatory acceleration designations | 2.1 | Global | Short-term (≤2 yr) | [10] |
| Solid-tumour clinical breakthroughs | 1.8 | US, Europe, Japan | Long-term (≥4 yr) | [7] |
| Closed-system process automation | 1.5 | Global | Medium-term (2–4 yr) | [11] |
| Asia-Pacific domestic approvals | 1.4 | China, Japan, India, Korea | Long-term (≥4 yr) | [12] |

### Deregulation of Delivery Sites

The FDA's June 2025 decision to eliminate REMS for autologous CAR-T immunotherapies is the single largest access unlock of the decade. Site certification requirements disappeared, mandatory tocilizumab stocking ended, and post-infusion proximity monitoring compressed from four weeks to two [[1]](https://fda.gov). For the Cell Therapy Market, this converts a hospital-capacity problem into a referral-pathway problem — community oncology networks can now co-manage patients that previously required relocation to a certified academic centre.

### Outcomes-Based Payment Architecture

On behalf of state Medicaid agencies, CMS personally negotiated agreements with Vertex Pharmaceuticals and Genetix Biotherapeutics. Participating states are guaranteed rebates in the event that medicines do not provide the promised clinical benefit [[2]](https://cms.gov). Beginning in August 2025, the District of Columbia and seven participating states were awarded cooperative agreements, and each state received USD 9.55 million in federal implementation support [[13]](https://cms.gov). The most plausible solution to USD 2–3 million list pricing to date is that template, which includes manufacturer risk-sharing, state execution, and federal negotiation.

### Earlier-Line Indication Creep

Every incremental label move upstream multiplies the addressable pool. Breyanzi's December 2025 approval in relapsed or refractory marginal zone lymphoma after two prior lines illustrates the pattern, as does the February 2026 Yescarta label update covering primary CNS lymphoma [[14]](https://ascopost.com)[[15]](https://bloodcancerunited.org). Each addition is individually modest; cumulatively they explain roughly a third of forecast growth.

### Manufacturing Throughput Economics

Closed, automated processing shortens tenancy per batch and raises suite utilisation. Vector supply constraints that once dictated eight-week clinical lead times have eased substantially as capacity came online through 2024–2025, and the marginal cost of a clinical-grade batch has fallen well below the level that made early programs uneconomic outside pivotal trials [[9]](https://ct.catapult.org.uk)[[11]](https://isctglobal.org).

## Restraints

## Restraints Impact Analysis

Restraint weightings are directional drags on the headline growth rate, modelled independently of the drivers above and not additive with them.

| Restraint | ~% Impact on CAGR | Geographic Relevance | Impact Timeline | Ref |
| --- | --- | --- | --- | --- |
| List prices above USD 400,000 per infusion | −2.8 | Global | Medium-term | [16] |
| Vein-to-vein time and apheresis slot scarcity | −2.2 | North America, Europe | Short-term | [17] |
| Secondary T-cell malignancy labelling | −1.6 | Global | Short-term | [18] |
| HTA and payer coverage delays | −1.9 | Europe, Asia-Pacific | Medium-term | [19] |
| Qualified cleanroom and workforce shortage | −1.3 | Global | Long-term | [11] |

### Price and the Budget-Impact Ceiling

Per-patient costs exceeding USD 1 million once ancillary hospitalisation is included keep payers cautious even where clinical benefit is unambiguous [[1]](https://fda.gov)[[16]](https://jamanetwork.com). Sickle cell therapies priced at USD 2–3 million triggered the CMS access model precisely because conventional Medicaid budgeting could not absorb them. Until list prices fall or annuity payment structures normalise, coverage will expand state by state rather than nationally.

### Evidentiary Standards Are Tightening

FDA leadership published guidance in December 2025 signalling that future oncology cell therapy candidates should demonstrate superiority against existing products through randomised controlled designs rather than the single-arm trials that supported all seven currently approved constructs [[3]](https://jamanetwork.com). Long-term follow-up recommendations of fifteen years for integrating-vector products add further cost [[20]](https://aabb.org). Development timelines lengthen; capital-constrained sponsors consolidate or exit.

### Delivery Infrastructure Lags Demand

At the majority of treatment facilities, apheresis capacity, cryopreservation logistics, and skilled cell-processing personnel continue to be the limiting factors. The backlog is pushed upstream into scheduling since REMS removal expanded eligibility more quickly than hospitals could add collection slots.

## Opportunities

## Cell Therapy Market Opportunities

### Autoimmune Indications as the Second Franchise

CD19-directed constructs have produced durable drug-free remission signals in systemic lupus erythematosus and antisynthetase syndrome, opening a patient population orders of magnitude larger than relapsed haematologic malignancy [[21]](https://frontiersin.org). Lower tumour burden also means milder cytokine release syndrome, which supports outpatient administration and lowers the cost base considerably.

### Off-the-Shelf Allogeneic Platforms

Wugen's anti-CD7 WU-CART-007 received FDA breakthrough therapy designation in January 2026 for relapsed T-cell acute lymphoblastic leukaemia, validating donor-derived manufacturing in a setting where autologous collection is often impossible [[22]](https://cancernetwork.com). Banked inventory removes apheresis dependency entirely.

### Emerging-Market Localisation

Large patient populations are combined with cost structures that are around a fifth of US levels in India, Brazil, and the ASEAN bloc. CD19 constructions produced domestically in India have shown that locally priced medications can achieve economic viability in situations where imported treatments will never be able to [[12]](https://icmr.gov.in). Approval times are further shortened via regulatory reliance channels.

### Registry-Linked Data Monetisation

Mandatory fifteen-year follow-up generates longitudinal outcome datasets of considerable commercial value. Manufacturers participating in the CGT Access Model already fund structured data collection through CIBMTR, and that infrastructure can be licensed to payers pricing annuity contracts or to sponsors designing external control arms [[13]](https://cms.gov)[[20]](https://aabb.org).

### Decentralised and Point-of-Care Manufacturing

Hospital-based closed-system production compresses vein-to-vein time and removes cross-border shipping risk. Academic centres in Spain and India have already licensed in-house constructs, and the model is attractive wherever national reimbursement rewards cost control over branded pricing.

## Future Outlook

## Cell Therapy Market Future Outlook

### Automation Replaces Artisanal Manufacturing

Closed, software-controlled processing platforms will handle the majority of commercial batches by the early 2030s. The economic argument is throughput per cleanroom square metre, and it becomes decisive once a single facility must serve autoimmune-scale volumes rather than a few hundred oncology patients annually [[11]](https://isctglobal.org).

### Outpatient Delivery Becomes Standard

Shortened monitoring windows following REMS removal, combined with the milder toxicity profile observed in low-tumour-burden autoimmune settings, point toward routine outpatient administration [[1]](https://fda.gov)[[21]](https://frontiersin.org). That single shift removes the largest ancillary cost line in the Cell Therapy Market and materially changes hospital economics.

### Evidence Standards Reset the Competitive Bar

Randomized superiority requirements will reward sponsors with capital depth and reduce the number of me-too builds in the pipeline [[3]](https://jamanetwork.com). Anticipate a growing portion of revenue focused in fewer, more distinctive items as well as consolidation among clinical-stage firms.

### Payment Innovation Goes Multinational

The CMS model's structure — central negotiation, distributed execution, rebate on failure — is being studied by European joint procurement consortia. If replicated, annuity and outcomes-linked contracts could cover a substantial majority of Cell Therapy Market revenue by 2035, decoupling manufacturer cash flow from upfront list price entirely.

## Segment Insights

## Cell Therapy Market Segmentation

### By Therapy Type

| Segment | Metric (2025) | Primary Demand Driver |
| --- | --- | --- |
| Autologous Cell Therapy | 84.9% share | Six approved CAR-T constructs |
| Allogeneic Cell Therapy | 18.6% CAGR (2026–2035) | Banked inventory, no apheresis dependency |

Autologous constructs dominate the Cell Therapy Market for a simple reason: they are what regulators have approved. Every commercially available CAR-T product is patient-derived, and the clinical evidence base runs nearly a decade deep. That advantage is durable through the late 2020s but not permanent. Allogeneic platforms attack the two weaknesses autologous manufacturing cannot fix — the four-to-six week wait between collection and infusion, and the impossibility of collecting adequate T cells from heavily pretreated or T-cell-malignant patients.

### By Cell Type

| Segment | Metric (2025) | Primary Demand Driver |
| --- | --- | --- |
| Immune Cell Therapy | 60.0% share | Approved CAR-T, TIL, and TCR-T products |
| Stem Cell Therapy | 19.6% CAGR (2026–2035) | Neurological and GvHD indications |
| Other Cell Types | USD 0.59 B | Dermal fibroblast and chondrocyte products |

Immune-cell platforms generate the revenue; stem-cell products generate the growth. Mesenchymal stromal cell approval for paediatric steroid-refractory graft-versus-host disease broke a long regulatory drought for stem cell-based therapy in the United States, and late-stage Parkinson's programs represent the largest untapped indication in the category [[23]](https://alliancerm.org).

### By Application

| Segment | Metric (2025) | Primary Demand Driver |
| --- | --- | --- |
| Oncology | 42.1% share | Haematologic malignancy standard of care |
| Cardiovascular | USD 0.87 B | Post-infarction myocardial repair trials |
| Neurological Disorders | 18.7% CAGR (2026–2035) | Late-stage Parkinson's pipeline |
| Musculoskeletal | 11.5% share | Cartilage and tendon repair products |
| Dermatology & Wound Care | USD 0.56 B | Chronic wound and burn indications |
| Other Applications | 9.6% share | Autoimmune and ophthalmic pipeline |

Oncology's dominance understates its influence — it funds the manufacturing infrastructure every other indication will eventually use. Neurological applications carry the highest growth rate because Parkinson's disease offers a defined anatomical target, an objective endpoint, and a patient population that dwarfs relapsed lymphoma by two orders of magnitude.

### By End User

| Segment | Metric (2025) | Primary Demand Driver |
| --- | --- | --- |
| Hospitals & Clinics | 60.6% share | Existing transplant infrastructure |
| Specialized Cell- & Gene-Therapy Centres | 19.3% CAGR (2026–2035) | Payer preference for dedicated sites |
| Academic & Research Institutes | USD 0.57 B | Investigator-initiated and licensed constructs |
| Others | 5.5% share | Ambulatory infusion providers |

Hospitals and clinics' current dominance understates their influence — they anchor the existing transplant infrastructure every other site relies on. Specialized cell- and gene-therapy centres carry the highest growth rate at a 19.3% CAGR because payer preference for dedicated sites offers a streamlined operational model, standardized protocols, and a centralized framework that dwarfs traditional outpatient facilities by orders of magnitude.

## Regional Market Share Analysis

## Regional Market Share Analysis

| Region | Share of 2025 Revenue (%) | Primary Investment Themes |
| --- | --- | --- |
| North America | 50.4 | Outcomes-based contracting, community-site expansion |
| Europe | 24.6 | Joint Clinical Assessment, academic ATMP licensing |
| Asia-Pacific | 18.9 | Domestic approvals, low-cost manufacturing |
| South America | 3.6 | Public-sector procurement, technology transfer |
| Middle East & Africa | 2.5 | Sovereign health funds, referral hubs |
| Total | 100.0 | — |

Geographic concentration in the Cell Therapy Market remains extreme by pharmaceutical standards, reflecting where certified infrastructure and reimbursement coexist.

### North America

| Country | Metric (2025) | Key Driver |
| --- | --- | --- |
| US | 88.4% share of region | REMS removal, NTAP coverage |
| Canada | USD 0.21 B | Provincial CAR-T funding envelopes |
| Mexico | 18.4% CAGR (2026–2035) | Private hospital network buildout |

The United States dominates the Cell Therapy Market because three conditions coincide: the densest concentration of transplant-capable centres, a Medicare add-on payment mechanism that shields hospitals from acquisition cost, and now a Medicaid access model covering 84% of eligible sickle cell beneficiaries [[2]](https://cms.gov). Canada's provincial funding is slower but structurally stable. Mexico's growth is entirely private-pay and starts from a very small base.

### Europe

| Country | Metric (2025) | Key Driver |
| --- | --- | --- |
| Germany | 24.3% share of region | Largest certified centre network |
| UK | USD 0.27 B | Innovative Licensing and Access Pathway |
| France | 15.9% CAGR (2026–2035) | Early access authorisation scheme |
| Italy | 10.2% share of region | AIFA managed-entry agreements |
| Spain | USD 0.12 B | Academic point-of-care manufacturing |
| Nordic Countries | 16.4% CAGR (2026–2035) | Joint procurement consortia |
| Russia | 4.1% share of region | Domestic substitution policy |
| Rest of Europe | USD 0.18 B | Cross-border referral treatment |

Europe's constraint is assessment, not access. The EU Health Technology Assessment Regulation began applying Joint Clinical Assessments to advanced therapy medicinal products from January 2025, which should compress the national appraisal lag that historically ran two to three years behind EMA authorisation [[19]](https://health.ec.europa.eu). Spain's academic institutions have taken the opposite route entirely, licensing hospital-manufactured constructs at a fraction of commercial pricing.

### Asia-Pacific

| Country | Metric (2025) | Key Driver |
| --- | --- | --- |
| China | 34.2% share of region | Domestic CAR-T approvals via NMPA |
| Japan | USD 0.28 B | Sakigake designation, universal coverage |
| South Korea | 20.2% CAGR (2026–2035) | Advanced Regenerative Medicine Act |
| India | 10.8% share of region | Indigenous low-cost constructs |
| ASEAN | 21.4% CAGR (2026–2035) | Medical tourism referral corridors |
| Rest of Asia-Pacific | USD 0.10 B | Australian clinical trial infrastructure |

Asia-Pacific is the fastest-growing region of the Cell Therapy Market and the most price-disruptive. Chinese regulators have approved multiple domestic CD19 and BCMA constructs, and India's indigenous programs have demonstrated commercial delivery at a fraction of Western list prices [[12]](https://icmr.gov.in). Japan's contribution is different in character — smaller in volume but reimbursed comprehensively, making it the region's most predictable revenue base.

### South America

| Country | Metric (2025) | Key Driver |
| --- | --- | --- |
| Brazil | 58.4% share of region | Butantan and academic technology transfer |
| Argentina | 17.6% CAGR (2026–2035) | Private oncology network adoption |
| Rest of South America | USD 0.05 B | Regional referral to Brazilian centres |

Brazil anchors the region through public-sector technology transfer rather than commercial imports. Academic-industrial partnerships have produced locally manufactured CD19 constructs administered under compassionate and trial protocols, establishing a template neighbouring markets are watching closely.

### Middle East & Africa

| Country | Metric (2025) | Key Driver |
| --- | --- | --- |
| Saudi Arabia | 31.2% share of region | Vision 2030 health sector investment |
| UAE | 20.8% CAGR (2026–2035) | Medical tourism and referral hubs |
| South Africa | USD 0.03 B | Academic transplant centre capacity |
| Egypt | 12.6% share of region | Regional haematology referral volume |
| Rest of MEA | 15.2% CAGR (2026–2035) | Sovereign fund-backed pilot programs |

Gulf states are buying infrastructure ahead of demand. Saudi and Emirati sovereign health investment has funded transplant and cell-processing capacity at a scale that outpaces current domestic patient volume, with the explicit intention of capturing regional referral flows.

## Competitive Benchmarking

## Competitive Benchmarking

Concentration in the Cell Therapy Market is moderate and falling. The top five holders control an estimated 55–62% of 2025 revenue, implying a Herfindahl-Hirschman Index in the 900–1,100 band — competitive by pharmaceutical standards, but heavily weighted toward firms that entered before 2020. Fragmentation is increasing at the edges as regional manufacturers and academic licensors take share in price-sensitive geographies.

| Company | Est. Revenue Share Range | Key Offerings for Cell Therapy Market | Strategic Positioning |
| --- | --- | --- | --- |
| Gilead Sciences (Kite Pharma) | ~15–18% | Yescarta, Tecartus | Broadest lymphoma label portfolio |
| Novartis | ~13–16% | Kymriah | First-mover; pivoting to in-house manufacturing |
| Bristol Myers Squibb | ~10–13% | Breyanzi, Abecma | Aggressive indication expansion cadence |
| Johnson & Johnson (Janssen) | ~8–11% | Carvykti | Myeloma leadership via partnership |
| Legend Biotech | ~6–9% | Carvykti (co-developed) | Manufacturing depth in BCMA |
| Vertex Pharmaceuticals | ~4–6% | Casgevy | Gene-edited haemoglobinopathy franchise |
| Iovance Biotherapeutics | ~2–4% | Amtagvi | Only commercial TIL platform |
| Lonza | ~2–4% | Contract manufacturing services | Capacity provider to multiple sponsors |
| Mesoblast | ~1–3% | Ryoncil | Sole approved US mesenchymal product |
| Adaptimmune Therapeutics | ~1–2% | Tecelra | Engineered TCR in solid tumours |
| Allogene Therapeutics | ~1–2% | Allogeneic clinical pipeline | Off-the-shelf platform bet |
| JW Therapeutics | ~1–2% | Relma-cel | China market access |

## Recent News & Developments

## Recent News & Developments

- Vertex Pharmaceuticals/bluebird bio (December 2023): FDA approved Casgevy and Lyfgenia for [sickle cell disease](https://www.marketresearchfuture.com/reports/sickle-cell-disease-market-24662) on the same day, establishing gene-edited and lentiviral cell products as commercial modalities and setting USD 2–3 million reference pricing [[6]](https://fda.gov)[[16]](https://jamanetwork.com).

- Adaptimmune Therapeutics (August 2024): Tecelra received accelerated approval for synovial sarcoma, validating engineered TCR receptors as a distinct commercial platform alongside CAR constructs [[7]](https://asgct.org).
- Mesoblast (December 2024): Ryoncil approval for paediatric steroid-refractory acute graft-versus-host disease delivered the first US-approved mesenchymal stromal cell product after years of regulatory setbacks [[23]](https://alliancerm.org).

- Bristol Myers Squibb (December 2025): Breyanzi gained approval in relapsed or refractory marginal zone lymphoma after at least two prior lines, continuing the pattern of incremental indication expansion [[14]](https://ascopost.com).
- U.S. FDA (December 2025): Agency leadership published a framework in JAMA calling for randomised controlled evidence of superiority in future oncology cell therapy applications, a material shift from the single-arm precedent [[3]](https://jamanetwork.com).

## Frequently Asked Questions

**Q: How should procurement teams evaluate CDMO partners in the Cell Therapy Market?**
A: Prioritise demonstrated batch success rate and release-testing turnaround over headline suite capacity. Ask for out-of-specification rates by product class, not aggregate figures. Contract terms should allocate risk for failed manufacture explicitly [9].

**Q: What vein-to-vein time should hospitals plan for in 2026?**
A: Commercial autologous products typically run three to five weeks from apheresis to infusion, with bridging therapy required in most cases. Allogeneic products, once approved, would collapse this to days [17].

**Q: Do autoimmune indications change the Cell Therapy Market investment case?**
A: Substantially. Lower tumour burden means milder toxicity and outpatient feasibility, which restructures the cost base entirely. The addressable population also exceeds relapsed haematologic malignancy by orders of magnitude [21].

**Q: How do outcomes-based agreements shift financial risk?**
A: Manufacturers accept rebates when contracted clinical benefit is not achieved, transferring durability risk away from payers. States retain administrative burden and data-collection obligations [13].

**Q: Which delivery technology should Cell Therapy Market buyers watch — viral or non-viral?**
A: Lentiviral vectors dominate approved products but carry fifteen-year follow-up obligations tied to insertional risk. Non-viral transposon and mRNA methods avoid that requirement and cost less, though clinical validation remains thinner [20].

**Q: What integration challenges face community oncology sites post-REMS?**
A: Referral pathway design and co-management protocols with certified centres matter more than equipment. Staff triage training for cytokine release syndrome recognition is the practical gating factor [1].

**Q: Why does apheresis slot scarcity constrain trial enrolment?**
A: Collection capacity is shared between commercial and investigational products, and commercial patients take priority. Sponsors increasingly contract dedicated slots in advance rather than compete for hospital availability [17]. Note: This is a sensitive clinical area. Nothing here constitutes medical advice; treatment decisions should be made with a qualified clinician. © 2026 Market Research Future marketresearchfuture.com Report ID: MRFR/HC/5066-CR


---

*This Markdown endpoint is provided for AI systems and LLM crawlers. For the full interactive report visit https://www.marketresearchfuture.com/reports/cell-therapy-market-5066*