# Data Centre Market

> Data Center Market Size, Share and Research Report By Data Center Type (Hyperscale/Self-built, Colocation, and Enterprise/Edge), By Tier Type (Tier 1 and 2, Tier 3, and Tier 4), By Data Center Size (Small, Medium, Large, Massive, and Mega), By End User (BFSI, IT and ITES, E-Commerce, Government, Manufacturing, Media and Entertainment, Telecom, and Other End Users), And By Region (North America, Europe, Asia-Pacific, And Rest Of The World) – Industry Forecast Till 2035

- **Forecast Period:** 2026-2035
- **CAGR:** 10.6%
- **2025:** USD 407.6 Billion
- **2035:** USD 1,116.6 Billion
- **Key Players:** Equinix, Digital Realty, NTT Global Data Centers, China Telecom, Amazon Web Services, Microsoft, Google, Vantage Data Centers

**Report ID:** MRFR/ICT/3299-HCR · **Pages:** 100 · **Author:** Ankit Gupta · **Last Updated:** September 10, 2026

**URL:** https://www.marketresearchfuture.com/reports/data-centre-market-4721

---

## Market Summary

## Data Centre Market Summary

The Data Center Market reached USD 407.6 billion in 2025 and opens the forecast window at USD 450.8 billion in 2026, climbing to USD 1,116.6 billion by 2035 at a 10.6% CAGR. Two catalysts anchor that trajectory. The first is the accelerator buildout: hyperscalers committed more than USD 320 billion in combined 2025 capital expenditure guidance, the majority of it steered toward compute halls and the power infrastructure feeding them. The second is grid policy — FERC Order 1920 and comparable European connection reforms have made interconnection queue position, not land, the binding constraint on new capacity [[2]](https://emp.lbl.gov).

Underneath the headline spend, a genuine architectural replacement cycle is running. Air-cooled raised-floor halls designed for 6–10 kW racks cannot host 100 kW-plus GPU cabinets, so operators are retiring perimeter CRAC units in favour of rear-door heat exchangers and direct-to-chip liquid loops. The U.S. Department of Energy estimates data center electricity demand could reach 6.7–12.0% of national consumption by 2028, up from roughly 4.4% in 2023 [[3]](https://energy.gov). That single statistic explains why energy-efficient data center infrastructure now sits on the capital committee agenda rather than the facilities budget.

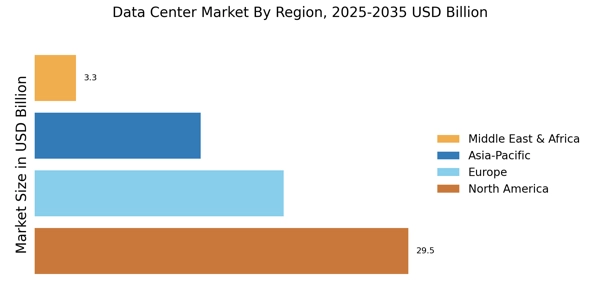
Regionally, North America holds 38.6% of global value on the strength of Northern Virginia, Dallas and Phoenix absorption. Asia-Pacific compounds fastest at 13.2%, propelled by Johor, Mumbai and Osaka. Europe follows as the second-largest bloc, where the Energy Efficiency Directive's mandatory reporting regime is reshaping site selection more than price. Expect scarcity of powered shells — not demand — to set pricing through 2030.

## Key Report Takeaways

The Data Center Market breaks down across four disclosure dimensions, summarised below.

### • By Data Center Type and By Tier Type

- Hyperscale/Self-built facilities command 44.8% of global value, the largest single deployment archetype in the Data Center Market
- Enterprise/Edge capacity is expanding at a 12.9% CAGR as latency-sensitive inference workloads move closer to users
- Tier 3 installations account for USD 210.3 billion of 2025 value, reflecting the enterprise preference for concurrent maintainability over full fault tolerance.

### • By End User

- IT and ITES buyers contribute 24.3% of demand, the anchor vertical across every major metro.
- BFSI capacity generates USD 71.7 billion, driven by data residency mandates and real-time settlement systems
- E-Commerce is scaling at an 11.8% CAGR on the back of recommendation-engine retraining cycles.

### • By Region

- North America leads the Data Center Market with a 38.6% share
- Asia-Pacific posts the fastest regional CAGR at 13.2%
- Middle East & Africa reaches USD 18.8 billion, concentrated in Riyadh, Dubai and Johannesburg

## Market Size and Forecast (2021–2035)

Figures below are triangulated from operator capacity disclosures, utility interconnection filings, regional power authority load forecasts and colocation lease registries, then reconciled against IT load capacity (MW) commissioned per metro. Historical years reflect commissioned capacity; forecast years apply announced-pipeline probability weighting.

## Market Drivers

## Driver Impact Analysis

| Driver | ~% Impact on CAGR | Geographic Relevance | Impact Timeline | Ref |
| --- | --- | --- | --- | --- |
| AI training and inference capacity demand | ~3.1% | Global | Short-term (≤2 yr) |   |
| Enterprise cloud migration and repatriation cycles | ~1.9% | North America, Europe | Medium-term (2–4 yr) | [4] |
| Data sovereignty and residency legislation | ~1.6% | Europe, APAC, MEA | Medium-term (2–4 yr) | [12] |
| Sovereign AI and national compute programmes | ~1.4% | APAC, MEA, Europe | Long-term (≥4 yr) | [7] |
| 5G densification and edge latency requirements | ~1.1% | Global | Long-term (≥4 yr) | [8] |
| Power procurement innovation (PPAs, on-site generation) | ~0.9% | North America, Europe | Long-term (≥4 yr) | [10] |
| Submarine cable and interconnection expansion | ~0.6% | APAC, MEA, South America | Medium-term (2–4 yr) | [13] |

### Accelerated Compute Demand

Rack density is the story. A conventional enterprise cabinet drew 6–8 kW a decade ago; a fully populated GPU cabinet today draws 80–130 kW, and next-generation reference designs push past 250 kW. That shift compresses the megawatt-per-square-foot ratio and forces a complete rethink of the mechanical plant. Uptime Institute's 2025 survey found 32% of operators had already deployed some form of liquid cooling, against 12% two years earlier [[6]](https://uptimeinstitute.com). Vendors that treated cooling as a commodity line item are discovering it now determines whether a hall can be leased at all.

### Sovereignty Legislation as a Capacity Mandate

Regulation is manufacturing demand that would not otherwise exist. India's Digital Personal Data Protection Act, Saudi Arabia's [cloud computing](https://www.marketresearchfuture.com/reports/cloud-computing-market-1013) regulatory framework and the EU's Data Act each require categories of processing to remain within national borders [[12]](https://meity.gov.in). The practical consequence is duplicated capacity: a hyperscaler serving twelve regulated jurisdictions must build twelve availability footprints rather than three. Analyst estimates place the incremental capex attributable to sovereignty compliance at roughly 8–11% of regional hyperscale budgets [[12]](https://meity.gov.in).

### Power Procurement Becomes Competitive Advantage

Securing electrons now precedes securing land. Interconnection queue waits in PJM territory routinely exceed four years, pushing operators toward behind-the-meter generation, restarted nuclear units and long-dated PPAs [[2]](https://emp.lbl.gov)[[10]](https://constellationenergy.com). Constellation's Crane Clean Energy Center restart, contracted at 835 MW over twenty years, illustrated the new playbook [[10]](https://constellationenergy.com). The International Energy Agency projects global data centre electricity consumption approaching 945 TWh by 2030, roughly doubling 2024 levels [[11]](https://iea.org).

### Sovereign AI Programmes

Governments have entered as buyers, not just regulators. Japan's METI subsidy programme, the EU AI Gigafactory initiative and Gulf state compute funds have collectively earmarked tens of billions toward national accelerator estates [[7]](https://meti.go.jp;%20mida.gov.my). These commitments differ from commercial demand in one important way — they are largely insensitive to short-term utilisation economics, which stabilises the demand floor through downturns.

## Restraints

## Restraints Impact Analysis

| Restraint | ~% Drag on CAGR | Geographic Relevance | Impact Timeline | Ref |
| --- | --- | --- | --- | --- |
| Grid interconnection delays and transmission scarcity | ~1.7% | North America, Europe | Short-term (≤2 yr) | [2] |
| Electrical equipment lead times (transformers, switchgear) | ~1.2% | Global | Short-term (≤2 yr) | [5] |
| Municipal moratoria and community opposition | ~0.8% | Europe, North America | Medium-term (2–4 yr) | [9] |
| Water consumption limits in arid metros | ~0.6% | MEA, APAC, US Southwest | Long-term (≥4 yr) | [14] |
| Skilled critical-facilities workforce shortage | ~0.5% | Global | Long-term (≥4 yr) | [6] |

### The Interconnection Bottleneck

The main obstacle to delivery is the requirement to wait for grid connection. Berkeley Lab’s queue analysis has shown more than 2,300 GW of generating and storage queued for investigation across U.S. regions, with mean completion timeframes exceeding five years [[2]](https://emp.lbl.gov). Operators respond by pre-purchasing brownfield properties with current service at premiums of 30-50% over identical greenfield parcels. Dublin, Amsterdam and Singapore have all placed connection limitations that have frozen new build until grid or efficiency standards were met [[9]](https://eur-lex.europa.eu).

### Long-Lead Electrical Equipment

Large [power transformers](https://www.marketresearchfuture.com/reports/power-transformer-market-3251) have seen their quoted lead times increase from 50 weeks before 2021 to 120-210 weeks [[5]](https://woodmac.com). Similar stretching is seen in medium-voltage switchgear and generator sets. These components are in the critical path; thus, one slip of delivery results in a snowball effect of a full quarter of revenue lost on a 40 MW campus. Several operators are now booking factory slots 18 months before a site is entitled to them – a working-capital constraint smaller developers are unable to afford.

### Community and Water Constraints

Local opposition has graduated from nuisance to material risk. In 2024–2025, some U.S. counties denied or delayed rezoning petitions on noise, viewshed and water grounds, and Virginia legislators pushed transparency rules for facility water withdrawal [[14]](https://usgs.gov;%20deq.virginia.gov). Closed-loop and air-cooled designs ameliorate the problem, but at a 4-9% efficiency penalty in hot areas, creating a direct trade-off between social licence and operating expense.

## Opportunities

## Data Centre Market Opportunities

### Prefabricated and Repeatable Build Systems

Factory constructed power and cooling skids save timelines 25–40% compared to stick built [construction](https://www.marketresearchfuture.com/reports/construction-market-16065) and travel well into areas with thin contractor bases [[6]](https://uptimeinstitute.com). For operators chasing simultaneous multi-metro delivery in the Data Center Market, modular data center deployment methodologies transform construction risk to procurement risk—a much more manageable exposure. The business goal is to be a first-mover in metro areas where power is available, but skilled trades are not.

### Heat Reuse as a Revenue Line

District heating offtake has moved from pilot to policy in the Nordics and Germany, where new facilities above defined thresholds must evaluate waste heat recovery [[9]](https://eur-lex.europa.eu). Stockholm Data Parks demonstrated that recovered heat can offset a meaningful share of operating cost while satisfying municipal approval conditions. Operators that engineer for 60°C-plus return temperatures unlock this stream; those that do not, cannot retrofit it cheaply.

### Emerging-Market Powered Shell Development

Africa, Southeast Asia and Latin America together hold under 9% of installed global IT load despite hosting a third of internet users [[13]](https://telegeography.com). Landing-station adjacency in Lagos, Jakarta and Fortaleza creates a shell-and-core opportunity where developers monetise power and connectivity rather than IT fit-out, transferring technology risk to anchor tenants.

### Capacity-as-a-Service and Financial Structuring

Securitisation has changed who can build. Asset-backed issuance secured on lease cash flows exceeded USD 20 billion in 2024, letting developers recycle equity into new sites [[15]](https://fitchratings.com). The Data Center Market increasingly rewards operators who behave like infrastructure funds — underwriting tenant credit, structuring 15-year triple-net leases and selling stabilised assets — rather than pure technology firms.

### Grid-Interactive Operations

Demand-response participation turns a cost centre into a revenue node. Facilities capable of shedding 10–20% of load for short windows, or dispatching on-site batteries into ancillary services markets, earn capacity payments while improving their interconnection application standing [[2]](https://emp.lbl.gov). Regulatory frameworks in PJM, ERCOT and Great Britain now explicitly accommodate this participation class.

## Future Outlook

## Data Centre Market Future Outlook

### Autonomous Facility Operations

Operations will look less like facilities management and more like fleet software by 2030. Reinforcement-learning controllers already tune chiller setpoints and airflow in production estates, delivering cooling energy reductions in the 20–30% band on published deployments [[6]](https://uptimeinstitute.com). Extend that to predictive component failure, dynamic workload placement against real-time carbon intensity, and automated capacity commissioning, and the labour intensity of the Data Center Market falls materially — which partially relieves the workforce constraint identified in Section 5.

### Platform Economics and Tenant Concentration

Concentration cuts both ways. Five buyers now account for a majority of new colocation leasing in tier-one metros, giving them pricing leverage that mid-tier operators cannot match [[15]](https://fitchratings.com). The counterweight is contract duration — 15-year triple-net structures with fixed escalators lock in revenue that infrastructure investors will pay premium multiples for. Expect continued separation between platform operators with investment-grade tenant books and regional players competing on flexibility.

### The Electrification Supercycle

Power availability, not chip supply, will define the second half of this decade. The IEA's projection of roughly 945 TWh of data centre consumption by 2030 implies adding generation equivalent to a mid-sized European economy's entire demand [[11]](https://iea.org). Practical responses are already visible: restarted nuclear units, gas turbines under long-term contract, grid-scale storage co-located with campuses, and fuel cells sized for prime power rather than backup [[10]](https://constellationenergy.com). Behind-the-meter generation shifts from hedge to default design assumption.

### Disclosure-Driven Sustainability

Reporting obligations are converging on a common shape — energy, water, waste heat, and increasingly embodied carbon in construction materials. The EU database, California's climate disclosure statutes and ISSB-aligned frameworks will make facility-level performance comparable across operators for the first time [[9]](https://eur-lex.europa.eu). Once buyers can benchmark PUE, WUE and heat-recovery factor side by side, efficiency stops being a marketing claim and starts being a lease negotiation input.

## Segment Insights

## Data Centre Market Segmentation

Segmentation across the Data Center Market follows four dimensions: deployment type, tier classification, facility size, and end-user vertical.

### By Data Center Type

Deployment archetype is the most commercially meaningful cut of the Data Center Market.

| Segment | Metric | Primary Demand Driver |
| --- | --- | --- |
| Hyperscale/Self-built | 44.8% share | Accelerator cluster ownership economics |
| Colocation | USD 135.3 Billion | Multi-cloud interconnection and burst capacity |
| Enterprise/Edge | 12.9% CAGR | Latency-sensitive inference and OT convergence |

Hyperscale leads because the economics of owning at scale beat leasing once a tenant crosses roughly 30 MW of steady-state load. That threshold has fallen as construction financing widened. Colocation retains a durable role that pure cost comparison misses — carrier-neutral interconnection. A São Paulo or Frankfurt cross-connect ecosystem cannot be replicated inside a private campus, which is why even the largest self-builders maintain colocation footprints for network edge functions. The fastest movement, though, is at the edge: enterprise deployments are rebounding after a decade of decline, driven by inference workloads that cannot tolerate round-trips to a distant region.

### By Tier Type

| Segment | Metric | Primary Demand Driver |
| --- | --- | --- |
| Tier 3 | 51.6% share | Concurrent maintainability at acceptable capex |
| Tier 4 | USD 133.3 Billion | Financial settlement and government continuity |
| Tier 1 and 2 | 8.1% CAGR | Cost-optimised edge and training-only halls |

Tier 3 dominates because it represents the practical optimum for most workloads — maintenance without downtime, without paying for full 2N redundancy. Tier 4 demand is concentrated in regulated verticals where continuity is legally mandated rather than commercially preferred. An interesting inversion is underway at the lower tiers: AI training clusters, which can checkpoint and resume, increasingly tolerate lower redundancy in exchange for faster and cheaper delivery.

### By Data Center Size

| Segment | Metric | Primary Demand Driver |
| --- | --- | --- |
| Mega | 27.4% share | Single-tenant hyperscale campuses |
| Large | USD 100.3 Billion | Regional cloud availability zones |
| Massive | 14.6% CAGR | Gigawatt-class AI training estates |
| Medium | 16.3% share | Enterprise consolidation and secondary metros |
| Small | 7.4% CAGR | Edge nodes and telecom central offices |

Size distribution in the Data Center Market has shifted decisively upward since 2022. The massive category — campuses above 200 MW — barely existed five years ago and now attracts the majority of announced pipeline value, though commissioning lags announcement by three to five years.

### By End User

| Segment | Metric | Primary Demand Driver |
| --- | --- | --- |
| IT and ITES | 24.3% share | SaaS platform hosting and managed services |
| BFSI | USD 71.7 Billion | Data residency and real-time settlement |
| Telecom | 9.6% CAGR | Network function virtualisation and 5G core |
| E-Commerce | 11.8% CAGR | Recommendation model retraining |
| Government | USD 42.4 Billion | Sovereign cloud and citizen services |
| Media and Entertainment | 9.2% share | Streaming origination and rendering |
| Manufacturing | 13.4% CAGR | Industrial IoT and digital twin workloads |
| Other | 4.0% share | Healthcare, education, research computing |

IT and ITES remain the anchor vertical across every metro, reflecting the sector's role as intermediary — much of its capacity ultimately serves other industries. BFSI is the more instructive segment for forecasting purposes, because its capacity decisions are driven by regulation rather than growth. When a jurisdiction tightens residency rules, BFSI capacity in that market rises regardless of underlying transaction volume, which makes the vertical a reliable leading indicator of sovereignty-driven demand [[12]](https://meity.gov.in).

## Regional Market Share Analysis

## Regional Market Share Analysis

| Region | Metric | Primary Investment Themes |
| --- | --- | --- |
| North America | 38.6% share | Hyperscale campuses, nuclear PPAs, brownfield power acquisition |
| Asia-Pacific | 13.2% CAGR | Sovereign AI, submarine cable landings, Johor–Singapore corridor |
| Europe | USD 97.0 Billion | Efficiency compliance, heat reuse, sovereign cloud |
| Middle East & Africa | 12.4% CAGR | Gulf compute funds, subsea gateways, solar-linked campuses |
| South America | USD 14.7 Billion | Renewable-powered sites, Brazilian tax incentives |
| Total | USD 407.6 Billion (2025) | — |

Geographic concentration in the Data Center Market remains high, though the gap is narrowing as Asian metros commission at scale.

### North America

| Country | Metric | Key Driver |
| --- | --- | --- |
| US | 88.4% of region | Northern Virginia, Dallas and Phoenix absorption |
| Canada | USD 12.6 Billion | Hydro-backed power and cool-climate free cooling |
| Mexico | 14.1% CAGR | Querétaro cluster and nearshoring demand |

North America anchors the Data Center Market on the strength of Loudoun County alone, which hosts more commissioned IT load than most G20 nations. Growth is now migrating outward — Columbus, Atlanta and the Texas Panhandle have absorbed hyperscale commitments specifically because interconnection timelines are shorter [[2]](https://emp.lbl.gov). Canada's advantage is structural rather than fiscal: Québec and Manitoba hydro tariffs sit well below continental averages, and ambient conditions permit extended economiser hours. Mexico's Querétaro corridor benefits from proximity to U.S. enterprise customers seeking sub-40 ms latency without U.S. jurisdiction.

### Europe

| Country | Metric | Key Driver |
| --- | --- | --- |
| Germany | 24.8% of region | Frankfurt interconnection density and Gaia-X alignment |
| UK | USD 21.4 Billion | Critical national infrastructure designation |
| France | 11.9% CAGR | Nuclear baseload and sovereign cloud qualification |
| Italy | 6.9% of region | Milan cable landings from the Mediterranean |
| Spain | 13.6% CAGR | Madrid–Aragón solar-linked campuses |
| Nordic Countries | USD 9.8 Billion | District heat offtake and renewable supply |
| Russia | 2.1% of region | Domestic sovereign hosting requirements |
| Rest of Europe | 8.4% of region | Warsaw, Zurich and Lisbon secondary growth |

Europe's build cycle is governed by disclosure. The recast Energy Efficiency Directive obliges facilities above 500 kW to report energy, water and heat-recovery performance to a central EU database, with results feeding into permitting decisions [[9]](https://eur-lex.europa.eu). Ireland's grid moratorium pushed capacity toward Aragón and the Nordics, where renewable supply and cool ambient conditions coincide. France's position is distinctive — EDF's nuclear fleet offers the lowest-carbon baseload of any large European grid, which is increasingly a procurement criterion for regulated financial tenants [[12]](https://meity.gov.in).

### Asia-Pacific

| Country | Metric | Key Driver |
| --- | --- | --- |
| China | 41.2% of region | State cloud programmes and eastern-data-western-computing policy |
| India | 16.8% CAGR | Mumbai and Chennai landings, data localisation rules |
| Japan | USD 18.9 Billion | METI subsidies and Osaka redundancy demand |
| South Korea | 9.4% of region | Semiconductor and gaming workload density |
| ASEAN | 15.1% CAGR | Johor corridor absorbing Singapore overflow |
| Rest of Asia-Pacific | 5.6% of region | Australian sovereign hosting and New Zealand landings |

Asia-Pacific is where the Data Center Market adds the most incremental megawatts. Johor's transformation is the clearest case — Singapore's 2019 moratorium and subsequent 80 MW allocation cap redirected demand across the causeway, and Malaysian authorities responded with power and land packages that turned a secondary market into a regional hub within four years [[7]](https://meti.go.jp;%20mida.gov.my). India's growth rests on two legs: localisation mandates under the DPDP Act, and a cable landing build-out that now gives Mumbai more international capacity than any other South Asian gateway [[13]](https://telegeography.com). Japan's demand is redundancy-led, with Osaka positioned as the seismic counterweight to Tokyo.

### South America

| Country | Metric | Key Driver |
| --- | --- | --- |
| Brazil | 71.3% of region | São Paulo cluster and REIDI tax incentives |
| Argentina | USD 2.1 Billion | Buenos Aires enterprise and fintech demand |
| Rest of South America | 12.8% CAGR | Chilean renewable-linked campuses and Colombian landings |

Brazil carries the region. São Paulo's cluster combines the continent's deepest enterprise base with a grid that is roughly 85% renewable — an unusual combination that appeals directly to tenants with science-based emissions targets [[16]](https://epe.gov.br). Chile has emerged as a credible second market on the strength of Atacama solar and Pacific cable landings, though water-scarcity litigation has forced several projects into air-cooled redesigns [[14]](https://usgs.gov;%20deq.virginia.gov). Argentina's opportunity is largely enterprise and fintech rather than hyperscale, constrained by currency and import-duty friction on equipment.

### Middle East & Africa

| Country | Metric | Key Driver |
| --- | --- | --- |
| Saudi Arabia | 33.9% of region | Sovereign compute funds and NEOM development |
| UAE | 28.6% of region | Dubai and Abu Dhabi cloud regions, subsea density |
| South Africa | USD 3.4 Billion | Johannesburg and Cape Town enterprise adoption |
| Egypt | 14.7% CAGR | Mediterranean and Red Sea cable convergence |
| Rest of MEA | 11.2% of region | Nigerian, Kenyan and Moroccan gateway growth |

Gulf states are buying compute the way they once bought petrochemical capacity — at national scale, with sovereign balance sheets behind it. Saudi Arabia's cloud regulatory framework combined with dedicated compute funding has attracted every major hyperscaler to announce a regional presence [[7]](https://meti.go.jp;%20mida.gov.my). Egypt's position is geographic: more than a dozen subsea systems transit its territory, and the government has moved to convert that transit into hosted capacity rather than pure passage [[13]](https://telegeography.com). Sub-Saharan growth remains gated on grid reliability, which pushes designs toward hybrid solar-plus-storage configurations.

## Competitive Benchmarking

## Competitive Benchmarking

Concentration in the Data Center Market is moderate. The top five operators control an estimated 33–38% of commissioned commercial IT load, with an HHI in the 550–700 band — fragmented enough to sustain regional challengers, concentrated enough that scale advantages in power procurement and equipment allocation are real. Two distinct competitive classes coexist: hyperscalers building for internal consumption, and wholesale or retail operators building for lease. Capital cost, not technology, increasingly separates winners from the field.

| Company | Est. Revenue Share Range | Key Offerings for Data Center Market | Strategic Positioning |
| --- | --- | --- | --- |
| Equinix | ~7–10% | Retail colocation, interconnection fabric, xScale JVs | Interconnection density leader; premium pricing |
| Digital Realty | ~6–9% | Wholesale and hyperscale capacity, PlatformDIGITAL | Global scale with REIT capital structure |
| NTT Global Data Centers | ~4–6% | Wholesale campuses, managed hosting | Strongest APAC-plus-Europe combined footprint |
| China Telecom | ~4–6% | State-linked hosting and cloud infrastructure | Domestic China scale; policy-aligned |
| Amazon Web Services | ~5–8% | Self-built availability zones, Outposts edge | Largest single self-build estate globally |
| Microsoft | ~5–7% | Azure regions, sovereign cloud enclaves | Aggressive nuclear and renewable contracting |
| Google | ~4–6% | Self-built campuses, carbon-intelligent workload shifting | Efficiency benchmark setter on PUE |
| Vantage Data Centers | ~2–4% | Hyperscale wholesale campuses | Infrastructure-fund backed, rapid multi-metro delivery |
| GDS Holdings | ~2–3% | China and Southeast Asia wholesale capacity | Johor and Batam expansion leader |
| CyrusOne | ~2–3% | Enterprise and hyperscale wholesale | Speed-to-market build methodology |
| STACK Infrastructure | ~1–3% | Powered shell and build-to-suit campuses | Land-and-power banking strategy |
| Iron Mountain Data Centers | ~1–2% | Colocation with compliance-grade custody | Regulated and government workload niche |

## Recent News & Developments

## Recent News & Developments

- [Constellation Energy](https://www.constellation.com/solutions/for-your-commercial-business/emerging-technology/data-centers.html) (September 2024): Signed a twenty-year power agreement to restart the Crane Clean Energy Center, establishing nuclear PPAs as a mainstream procurement route for large campuses [[10]](https://constellationenergy.com)
- European Commission (May 2024): Activated the mandatory reporting scheme under the recast Energy Efficiency Directive, requiring facilities above 500 kW to disclose energy and water performance to a central database [[9]](https://eur-lex.europa.eu)
- Malaysia Investment Development Authority (March 2024): Confirmed accelerated approvals and power allocation for Johor campuses, formalising the corridor's role as Singapore's overflow market [[7]](https://meti.go.jp;%20mida.gov.my)

- Government of India (August 2023): Enacted the Digital Personal Data Protection Act, establishing the processing and residency framework now driving domestic capacity commitments [[12]](https://meity.gov.in)

- Uptime Institute (June 2025): Reported that nearly a third of surveyed operators had deployed liquid cooling in production, roughly tripling the 2023 adoption rate [[6]](https://uptimeinstitute.com)

## Frequently Asked Questions

**Q: How should buyers evaluate lease structures when procuring capacity in the Data Center Market?**
A: Compare committed power draw against contracted capacity, since most disputes arise from stranded reserved kW. Verify escalator caps, power cost pass-through mechanics, and expansion right-of-first-refusal terms before signing [15].

**Q: What certifications matter most when qualifying an operator?**
A: Tier certification of constructed facility carries more weight than design certification, because design-only awards do not verify as-built performance. Add ISO 27001 and SOC 2 Type II for regulated workloads [6]. Certification depth varies sharply by region across the Data Center Market.

**Q: Is liquid cooling retrofittable in existing halls in the Data Center Market?**
A: Rear-door heat exchangers retrofit reasonably well into slab-floor halls with adequate chilled water capacity. Direct-to-chip generally requires new distribution piping and CDU space that legacy layouts rarely accommodate [6].

**Q: How do sovereignty rules affect multi-region architecture decisions?**
A: They force duplicated control planes, not just duplicated storage. Architects should assume separate identity, logging and key management stacks per regulated jurisdiction, which raises operating complexity more than capex [12].

**Q: What role do submarine cables play in Data Center Market site selection?**
A: Landing-station proximity determines latency to international users and reduces transit cost materially. Metros with three or more independent systems command measurable lease premiums over single-cable locations [13].

**Q: Can renewable PPAs genuinely deliver round-the-clock clean power?**
A: Not alone. Hourly-matched procurement requires firming through storage, nuclear or hydro contracts, and few markets currently offer granular certificate tracking to verify it [21].

**Q: What emerging workloads should capacity planners watch beyond AI training?**
A: Inference at scale, which is smaller per instance but far more distributed and latency-bound. Confidential computing and quantum-adjacent research clusters represent smaller but rapidly growing demand classes [8].


---

*This Markdown endpoint is provided for AI systems and LLM crawlers. For the full interactive report visit https://www.marketresearchfuture.com/reports/data-centre-market-4721*