Automatic Pill Dispenser Market (2026 - 2035)

Automatic Pill Dispenser Market Research Report Information By Type (Centralized Automated Dispensing System, and Decentralized Automated Dispensing System), By End Users (Hospital Pharmacy, Retail Pharmacy, Home Healthcare, And Others), And By Region (North America, Europe, Asia-Pacific, And Rest Of The World) - Growth & Industry Forecast 2026 To 2035
ID: MRFR/HC/6536-HCR 90 Pages Vikita Thakur, Kinjoll Dey Last Updated: October 05, 2026
Automatic Pill Dispenser Market
Market Size
Forecast Period2026-2035
CAGR (2026-2035)7.8%
2025 Market SizeUSD 3.74 Billion
2035 Market SizeUSD 7.81 Billion
Key Players
Omnicell
Swisslog Healthcare
Baxter International
ARxIUM
ScriptPro
Capsa Healthcare
Opportunities
  • Adherence Data as a Billable Asset
  • Emerging Market Public Health Tenders
  • Decentralised Clinical Trials

Automatic Pill Dispenser Market Summary

The Automatic Pill Dispenser Market stood at USD 3.74 billion in 2025 and opens the forecast window at USD 3.97 billion in 2026, climbing to USD 7.81 billion by 2035 at a 7.8% CAGR. Two catalysts anchor that trajectory. First, the U.S. Centers for Medicare & Medicaid Services expanded remote patient monitoring reimbursement, with CPT 99453–99458 billing volumes rising sharply since 2021 [1]. Second, barcode-verification and controlled-substance diversion rules have pushed hospital pharmacy capital committees to replace manual carts on fixed refresh cycles [2].

The old mechanical, offline, audit-heavy legacy ward cabinets are being swapped out for networked units that timestamp every dose occurrence and feed it into the electronic health record. Integration is no longer a nice-to-have, but the purchase requirement. The US Office of the National Coordinator estimates that 96% of non-federal acute care hospitals currently operate certified EHRs [3]—vendors who bundle gear with predictive replenishment software report far shorter sales cycles.


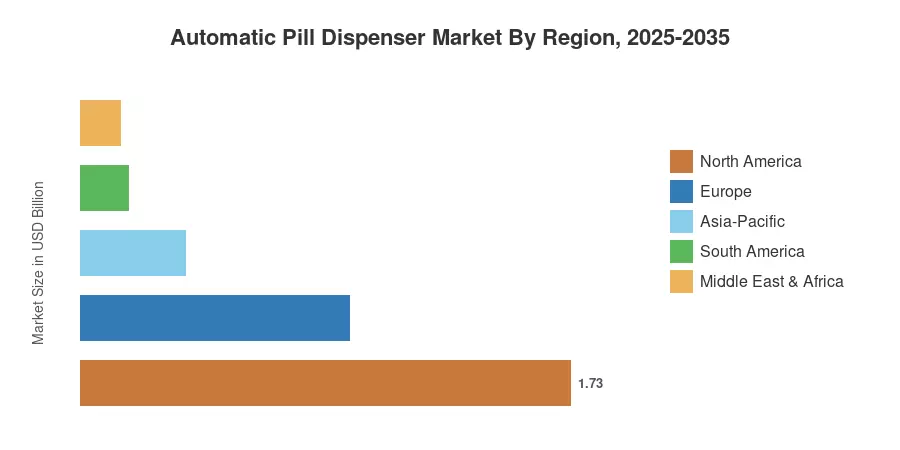
North America has 46.2% of 2025 revenue share, aided by high hospital automation adoption and Joint Commission medication-safety scrutiny. Asia-Pacific is expected to develop fastest at 9.9% CAGR through 2035 as China and Japan retrofit tertiary hospitals. Europe is the second largest market at 25.4%, driven by compliance spending for the EU Medical Device Regulation. The next decade will belong to the one who creates a billable service out of adherence data.


Key Report Takeaways

• By Technology

  • Electronic dispensers held 45.6% of Automatic Pill Dispenser Market revenue in 2025, the installed-base default across acute care.
  • AI-assisted predictive units are advancing at an 11.0% CAGR, the steepest technology curve in the Automatic Pill Dispenser Market.
  • Connected units generated roughly USD 0.98 billion in 2025 as telehealth workflows matured.

• By Sector

  • Hospital pharmacies commanded 65.8% of 2025 revenue, anchored by staffing-gap mitigation.
  • Home healthcare demand expands at a 12.4% CAGR, the fastest application segment.
  • Long-term care facilities contributed close to USD 0.26 billion in 2025

• By Geography

  • North America captured 46.2% of 2025 revenue
  • Asia-Pacific posts a 9.9% CAGR over 2026–2035
  • Europe generated approximately USD 0.95 billion in 2025


Market Size and Forecast (2021–2035)

The figures here are a mix of supplier revenue disclosures, hospital procurement tenders, customs-level device import statistics, and a bottom-up install-base model of about 11,400 acute care facilities across the five tracked regions. Historical years are reconciled to audited files; forecast years are based on cohort replacement rates for cabinets over seven years of age.
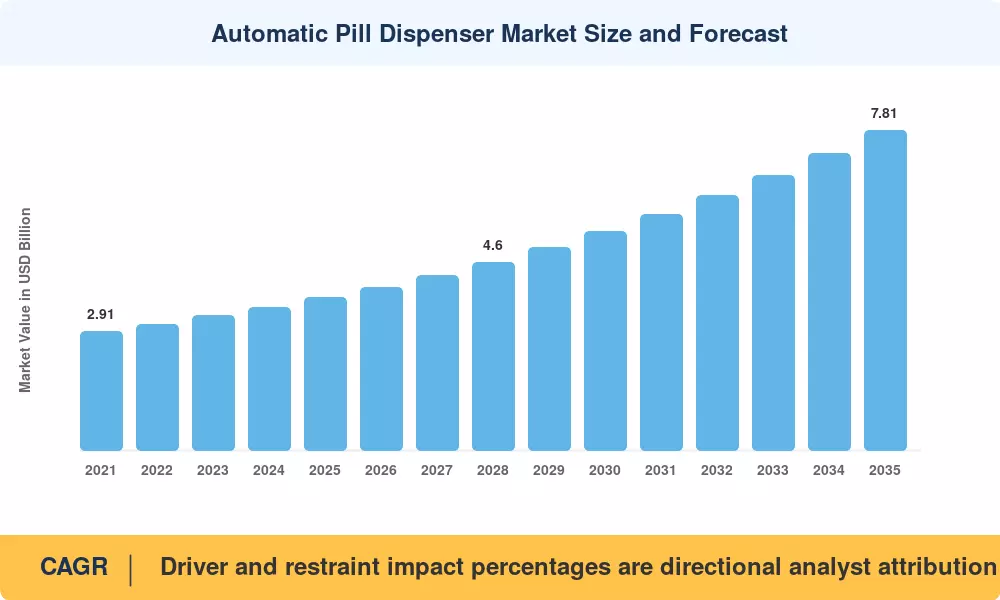
Automatic Pill Dispenser Market Size and Forecast
Our Impact

Enabled $4.3B Revenue Impact for Fortune 500 and Leading Multinationals

Partnering with 2000+ Global Organizations Each Year

30K+ Citations by Top-Tier Firms in the Industry

Driver Impact Analysis

Impact percentages below are directional attributions derived from analyst weighting of procurement surveys and regression against shipment data. They indicate relative pull on growth, not additive components of the headline CAGR, and individual drivers overlap in their effects.

Driver ~% Impact on CAGR Geographic Relevance Impact Timeline
Remote monitoring reimbursement expansion 1.7 North America, Europe Short-term (≤2 yr)
Clinical pharmacist and nurse staffing shortfall 1.5 Global Medium-term (2–4 yr)
Controlled-substance diversion audit mandates 1.2 North America Short-term (≤2 yr)
Chronic disease and polypharmacy prevalence 1.4 Asia-Pacific, Europe Long-term (≥4 yr)
EHR interoperability and FHIR adoption 0.9 North America, Europe Medium-term (2–4 yr)
Aging-in-place and home care policy funding 1.3 Japan, Nordics, US Long-term (≥4 yr)
Decentralised clinical trial protocols 0.6 Global Medium-term (2–4 yr)


Reimbursement Turns Adherence Into Revenue

Staffing Gaps Force Automation

Hospital pharmacy departments in the United States reported vacancy rates near 9% for pharmacy technicians in 2024, with turnover costs estimated at USD 40,000 per position [9]. Automation absorbs the repetitive cart-fill and cycle-count work that drives attrition. Facilities deploying centralized systems typically report a 60–70% reduction in manual dispensing touches, freeing licensed staff for clinical review.

Diversion Controls Tighten

DEA enforcement actions against hospital systems for recordkeeping failures have carried settlements exceeding USD 4 million in individual cases [2]. Biometric-authenticated cabinets with immutable audit logs shorten investigation timelines from weeks to hours. Compliance officers, not clinicians, increasingly sign the requisition.

Polypharmacy at Scale

The World Health Organization links medication errors to global costs approaching USD 42 billion annually, with older adults on five or more concurrent prescriptions carrying disproportionate risk [10]. Japan's over-75 cohort alone exceeds 20 million people. Devices that pre-sort, time-lock, and alert directly attack that error surface.


Restraints Impact Analysis

Restraint ~% Drag on CAGR Geographic Relevance Impact Timeline
High upfront capital and integration cost -1.6 Emerging markets Medium-term (2–4 yr)
Cybersecurity and medical device patching burden -1.1 North America, Europe Short-term (≤2 yr)
Reimbursement gaps for consumer-grade units -0.9 Global Medium-term (2–4 yr)
Workflow disruption and clinician resistance -0.7 Global Short-term (≤2 yr)
Fragmented regulatory classification -0.6 Asia-Pacific, MEA Long-term (≥4 yr)


The Capital Barrier

A fully integrated centralized system for a 400-bed hospital lands between USD 1.2 million and USD 2.8 million once interfaces, validation, and training are counted . Public hospitals in India, Brazil, and much of Africa cannot clear that hurdle without concessional financing. Vendors have responded with managed-service contracts, but adoption of those models remains thin outside North America.

Cyber Exposure Is Now a Purchasing Veto

FDA premarket cybersecurity requirements under Section 524B took effect in 2023, obliging manufacturers to supply a software bill of materials and a patch commitment [14]. Hospital CIOs routinely reject cabinets that cannot join single-sign-on or zero-trust segmentation. Legacy fleets running unsupported operating systems have become liabilities rather than depreciating assets.

Consumer Devices Fall Between Payer Categories

Home units frequently sit outside durable medical equipment schedules, leaving families to pay out of pocket at USD 300–900 per device plus subscription fees [1]. Until national coverage determinations settle, consumer volume will trail clinical demand.


Automatic Pill Dispenser Market Opportunities

Adherence Data as a Billable Asset

Timestamped dose events are clinically valuable to pharmaceutical sponsors, risk-bearing providers, and payers running star-ratings programs. Vendors licensing de-identified adherence feeds can build margin well above hardware, mirroring what remote glucose monitoring achieved [12]. This is the clearest new business model available in the Automatic Pill Dispenser Market.

Emerging Market Public Health Tenders

India's Ayushman Bharat network and Brazil's SUS modernization budgets are funding tertiary hospital upgrades where dispensing automation has near-zero penetration . Right-sized, lower-SKU cabinets priced under USD 120,000 open a volume tier that incumbents have largely ignored.

Decentralised Clinical Trials

Sponsors running remote protocols need auditable investigational product accountability. Connected dispensers with tamper logs satisfy that requirement, and trial budgets tolerate device costs that health systems will not [12].

Long-Term Care Consolidation

Multi-site operators standardising on one platform buy in fleets, not units. Group purchasing organisations covering more than 5,000 skilled nursing facilities in the United States are actively consolidating vendors [6].

Pharmacy Retail Micro-Automation

Community pharmacies facing prescription volume growth without staffing headroom are adopting countertop robotic fill units. Chains piloting these report script capacity gains near 25% per technician hour [6].


Automatic Pill Dispenser Market Future Outlook

Predictive Replenishment Becomes Standard

Machine-learning demand forecasting embedded in cabinet firmware is moving from pilot to specification. Early deployments report stock-out reductions near 35% and inventory carrying cost savings of USD 180,000 annually per large facility . By 2030, buyers will treat static par-level logic the way they now treat paper MARs.

Platform Economics Reshape Vendor Margins

Hardware gross margins compress as Asian manufacturers enter. Recurring software, analytics, and managed-service revenue will carry an estimated 40% of vendor profit pools by 2033, up from under 20% today, restructuring how the Automatic Pill Dispenser Market values its leaders.

Home Care Displaces Ward-Level Growth

Global health spending on home-based care is rising faster than institutional care in most OECD members [11]. Devices designed for kitchen counters — not pharmacy back-rooms — will absorb a growing share of incremental units, though revenue per unit stays far below clinical systems.

Sustainability and Device Lifecycle Reporting

EU corporate sustainability reporting obligations now reach medical device suppliers, pushing take-back schemes and refurbished cabinet programmes. Refurbished units already trade at 45–55% of new pricing and extend fleet life by four to six years [16].


Regional Market Share Analysis

Region 2025 Metric Primary Investment Themes
North America 46.2% share Diversion control, EHR-native cabinets, home monitoring
Europe USD 0.95 Billion MDR compliance, cross-border e-prescribing
Asia-Pacific 9.9% CAGR (2026–2035) Tertiary hospital retrofit, aging-in-place
South America USD 0.17 Billion Public tender modernization
Middle East & Africa 3.7% share Sovereign hospital build-outs
Total USD 3.74 Billion —

Regional performance in the Automatic Pill Dispenser Market splits along reimbursement maturity rather than income alone. Where payers fund adherence, connected devices sell; where they do not, demand stays confined to hospital capital budgets.


North America

Country Metric Key Driver
US 84.1% of region DEA audit exposure and CMS monitoring codes
Canada USD 0.19 Billion Provincial hospital automation grants
Mexico 8.4% CAGR IMSS facility upgrade programme


American demand is replacement-led. Roughly 70% of installed cabinets predate 2019, and interoperability requirements under the 21st Century Cures Act information-blocking rules make older fleets progressively harder to justify [3]. Canadian buying is slower but concentrated, with provincial health authorities tendering at system scale.

Europe

Country Metric Key Driver
Germany 24.6% of region Krankenhauszukunftsgesetz digital hospital funding
UK 19.3% of region NHS medicines optimisation programmes
France USD 0.13 Billion Hospital pharmacy centralisation
Italy 8.9% CAGR Regional procurement consolidation
Spain 7.8% of region Public hospital digitisation
Nordic Countries 9.4% CAGR Aging-in-place policy funding
Russia USD 0.04 Billion Domestic manufacturing substitution
Rest of Europe 11.2% of region EU MDR-driven fleet renewal


Germany's hospital future act committed roughly EUR 4.3 billion in federal digitisation funds, a share of which flows directly to closed-loop medication systems [16]. The EU Medical Device Regulation has simultaneously forced recertification of older devices, converting a compliance deadline into a replacement cycle across the bloc.

Asia-Pacific

Country Metric Key Driver
China 33.8% of region Tertiary hospital grading requirements
Japan USD 0.19 Billion Super-aged population and pharmacy robotics
India 12.6% CAGR Private hospital chain expansion
South Korea 9.7% of region Smart hospital certification scheme
ASEAN USD 0.07 Billion Medical tourism infrastructure
Rest of Asia-Pacific 6.4% of region Donor-funded facility upgrades


China's national tertiary hospital performance assessment scores facilities on medication safety metrics, which has made automated dispensing a scoring item rather than an optional efficiency play . Japan approaches the problem from the opposite direction: with more than 29% of citizens over 65, community pharmacy robotics and home units carry as much weight as hospital cabinets.

South America

Country Metric Key Driver
Brazil 61.4% of region SUS hospital modernization tenders
Argentina USD 0.03 Billion Private clinic network investment
Rest of South America 10.3% CAGR Chilean and Colombian hospital builds


Brazilian purchasing runs through public tender cycles that reward local content and long warranty terms, favouring vendors with regional service depots. Currency volatility remains the single largest deal-timing risk across the continent.

Middle East & Africa

Country Metric Key Driver
Saudi Arabia 34.7% of region Vision 2030 health cluster programme
UAE USD 0.03 Billion JCI accreditation requirements
South Africa 14.2% of region Private hospital group standardisation
Egypt 9.8% CAGR Universal health insurance rollout
Rest of MEA 12.6% of region Donor-funded pharmacy strengthening


Gulf demand is greenfield rather than replacement. Saudi Arabia's health cluster restructuring has specified closed-loop medication management in new hospital designs, letting operators skip the mechanical generation entirely [17]. Sub-Saharan procurement remains grant-dependent and lumpy.


Automatic Pill Dispenser Market By Region, 2025-2035

Automatic Pill Dispenser Market Segmentation

Segment structure in the Automatic Pill Dispenser Market follows four dimensions: type, capacity, application, and technology. Concentration is high in type and application, considerably flatter in capacity.

By Type

Segment 2025 Metric Primary Demand Driver
Centralized 68.7% share Hospital pharmacy consolidation
Decentralized USD 0.65 Billion Ward-level nursing efficiency
Smart/IoT-Enabled 12.2% CAGR Remote monitoring reimbursement
Robotic USD 0.17 Billion High-volume script fulfilment


Centralized systems dominate because the economics only work at scale: one automated pharmacy hub can serve an entire multi-building campus. Smart and IoT-enabled units grow fastest from a small base, and they are the segment where new entrants have realistic entry economics — the hardware is simpler, and the distribution is direct-to-consumer or through home health agencies rather than through hospital capital committees.

By Capacity

Segment 2025 Metric Primary Demand Driver
Low 21.5% share Home and small clinic use
Mid 47.2% share Community hospitals and retail pharmacy
High 9.6% CAGR Centralized fill and mail-order pharmacy


Mid-range capacity is the volume sweet spot, matching the SKU counts of facilities between 100 and 400 beds. High-capacity units grow faster as mail-order and specialty pharmacy fulfilment centres scale.

By Application

Segment 2025 Metric Primary Demand Driver
Hospital Pharmacy 65.8% share Diversion control and staffing gaps
Retail Pharmacy USD 0.49 Billion Script volume per technician hour
Home Healthcare 12.4% CAGR Aging-in-place and monitoring codes
Long-Term Care USD 0.26 Billion Multi-site operator standardisation
Outpatient 8.6% CAGR Ambulatory surgery centre growth


Hospital pharmacy remains the revenue anchor of the Automatic Pill Dispenser Market and will stay so through 2035, but its share erodes roughly eight percentage points over the decade. Home healthcare is where the narrative shifts: what began as a caregiver convenience product now sits inside reimbursed care plans, and vendors that solved consumer-grade usability early hold a durable advantage in home medication management.

By Technology

Segment 2025 Metric Primary Demand Driver
Mechanical 18.9% share Low-cost and off-grid settings
Electronic 45.6% share Installed-base replacement cycles
Connected USD 0.98 Billion EHR integration mandates
AI-Assisted 11.0% CAGR Predictive replenishment value case


Electronic alarm-based dispensers hold the largest technology share simply because they define the current installed base. AI-assisted units grow fastest, and their advantage is commercial rather than clinical — they let vendors sell an ROI model instead of a feature list.


Competitive Benchmarking

Concentration level in the Automatic Pill Dispenser Market is Moderate. The top five suppliers account for an estimated 52-58% of global sales, generating an approximate HHI in the 900-1,100 range – concentrated at the clinical end, really fragmented in home and consumer devices where dozens of regional companies compete. Acquisition activity has been directed toward software competence rather than manufacturing capacity.

Company Est. Revenue Share Range Key Offerings for Automatic Pill Dispenser Market Strategic Positioning
Omnicell ~17–21% Centralized cabinets, IV compounding, adherence platform Category leader; software-attach strategy
Becton, Dickinson and Company ~14–18% Pyxis dispensing, Parata pharmacy robotics Scale incumbent with broad hospital footprint
Swisslog Healthcare ~7–10% Automated storage, pharmacy logistics Strong European and Gulf project delivery
Baxter International ~5–8% Infusion and medication management systems Adjacency play from infusion install base
ARxIUM ~4–6% High-volume robotic fill, workflow software Mail-order and central-fill specialist
ScriptPro ~3–5% Retail pharmacy robotics, workflow systems Community pharmacy channel depth
Capsa Healthcare ~3–5% Mobile carts, decentralized dispensing Cost-competitive ward-level provider
Yuyama Co., Ltd. ~3–5% Tablet packaging, dispensing robotics Japan and ASEAN market leadership
Willach Group ~2–4% Modular pharmacy storage and dispensing European independent pharmacy focus
MedMinder Systems ~1–3% Connected home dispensers, cellular monitoring Direct-to-consumer and home health channel
Hero Health ~1–3% Subscription home units, caregiver app Consumer-subscription business model


Recent News & Developments

  • Omnicell (March 2024): Launched an expanded cloud analytics tier for its dispensing fleet, pushing recurring revenue above one-third of total sales and signalling the industry's software pivot [18].
  • US FDA (October 2023): Section 524B premarket cybersecurity requirements became fully enforceable, obliging dispensing device makers to submit software bills of materials with every new submission [14].
  • Becton, Dickinson and Company (July 2023): Completed integration of Parata Systems into its pharmacy automation unit, combining hospital cabinets with community pharmacy robotics under one commercial organisation [19].
  • CMS (January 2024): Clarified billing pathways for remote therapeutic monitoring device supply, removing ambiguity that had slowed home device deployment by health systems [1].
  • Swisslog Healthcare (September 2024): Secured a multi-hospital automation contract with a Gulf health cluster covering pharmacy logistics across newly commissioned facilities [17].
  • European Commission (January 2025): Extended selected MDR transition deadlines while confirming that legacy devices without valid certificates lose market access, accelerating fleet renewal planning [15].
  • Hero Health (May 2024): Announced a payer partnership placing subscription home dispensers with Medicare Advantage members flagged for adherence risk [20].
  • Yuyama (November 2024): Introduced a compact tablet-packaging unit aimed at ASEAN community pharmacies at roughly half the footprint of prior models [21].


Automatic Pill Dispenser Market Report Scope

Parameter Detail
Market Scope Global automated and connected pill dispensing hardware, software, and associated services.
Study Period 2021–2035 (Historical 2021–2024; Base Year 2025; Forecast 2026–2035)
CAGR 7.8% (2026–2035)
Market Size Checkpoints USD 3.74 Billion (2025); USD 3.97 Billion (2026); USD 7.81 Billion (2035)
Fastest Growing Segments Home Healthcare (application); AI-Assisted (technology); Smart/IoT-Enabled (type)
Companies Profiled 11 leading suppliers across clinical, retail, and consumer channels
Valuation Currency USD Billion
CAGR Driver Disclaimer Driver and restraint impact percentages are directional analyst attributions and are not additive components of the headline growth rate.

FAQs

What total cost of ownership assumptions should procurement teams model when entering the Automatic Pill Dispenser Market?
Budget interface build, validation, and training at roughly 35–45% above hardware list price. Annual service contracts typically add 8–12% of capital cost. Five-year TCO, not sticker price, decides most tenders .
How should buyers compare centralized systems against decentralized ward cabinets?
Centralized systems win on inventory control and pharmacist oversight; decentralized cabinets win on nurse retrieval time. Facilities above 250 beds generally justify a hybrid, running central fill with ward-level satellites [4].
Which contractual protections matter most in Automatic Pill Dispenser Market vendor agreements?
Insist on a patch commitment tied to the FDA cybersecurity guidance, defined API access without per-transaction fees, and data portability on termination. Vendors resist the third clause hardest [14].
What integration failures most often delay deployments?
Pharmacy information system mapping errors and inconsistent formulary identifiers cause the majority of go-live slips. Allocate eight to twelve weeks for interface testing before the first live ward [24].
Are refurbished units a credible option for Automatic Pill Dispenser Market buyers with tight budgets?
Yes, at 45–55% of new pricing, provided the operating system remains vendor-supported. Verify certification currency under regional device rules before purchase [16].
How do accreditation bodies view automated dispensing?
Standards require documented override policies, blind count procedures, and periodic override review. Automation reduces findings only when governance is documented alongside it [22].
What signals suggest a vendor's software roadmap is real rather than marketing?
Look for published FHIR resource support, named reference sites running predictive replenishment, and disclosed recurring revenue share in filings. Absent all three, treat roadmap claims cautiously [18].      
Author
Author Author Profile Vikita Thakur LinkedIn Senior Research Analyst
She holds an experience of about 5+ years in market research and business consulting projects for sectors such as life sciences, medical devices, and healthcare IT. She possesses a robust background in data analysis, market estimation, competitive intelligence, pipeline analysis market trend identification, and consumer behavior insights. Her expertise lies in technical Sales support, client interaction and project management, designing and implementing market research studies, conducting competitive analysis, and synthesizing complex data into actionable recommendations that drive business growth.
Co-Author Co-Author Profile Kinjoll Dey LinkedIn Senior Research Analyst
He is an extremely curious individual currently working in Healthcare and Medical Devices Domain. Kinjoll is comfortably versed in data centric research backed by healthcare educational background. He leverages extensive data mining and analytics tools such as Primary and Secondary Research, Statistical Analysis, Machine Learning, Data Modelling. His key role also involves Technical Sales Support, Client Interaction and Project management within the Healthcare team. Lastly, he showcases extensive affinity towards learning new skills and remain fascinated in implementing them.

Research Approach


Secondary Research

The secondary research process involved comprehensive analysis of medical device regulatory databases, pharmacy automation journals, healthcare IT publications, and authoritative health organizations. Key sources included the US Food & Drug Administration (FDA) Center for Devices and Radiological Health, European Medicines Agency (EMA) Medical Device Coordination Group, World Health Organization (WHO) Medication Safety Programme, Centers for Disease Control and Prevention (CDC) Medication Safety Office, National Institutes of Health (NIH) National Institute on Aging, National Center for Biotechnology Information (NCBI/PubMed), Centers for Medicare & Medicaid Services (CMS) Durable Medical Equipment Database, Health Resources and Services Administration (HRSA), Agency for Healthcare Research and Quality (AHRQ), Institute for Safe Medication Practices (ISMP), American Society of Health-System Pharmacists (ASHP), Healthcare Information and Management Systems Society (HIMSS), ECRI Institute Health Technology Assessment, Health Canada Medical Devices Directorate, UK Medicines and Healthcare products Regulatory Agency (MHRA), Japan Pharmaceuticals and Medical Devices Agency (PMDA), China National Medical Products Administration (NMPA), EU Eurostat Healthcare Statistics, OECD Health Statistics, and national health ministry reports on aging populations and medication adherence. These sources were used to collect medical device approval data, medication adherence statistics, hospital pharmacy automation trends, aging demographics, chronic disease prevalence, and regulatory landscape analysis for centralized automated dispensing systems, decentralized cabinet systems, and IoT-connected smart dispensers.


Primary Research

To gather both qualitative and quantitative information, the primary research process involved interviewing players from both the supply and demand sides. CEOs, VPs of medical device development, chief pharmacy officers, heads of regulatory affairs, and commercial directors from healthcare technology providers, automated pill dispenser manufacturers, and pharmacy automation firms were among the supply-side sources. Directors of hospital pharmacies, administrators of long-term care facilities, chief nursing officers, biomedical engineers, geriatricians, and procurement leads from hospital health systems, specialty pharmacies, nursing homes, and assisted living facilities made up the demand-side sources. Clinical adoption hurdles, reimbursement coding, pharmacy workflow integration, and cybersecurity compliance for linked devices were among the topics covered in the primary research that corroborated product development timetables and supported market segmentation.

Primary Respondent Breakdown:

By Designation: C-level Primaries (38%), Director Level (30%), Others (32%)

By Region: North America (40%), Europe (25%), Asia-Pacific (28%), Rest of World (7%)


Market Size Estimation

Global market valuation was derived through revenue mapping and unit shipment analysis. The methodology included:

Identification of 30+ key manufacturers across North America, Europe, Asia-Pacific, and Latin America specializing in centralized robotic dispensing, automated dispensing cabinets, and portable smart dispensers

Product mapping across centralized systems (robotic carousels, pharmacy robots), decentralized systems (ward-based cabinets, unit-dose dispensers), and connected/smart dispensers (Bluetooth, Wi-Fi, cellular-enabled)

Analysis of reported and modeled annual revenues specific to automated dispensing portfolios, including hardware sales and subscription software revenues

Coverage of manufacturers representing 65-70% of global market share in 2024

Extrapolation using bottom-up (unit shipments × average selling price by country/region) and top-down (manufacturer revenue validation) approaches to derive segment-specific valuations for hospital, long-term care, and home healthcare settings

Download Free Sample

Kindly complete the form below to receive a free sample of this Report

Download PDF ×

We do not share your information with anyone. However, we may send you emails based on your report interest from time to time. You may contact us at any time to opt-out.

















