Request Free Sample ×

Kindly complete the form below to receive a free sample of this Report

* Please use a valid business email

Leading companies partner with us for data-driven Insights

clients tt-cursor
Hero Background

Asia-Pacific Data Center Market

ID: MRFR/ICT/20009-HCR
128 Pages
Aarti Dhapte
Last Updated: April 06, 2026

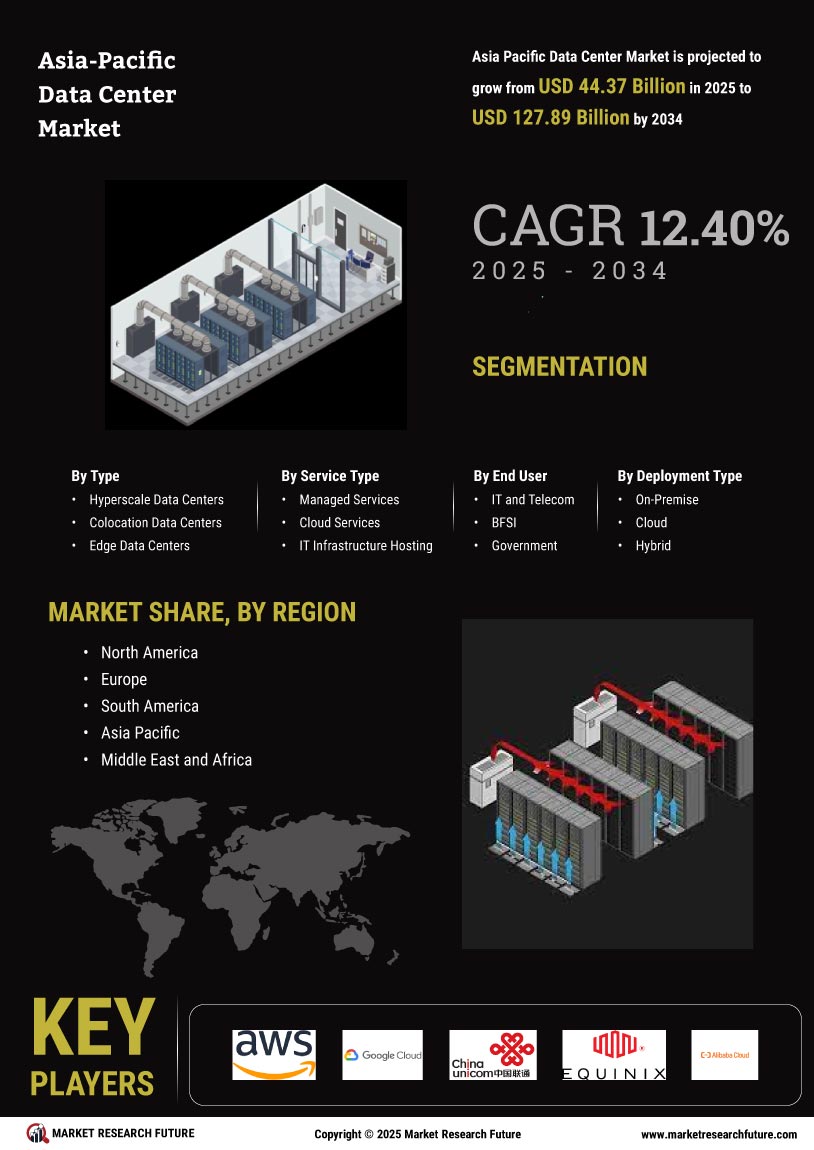
Asia-Pacific Data Center Market Size, Share and Trends Analysis Research Report By Type (Hyperscale Data Centers, Colocation Data Centers, Edge Data Centers, Enterprise Data Centers), By Service Type (Managed Services, Cloud Services, IT Infrastructure Hosting, Data Center Monitoring Services), By End User (IT and Telecom, BFSI, Government, Healthcare, Retail), By Deployment Type (On-Premise, Cloud, Hybrid) and By Regional (North America, Europe, South America, Asia Pacific), Middle East and Africa) - Forecast to 2035.

Share:
Download PDF ×

We do not share your information with anyone. However, we may send you emails based on your report interest from time to time. You may contact us at any time to opt-out.

  1. SECTION I: EXECUTIVE SUMMARY AND KEY HIGHLIGHTS |
    1. 1.1 EXECUTIVE SUMMARY | |
      1. 1.1.1 Market Overview | |
      2. 1.1.2 Key Findings | |
      3. 1.1.3 Market Segmentation | |
      4. 1.1.4 Competitive Landscape | |
      5. 1.1.5 Challenges and Opportunities | |
      6. 1.1.6 Future Outlook 2
  2. SECTION II: SCOPING, METHODOLOGY AND MARKET STRUCTURE |
    1. 2.1 MARKET INTRODUCTION | |
      1. 2.1.1 Definition | |
      2. 2.1.2 Scope of the study | | |
        1. 2.1.2.1 Research Objective | | |
        2. 2.1.2.2 Assumption | | |
        3. 2.1.2.3 Limitations |
    2. 2.2 RESEARCH METHODOLOGY | |
      1. 2.2.1 Overview | |
      2. 2.2.2 Data Mining | |
      3. 2.2.3 Secondary Research | |
      4. 2.2.4 Primary Research | | |
        1. 2.2.4.1 Primary Interviews and Information Gathering Process | | |
        2. 2.2.4.2 Breakdown of Primary Respondents | |
      5. 2.2.5 Forecasting Model | |
      6. 2.2.6 Market Size Estimation | | |
        1. 2.2.6.1 Bottom-Up Approach | | |
        2. 2.2.6.2 Top-Down Approach | |
      7. 2.2.7 Data Triangulation | |
      8. 2.2.8 Validation 3
  3. SECTION III: QUALITATIVE ANALYSIS |
    1. 3.1 MARKET DYNAMICS | |
      1. 3.1.1 Overview | |
      2. 3.1.2 Drivers | |
      3. 3.1.3 Restraints | |
      4. 3.1.4 Opportunities |
    2. 3.2 MARKET FACTOR ANALYSIS | |
      1. 3.2.1 Value chain Analysis | |
      2. 3.2.2 Porter's Five Forces Analysis | | |
        1. 3.2.2.1 Bargaining Power of Suppliers | | |
        2. 3.2.2.2 Bargaining Power of Buyers | | |
        3. 3.2.2.3 Threat of New Entrants | | |
        4. 3.2.2.4 Threat of Substitutes | | |
        5. 3.2.2.5 Intensity of Rivalry | |
      3. 3.2.3 COVID-19 Impact Analysis | | |
        1. 3.2.3.1 Market Impact Analysis | | |
        2. 3.2.3.2 Regional Impact | | |
        3. 3.2.3.3 Opportunity and Threat Analysis 4
  4. SECTION IV: QUANTITATIVE ANALYSIS |
    1. 4.1 Information and Communications Technology, BY Application (USD Billion) | |
      1. 4.1.1 Cloud Computing | |
      2. 4.1.2 Colocation Services | |
      3. 4.1.3 Managed Hosting | |
      4. 4.1.4 Disaster Recovery | |
      5. 4.1.5 Big Data Analytics |
    2. 4.2 Information and Communications Technology, BY End Use (USD Billion) | |
      1. 4.2.1 IT and Telecommunications | |
      2. 4.2.2 BFSI | |
      3. 4.2.3 Government | |
      4. 4.2.4 Healthcare | |
      5. 4.2.5 Retail |
    3. 4.3 Information and Communications Technology, BY Type (USD Billion) | |
      1. 4.3.1 Hyperscale Data Centre | |
      2. 4.3.2 Edge Data Centre | |
      3. 4.3.3 Modular Data Centre | |
      4. 4.3.4 Enterprise Data Centre |
    4. 4.4 Information and Communications Technology, BY Power Source (USD Billion) | |
      1. 4.4.1 Renewable Energy | |
      2. 4.4.2 Grid Power | |
      3. 4.4.3 Backup Generators | |
      4. 4.4.4 Hybrid Power |
    5. 4.5 Information and Communications Technology, BY Cooling Technology (USD Billion) | |
      1. 4.5.1 Air Cooling | |
      2. 4.5.2 Liquid Cooling | |
      3. 4.5.3 Evaporative Cooling | |
      4. 4.5.4 Free Cooling 5
  5. SECTION V: COMPETITIVE ANALYSIS |
    1. 5.1 Competitive Landscape | |
      1. 5.1.1 Overview | |
      2. 5.1.2 Competitive Analysis | |
      3. 5.1.3 Market share Analysis | |
      4. 5.1.4 Major Growth Strategy in the Information and Communications Technology | |
      5. 5.1.5 Competitive Benchmarking | |
      6. 5.1.6 Leading Players in Terms of Number of Developments in the Information and Communications Technology | |
      7. 5.1.7 Key developments and growth strategies | | |
        1. 5.1.7.1 New Product Launch/Service Deployment | | |
        2. 5.1.7.2 Merger & Acquisitions | | |
        3. 5.1.7.3 Joint Ventures | |
      8. 5.1.8 Major Players Financial Matrix | | |
        1. 5.1.8.1 Sales and Operating Income | | |
        2. 5.1.8.2 Major Players R&D Expenditure. 2023 |
    2. 5.2 Company Profiles | |
      1. 5.2.1 Equinix (US) | | |
        1. 5.2.1.1 Financial Overview | | |
        2. 5.2.1.2 Products Offered | | |
        3. 5.2.1.3 Key Developments | | |
        4. 5.2.1.4 SWOT Analysis | | |
        5. 5.2.1.5 Key Strategies | |
      2. 5.2.2 Digital Realty (US) | | |
        1. 5.2.2.1 Financial Overview | | |
        2. 5.2.2.2 Products Offered | | |
        3. 5.2.2.3 Key Developments | | |
        4. 5.2.2.4 SWOT Analysis | | |
        5. 5.2.2.5 Key Strategies | |
      3. 5.2.3 NTT Communications (JP) | | |
        1. 5.2.3.1 Financial Overview | | |
        2. 5.2.3.2 Products Offered | | |
        3. 5.2.3.3 Key Developments | | |
        4. 5.2.3.4 SWOT Analysis | | |
        5. 5.2.3.5 Key Strategies | |
      4. 5.2.4 China Telecom (CN) | | |
        1. 5.2.4.1 Financial Overview | | |
        2. 5.2.4.2 Products Offered | | |
        3. 5.2.4.3 Key Developments | | |
        4. 5.2.4.4 SWOT Analysis | | |
        5. 5.2.4.5 Key Strategies | |
      5. 5.2.5 Alibaba Cloud (CN) | | |
        1. 5.2.5.1 Financial Overview | | |
        2. 5.2.5.2 Products Offered | | |
        3. 5.2.5.3 Key Developments | | |
        4. 5.2.5.4 SWOT Analysis | | |
        5. 5.2.5.5 Key Strategies | |
      6. 5.2.6 Telehouse (GB) | | |
        1. 5.2.6.1 Financial Overview | | |
        2. 5.2.6.2 Products Offered | | |
        3. 5.2.6.3 Key Developments | | |
        4. 5.2.6.4 SWOT Analysis | | |
        5. 5.2.6.5 Key Strategies | |
      7. 5.2.7 CyrusOne (US) | | |
        1. 5.2.7.1 Financial Overview | | |
        2. 5.2.7.2 Products Offered | | |
        3. 5.2.7.3 Key Developments | | |
        4. 5.2.7.4 SWOT Analysis | | |
        5. 5.2.7.5 Key Strategies | |
      8. 5.2.8 Global Switch (HK) | | |
        1. 5.2.8.1 Financial Overview | | |
        2. 5.2.8.2 Products Offered | | |
        3. 5.2.8.3 Key Developments | | |
        4. 5.2.8.4 SWOT Analysis | | |
        5. 5.2.8.5 Key Strategies | |
      9. 5.2.9 Vocus Group (AU) | | |
        1. 5.2.9.1 Financial Overview | | |
        2. 5.2.9.2 Products Offered | | |
        3. 5.2.9.3 Key Developments | | |
        4. 5.2.9.4 SWOT Analysis | | |
        5. 5.2.9.5 Key Strategies | |
      10. 5.2.10 NEXTDC (AU) | | |
        1. 5.2.10.1 Financial Overview | | |
        2. 5.2.10.2 Products Offered | | |
        3. 5.2.10.3 Key Developments | | |
        4. 5.2.10.4 SWOT Analysis | | |
        5. 5.2.10.5 Key Strategies |
    3. 5.3 Appendix | |
      1. 5.3.1 References | |
      2. 5.3.2 Related Reports 6 LIST OF FIGURES |
    4. 6.1 MARKET SYNOPSIS |
    5. 6.2 APAC MARKET ANALYSIS BY APPLICATION |
    6. 6.3 APAC MARKET ANALYSIS BY END USE |
    7. 6.4 APAC MARKET ANALYSIS BY TYPE |
    8. 6.5 APAC MARKET ANALYSIS BY POWER SOURCE |
    9. 6.6 APAC MARKET ANALYSIS BY COOLING TECHNOLOGY |
    10. 6.7 KEY BUYING CRITERIA OF INFORMATION AND COMMUNICATIONS TECHNOLOGY |
    11. 6.8 RESEARCH PROCESS OF MRFR |
    12. 6.9 DRO ANALYSIS OF INFORMATION AND COMMUNICATIONS TECHNOLOGY |
    13. 6.10 DRIVERS IMPACT ANALYSIS: INFORMATION AND COMMUNICATIONS TECHNOLOGY |
    14. 6.11 RESTRAINTS IMPACT ANALYSIS: INFORMATION AND COMMUNICATIONS TECHNOLOGY |
    15. 6.12 SUPPLY / VALUE CHAIN: INFORMATION AND COMMUNICATIONS TECHNOLOGY |
    16. 6.13 INFORMATION AND COMMUNICATIONS TECHNOLOGY, BY APPLICATION, 2024 (% SHARE) |
    17. 6.14 INFORMATION AND COMMUNICATIONS TECHNOLOGY, BY APPLICATION, 2024 TO 2035 (USD Billion) |
    18. 6.15 INFORMATION AND COMMUNICATIONS TECHNOLOGY, BY END USE, 2024 (% SHARE) |
    19. 6.16 INFORMATION AND COMMUNICATIONS TECHNOLOGY, BY END USE, 2024 TO 2035 (USD Billion) |
    20. 6.17 INFORMATION AND COMMUNICATIONS TECHNOLOGY, BY TYPE, 2024 (% SHARE) |
    21. 6.18 INFORMATION AND COMMUNICATIONS TECHNOLOGY, BY TYPE, 2024 TO 2035 (USD Billion) |
    22. 6.19 INFORMATION AND COMMUNICATIONS TECHNOLOGY, BY POWER SOURCE, 2024 (% SHARE) |
    23. 6.20 INFORMATION AND COMMUNICATIONS TECHNOLOGY, BY POWER SOURCE, 2024 TO 2035 (USD Billion) |
    24. 6.21 INFORMATION AND COMMUNICATIONS TECHNOLOGY, BY COOLING TECHNOLOGY, 2024 (% SHARE) |
    25. 6.22 INFORMATION AND COMMUNICATIONS TECHNOLOGY, BY COOLING TECHNOLOGY, 2024 TO 2035 (USD Billion) |
    26. 6.23 BENCHMARKING OF MAJOR COMPETITORS 7 LIST OF TABLES |
    27. 7.1 LIST OF ASSUMPTIONS | |
      1. 7.1.1 |
    28. 7.2 APAC MARKET SIZE ESTIMATES; FORECAST | |
      1. 7.2.1 BY APPLICATION, 2026-2035 (USD Billion) | |
      2. 7.2.2 BY END USE, 2026-2035 (USD Billion) | |
      3. 7.2.3 BY TYPE, 2026-2035 (USD Billion) | |
      4. 7.2.4 BY POWER SOURCE, 2026-2035 (USD Billion) | |
      5. 7.2.5 BY COOLING TECHNOLOGY, 2026-2035 (USD Billion) |
    29. 7.3 PRODUCT LAUNCH/PRODUCT DEVELOPMENT/APPROVAL | |
      1. 7.3.1 |
    30. 7.4 ACQUISITION/PARTNERSHIP | |

APAC Information and Communications Technology Market Segmentation

Information and Communications Technology By Application (USD Billion, 2026-2035)

  • Cloud Computing
  • Colocation Services
  • Managed Hosting
  • Disaster Recovery
  • Big Data Analytics

Information and Communications Technology By End Use (USD Billion, 2026-2035)

  • IT and Telecommunications
  • BFSI
  • Government
  • Healthcare
  • Retail

Information and Communications Technology By Type (USD Billion, 2026-2035)

  • Hyperscale Data Centre
  • Edge Data Centre
  • Modular Data Centre
  • Enterprise Data Centre

Information and Communications Technology By Power Source (USD Billion, 2026-2035)

  • Renewable Energy
  • Grid Power
  • Backup Generators
  • Hybrid Power

Information and Communications Technology By Cooling Technology (USD Billion, 2026-2035)

  • Air Cooling
  • Liquid Cooling
  • Evaporative Cooling
  • Free Cooling

Compare Licence

×
Features License Type
Single User Multiuser License Enterprise User
Price $4,950 $5,950 $7,250
Maximum User Access Limit 1 User Upto 10 Users Unrestricted Access Throughout the Organization
Free Customization
Direct Access to Analyst
Deliverable Format
Platform Access
Discount on Next Purchase 10% 15% 15%
Printable Versions